Downloaded 162 times
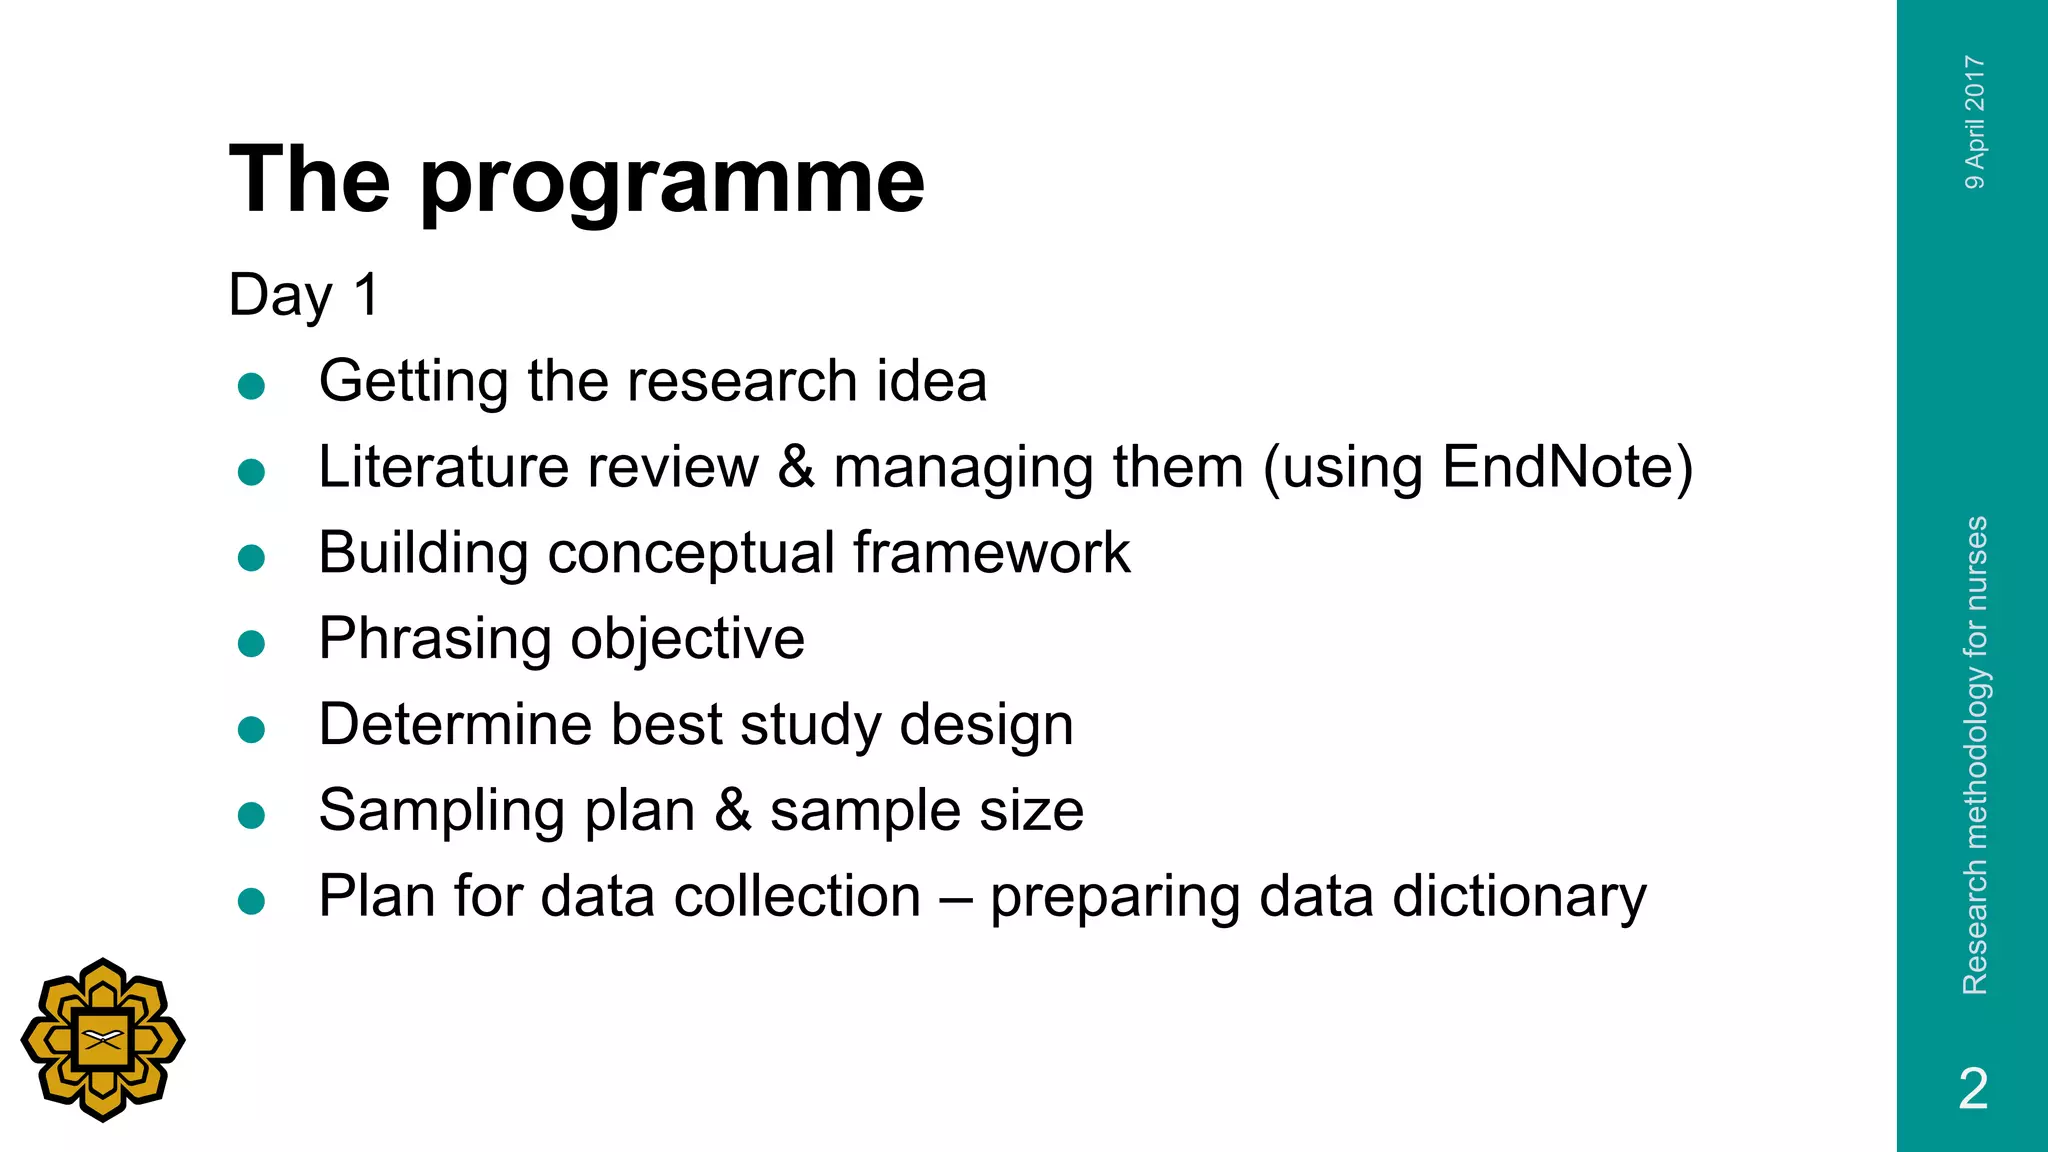


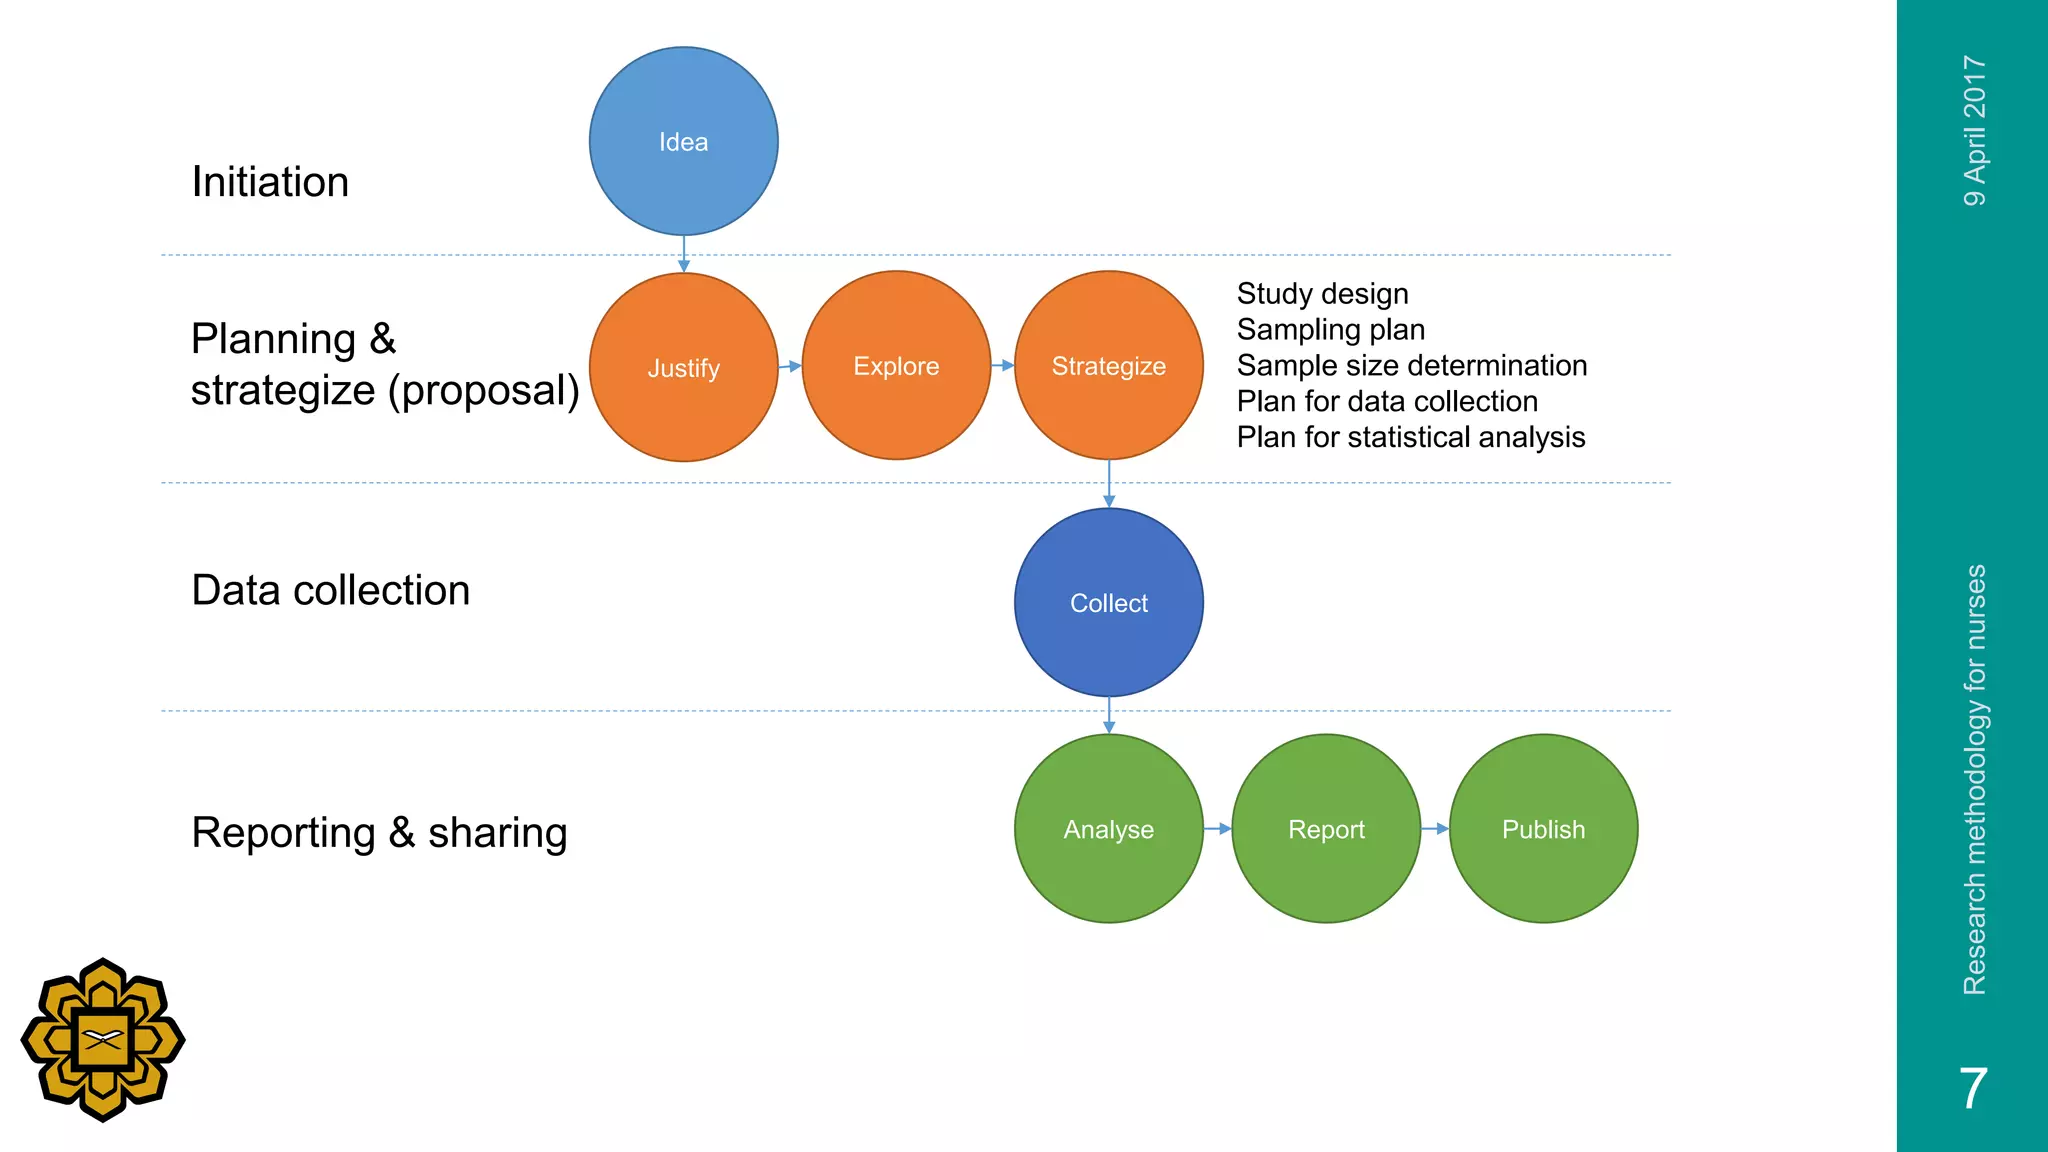


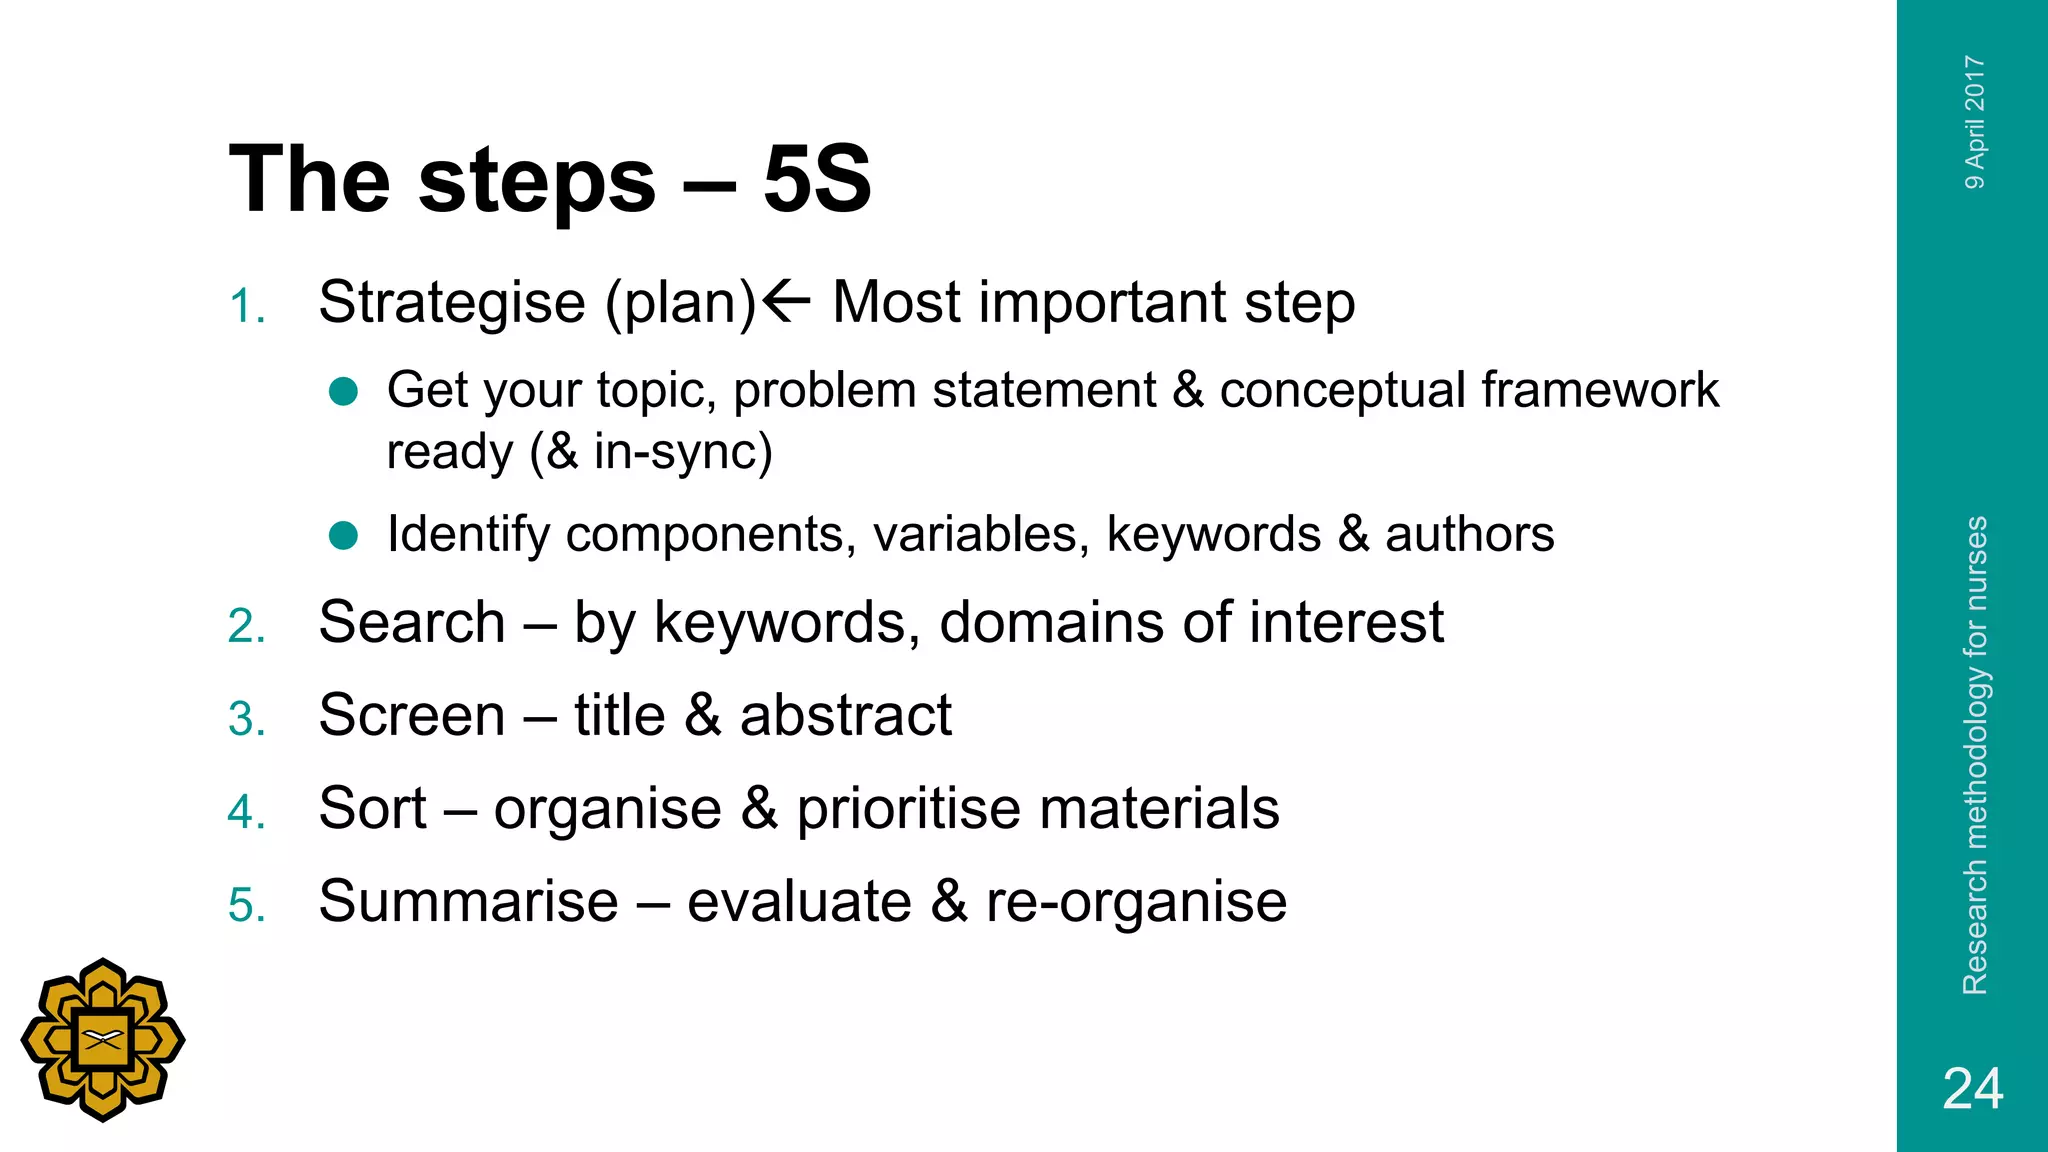
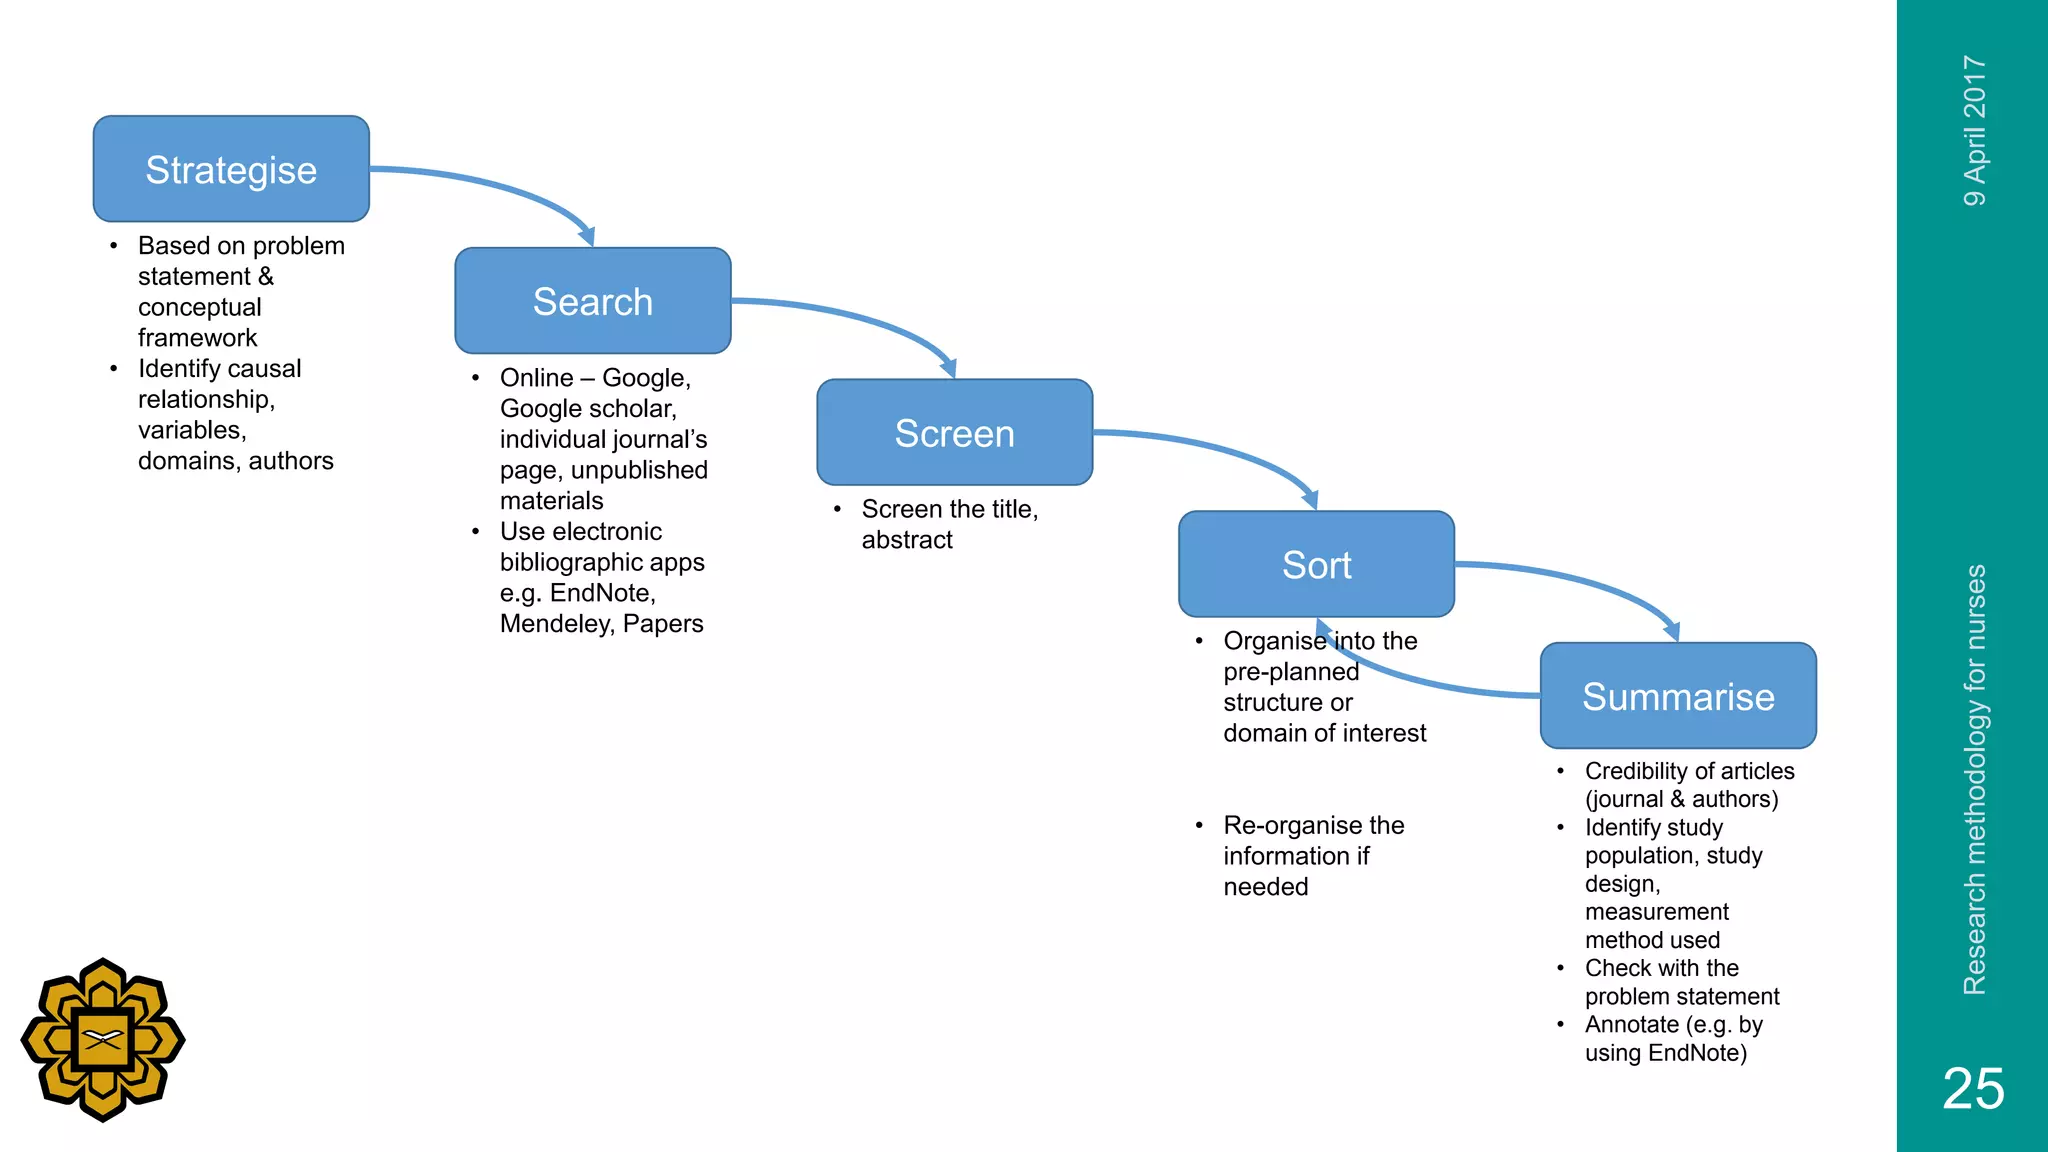
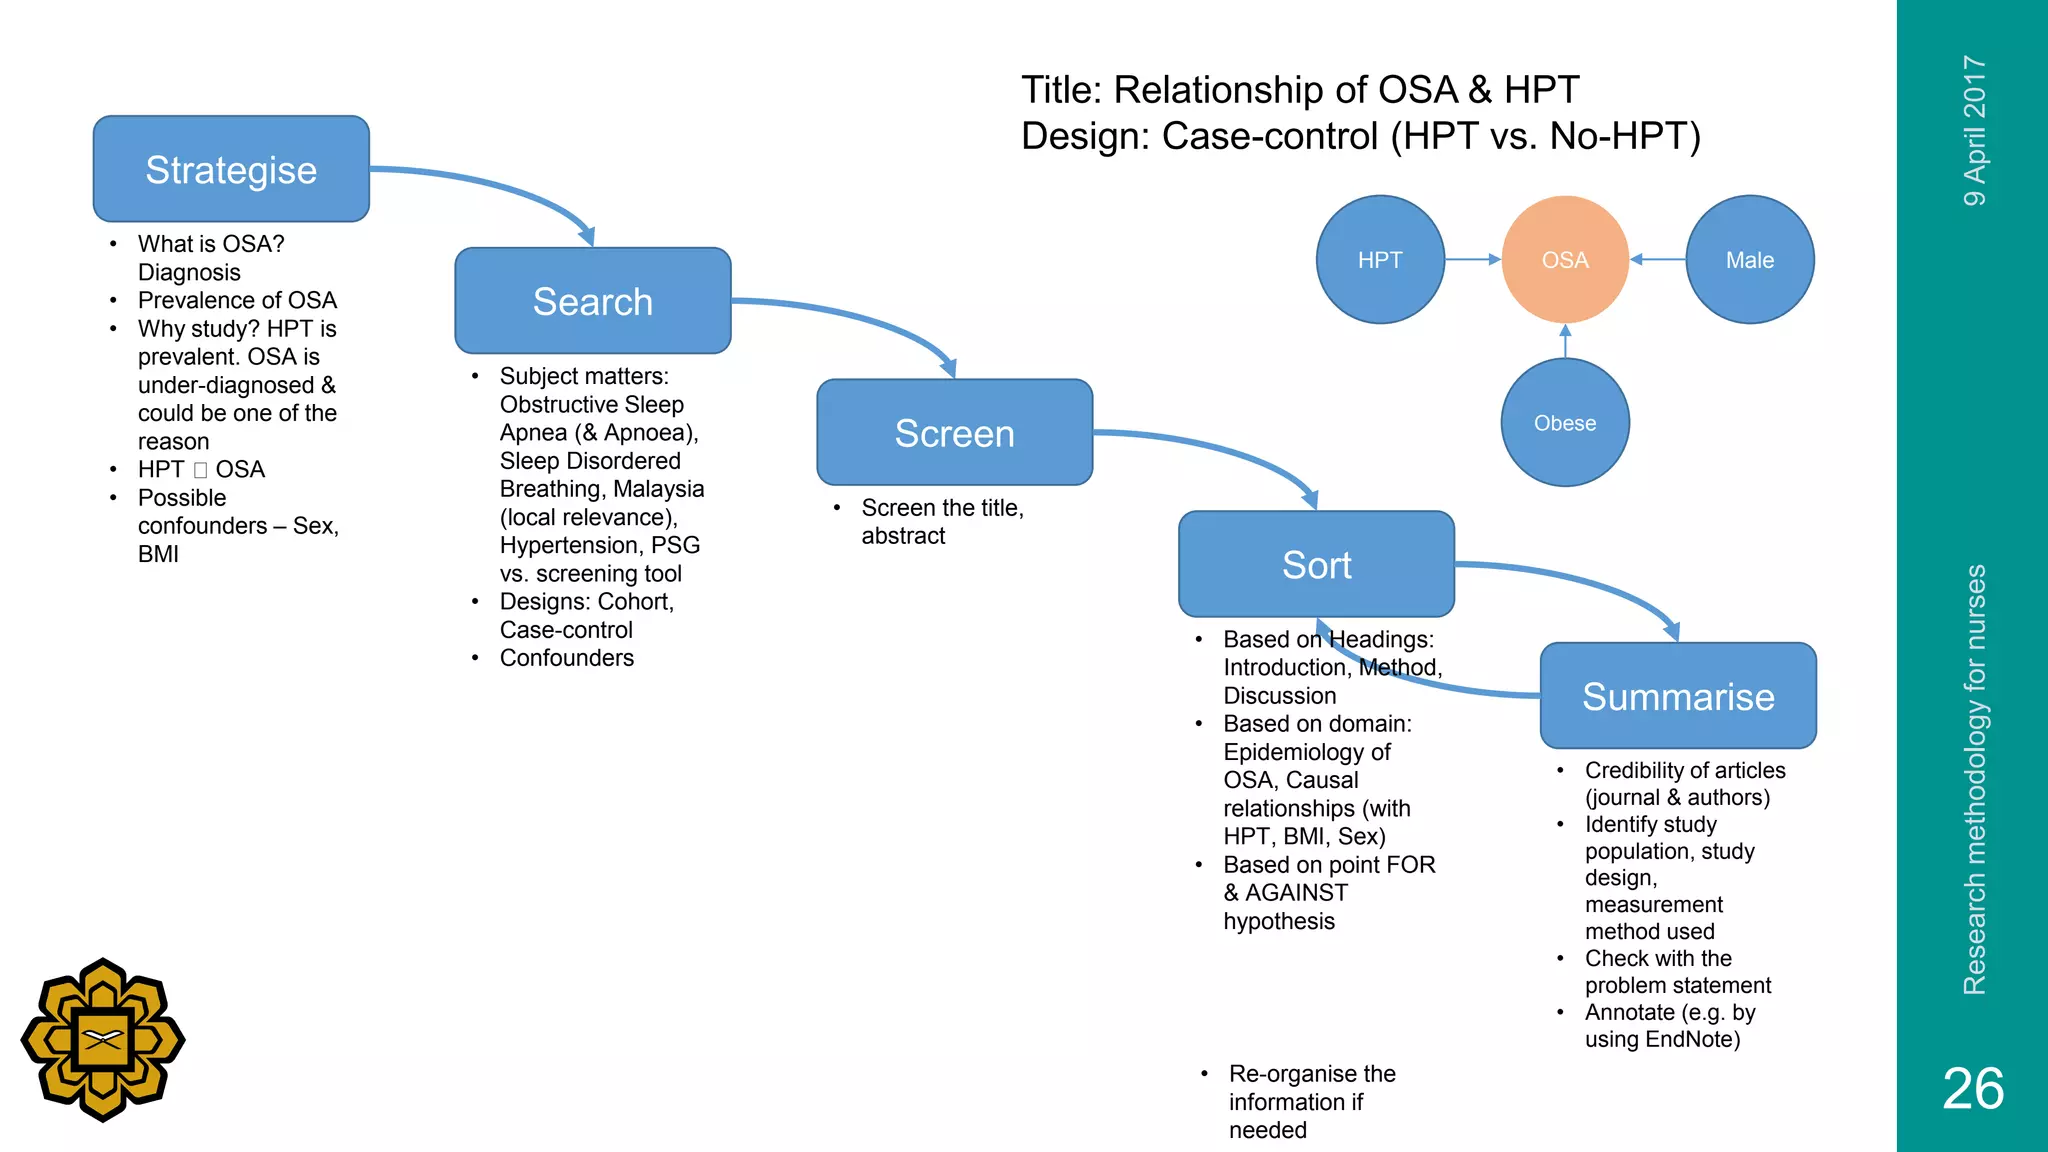
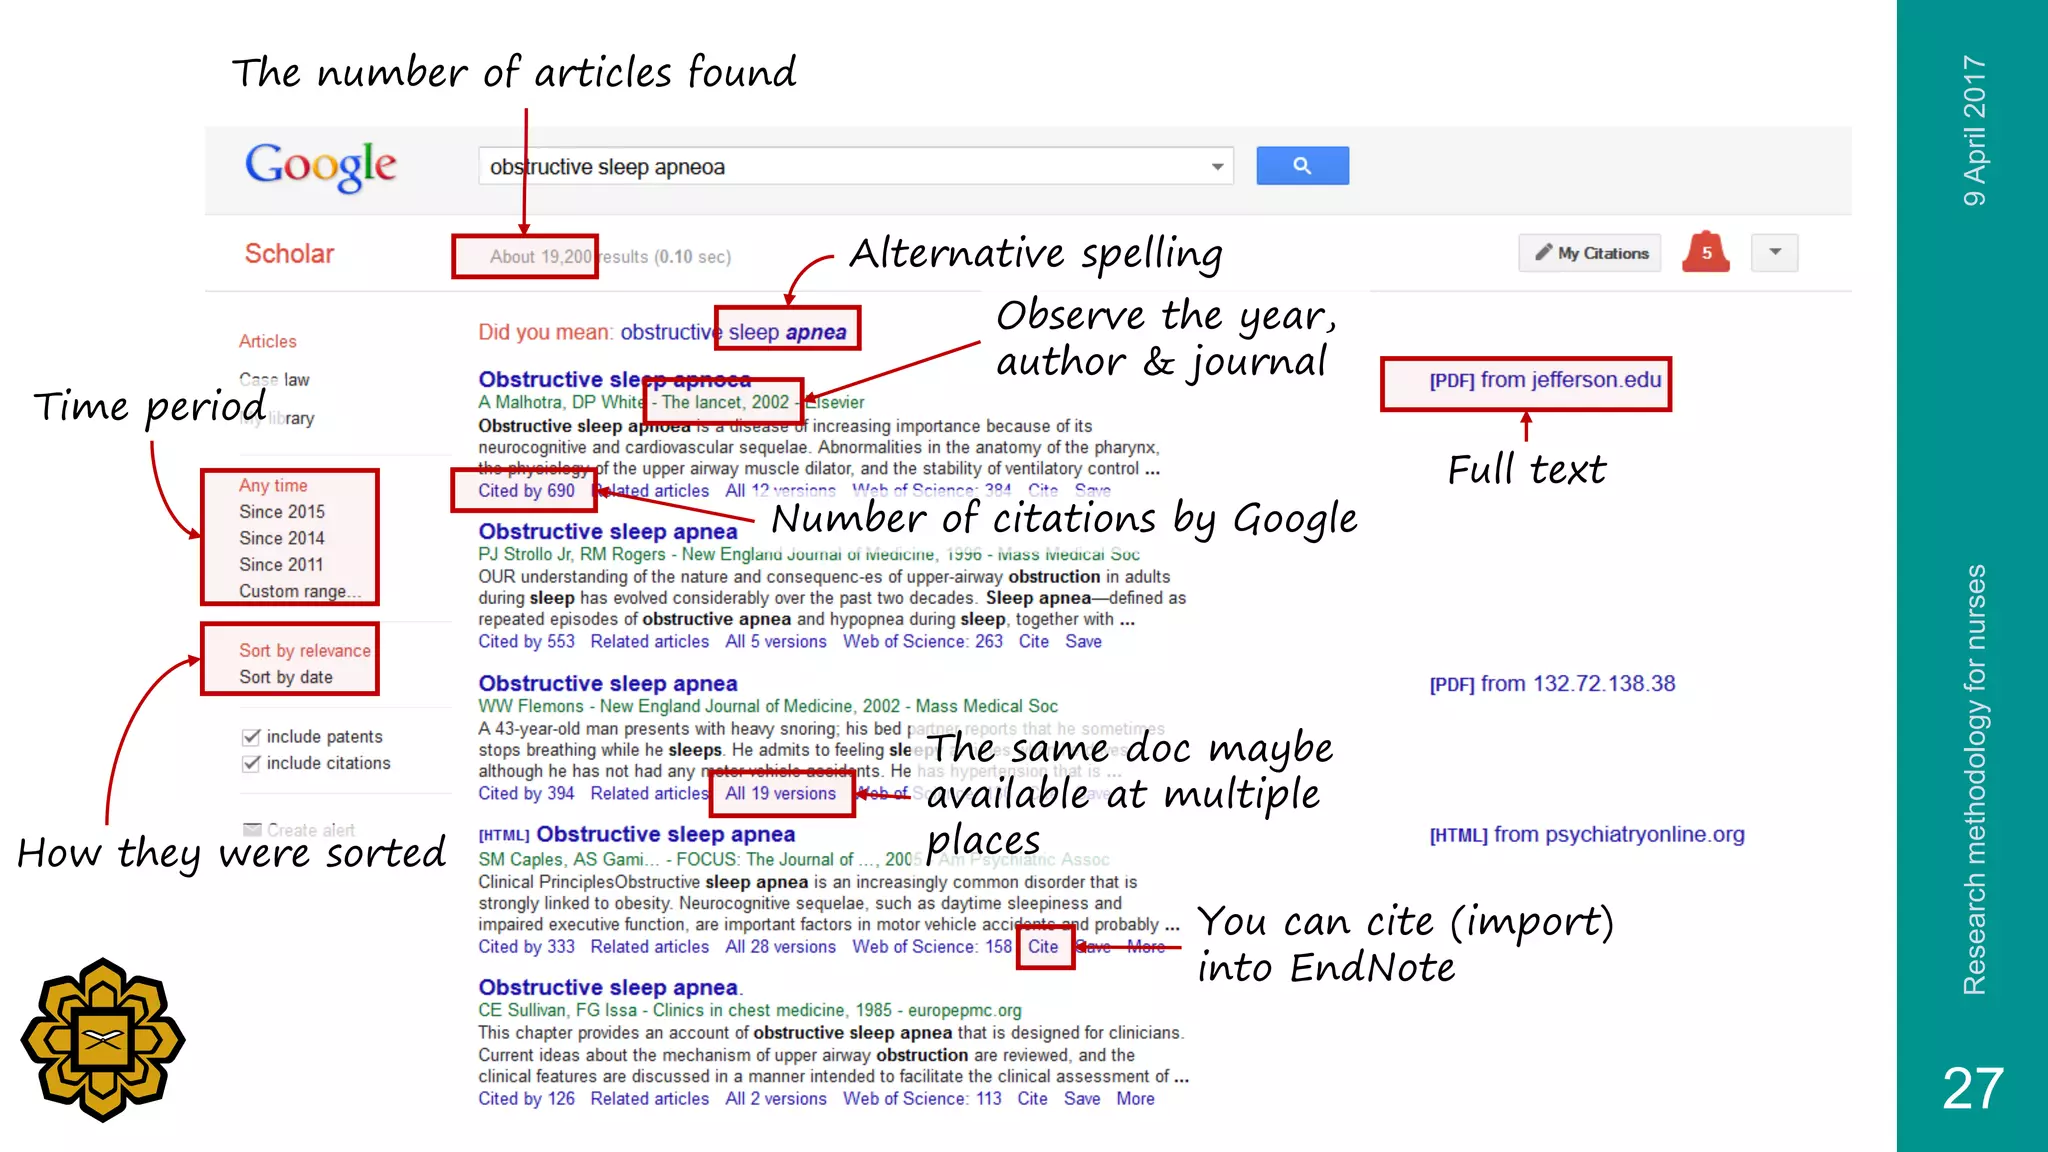
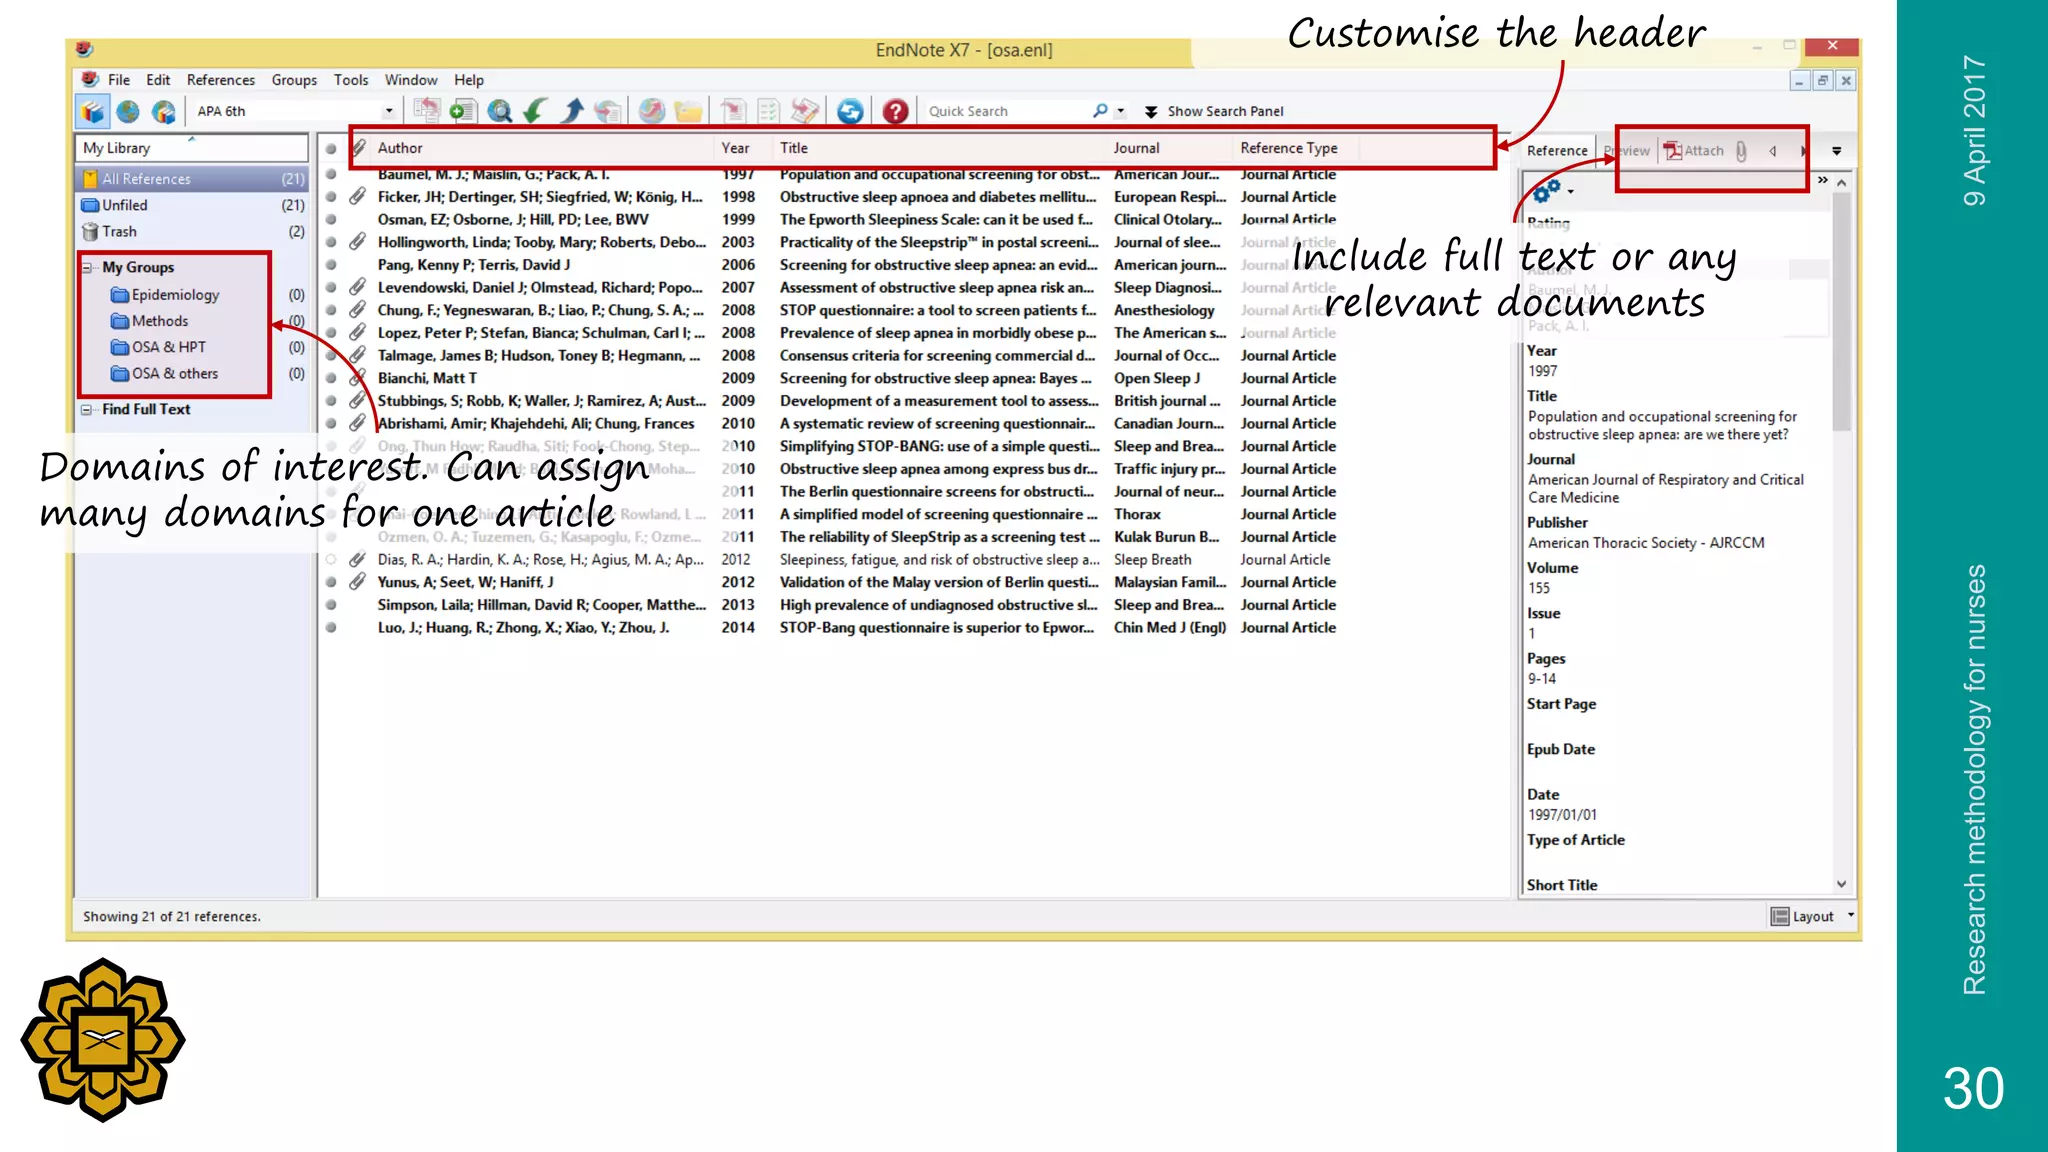
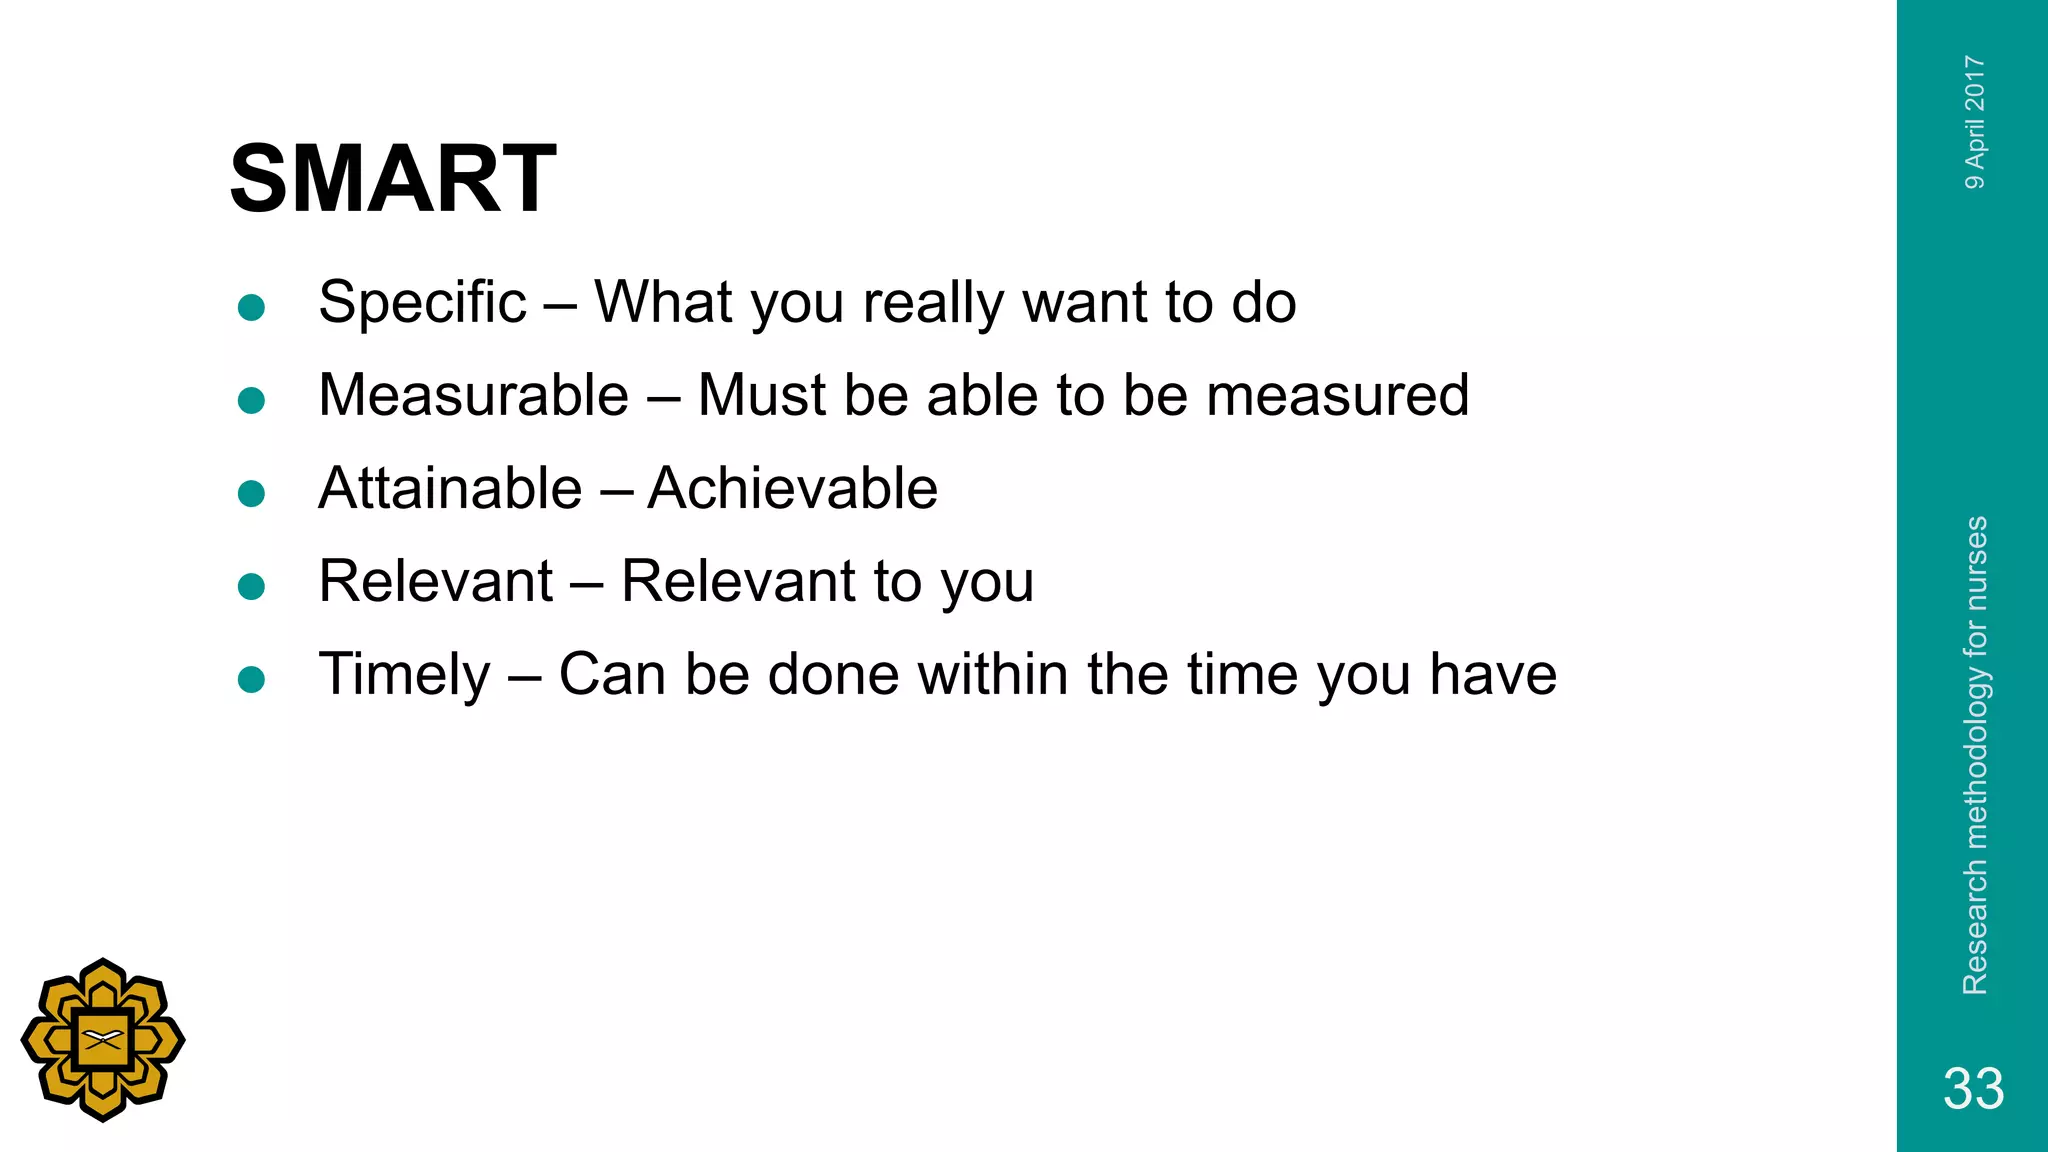
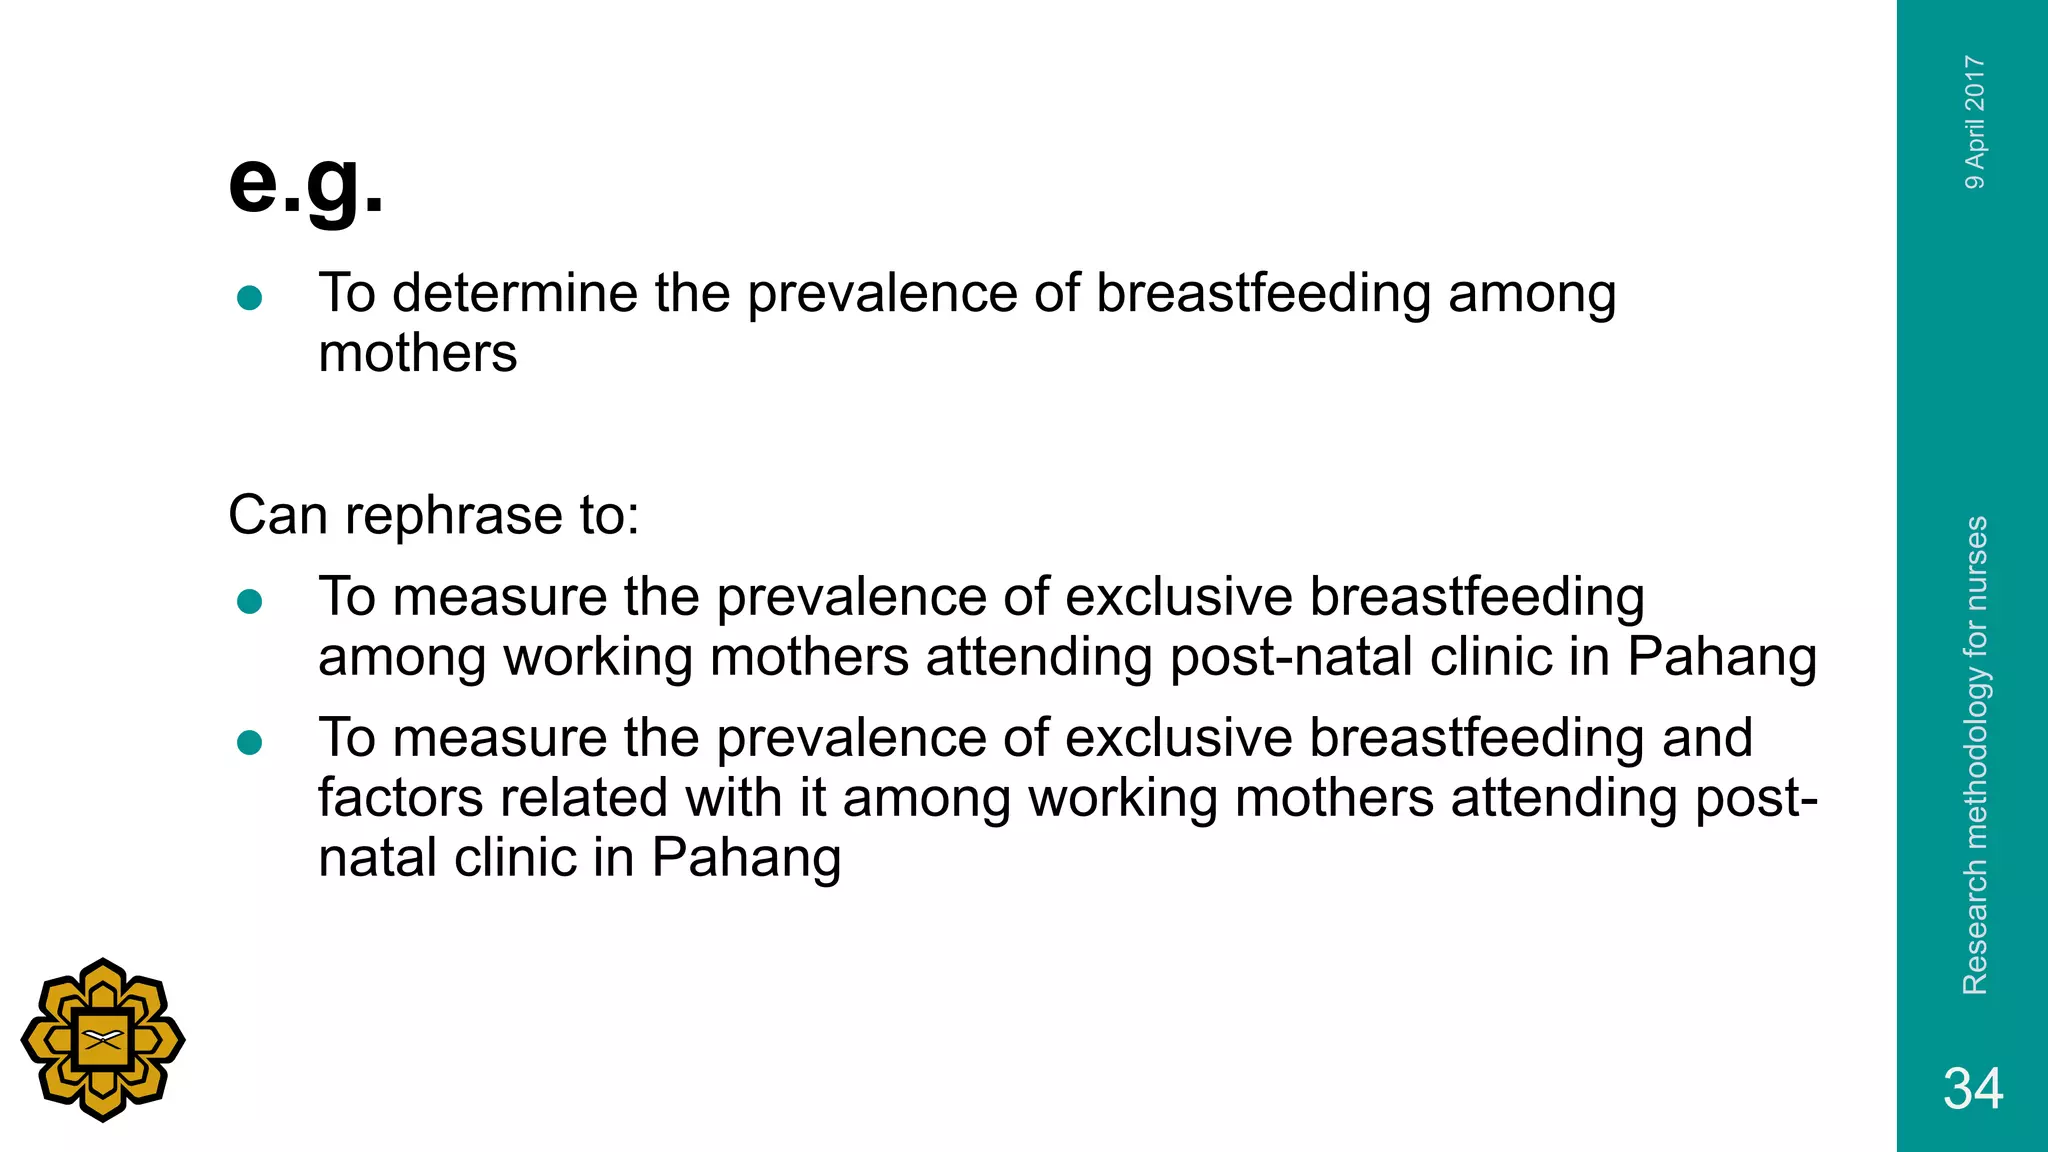

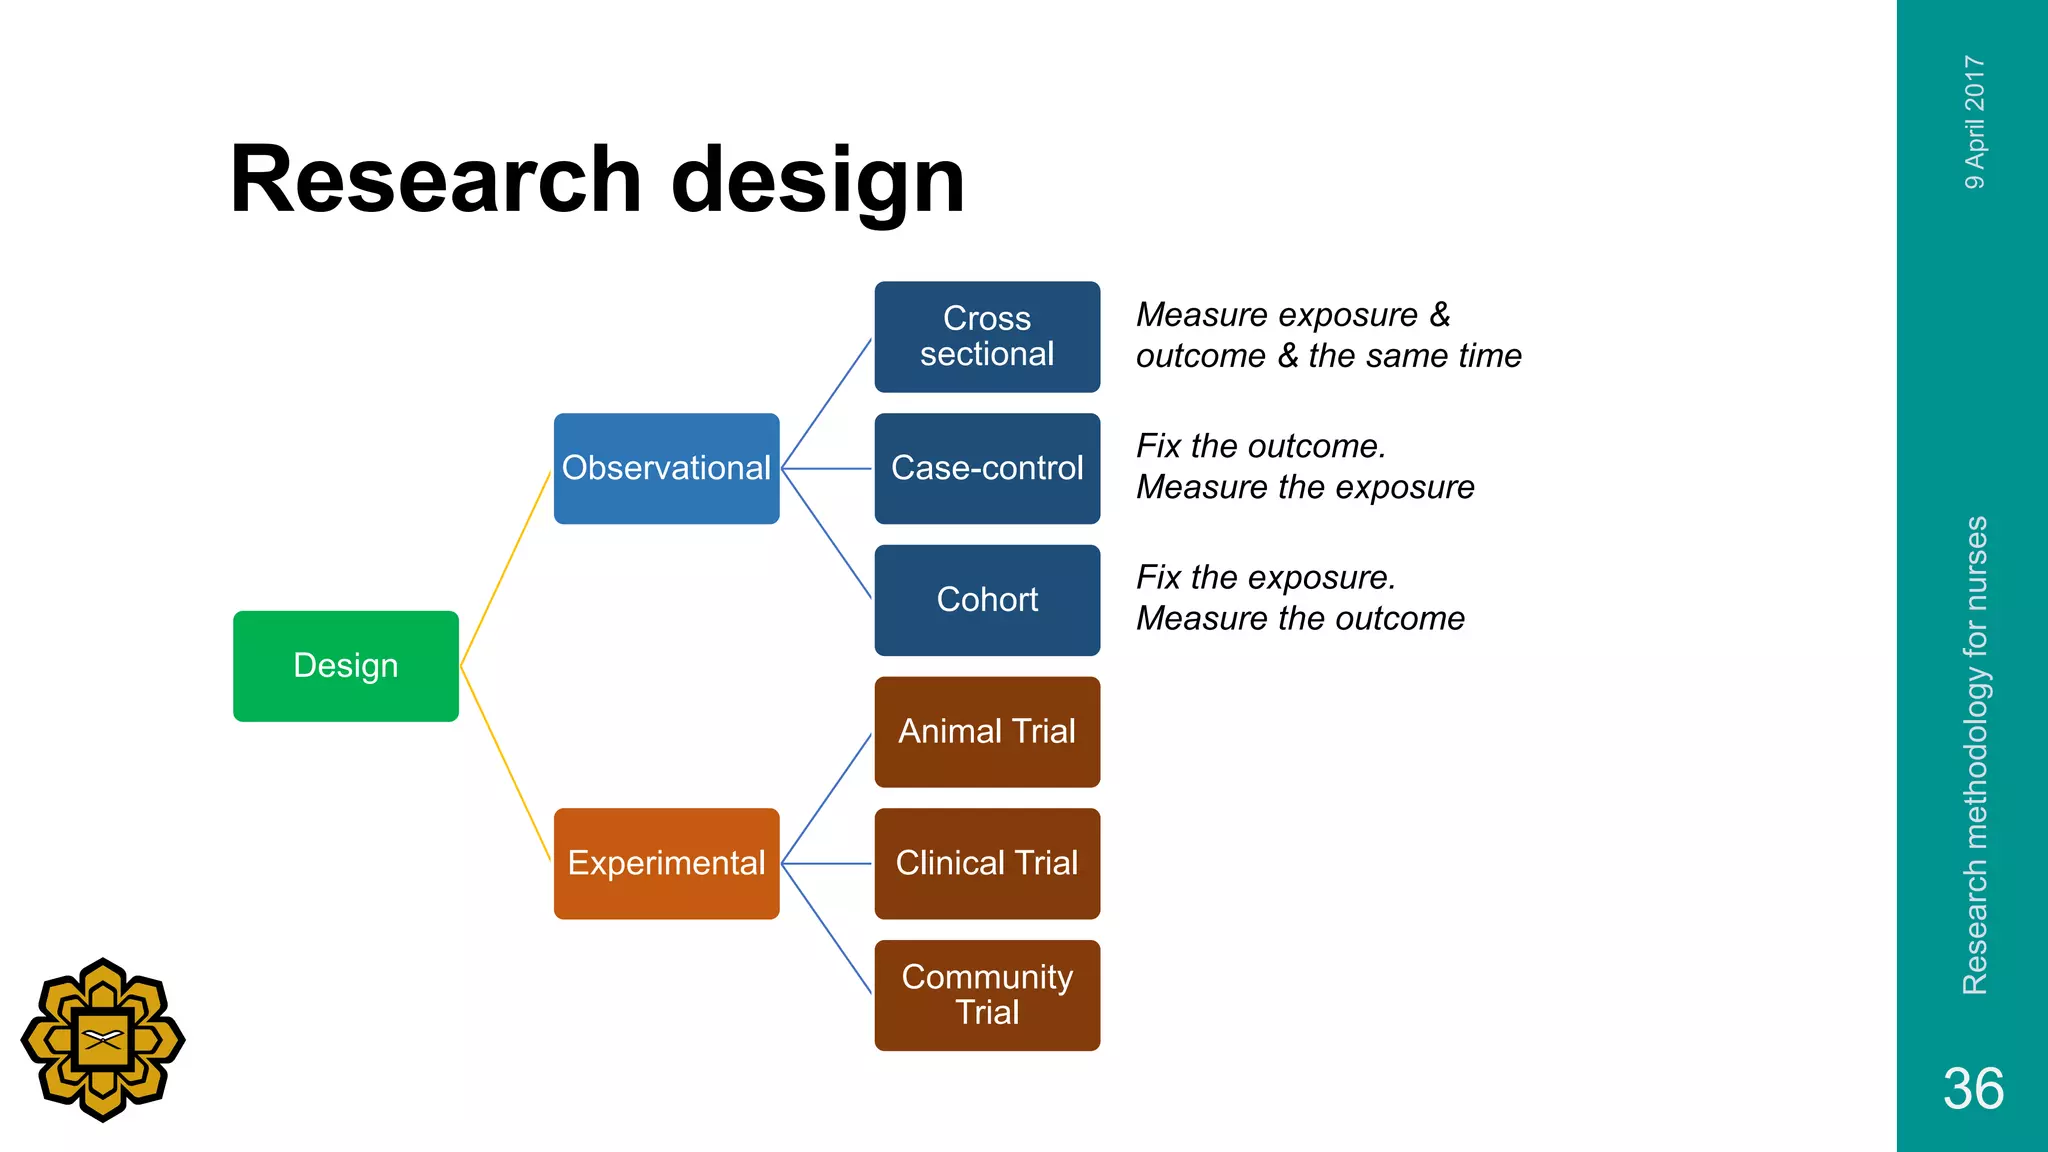
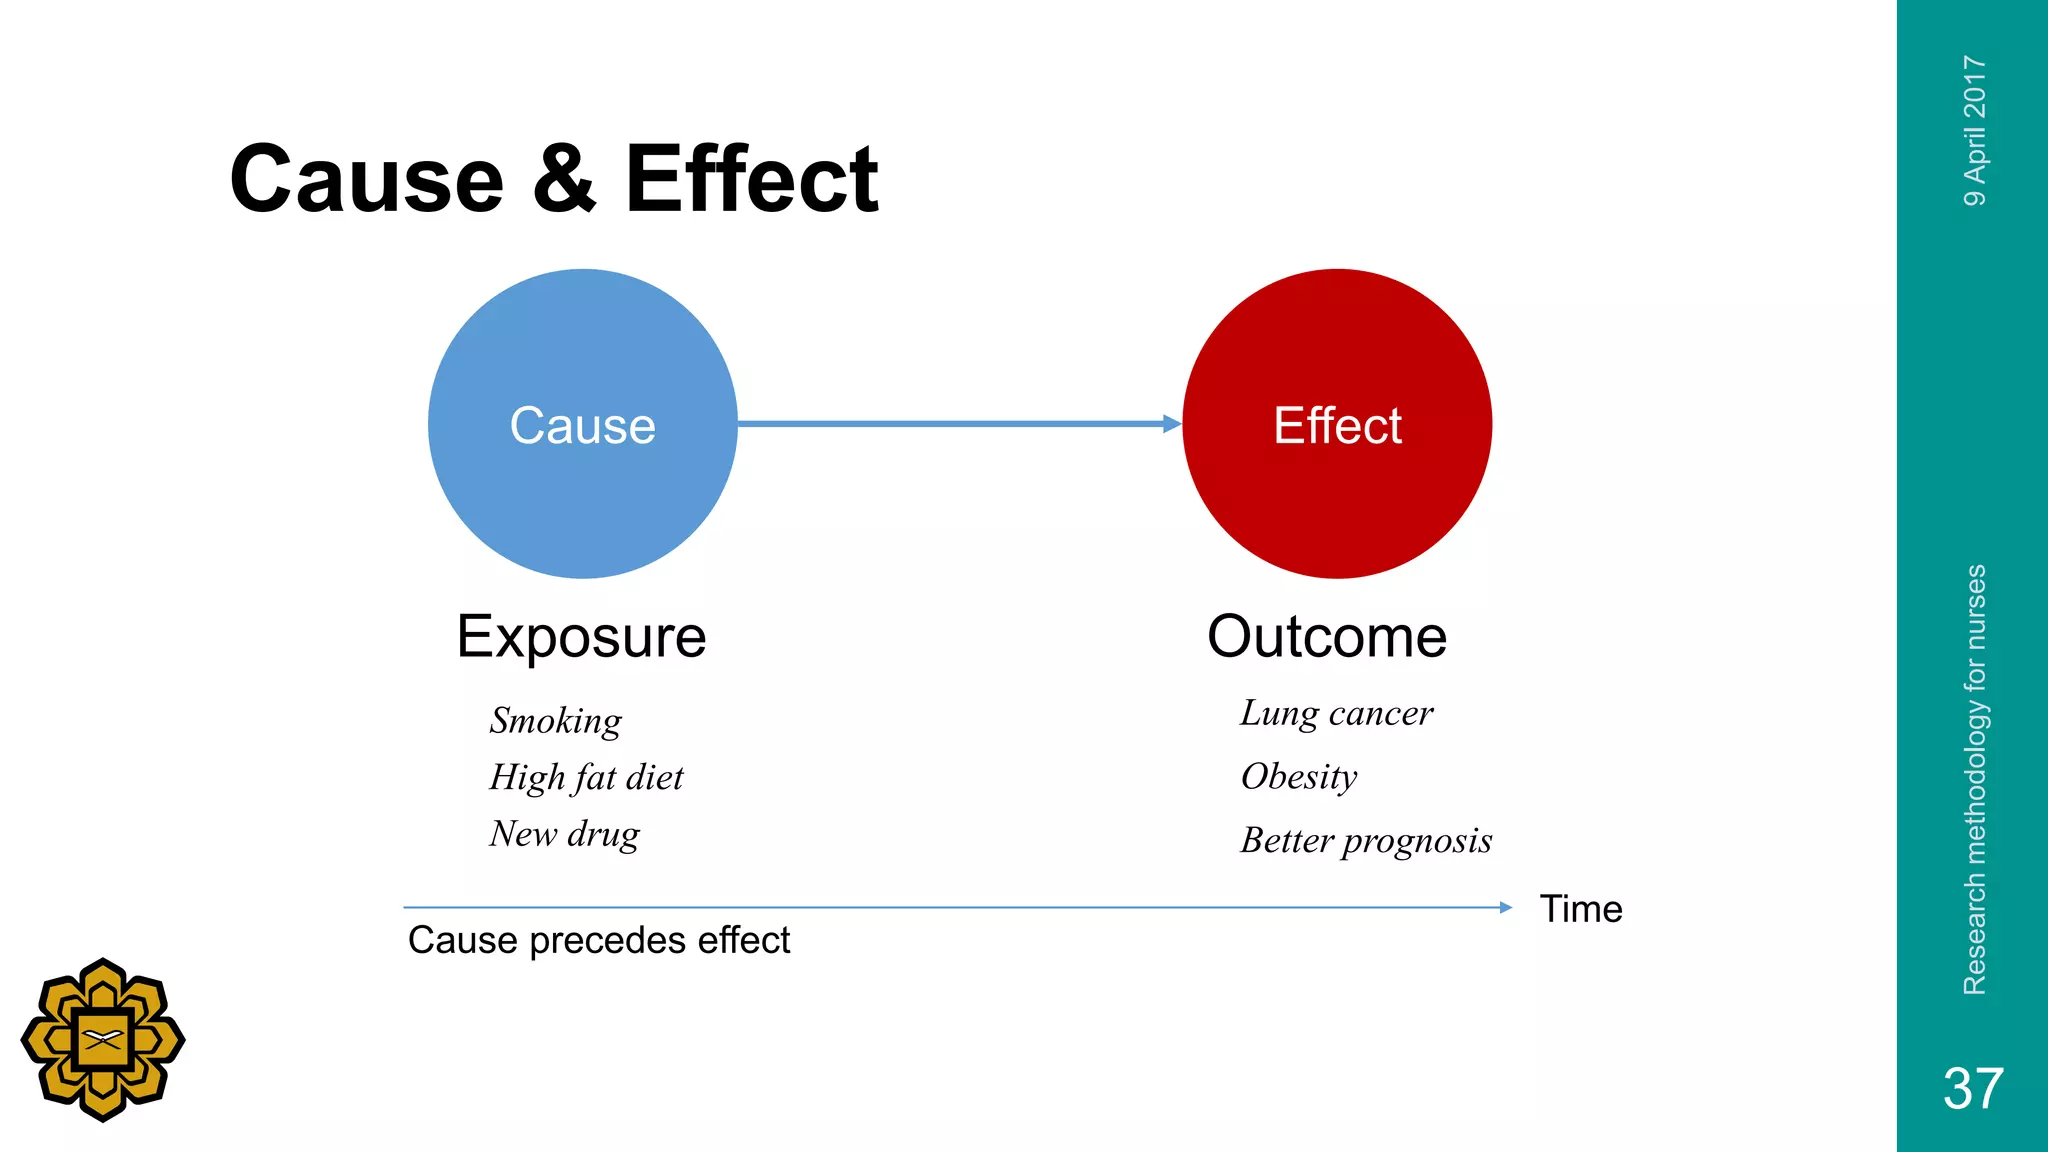
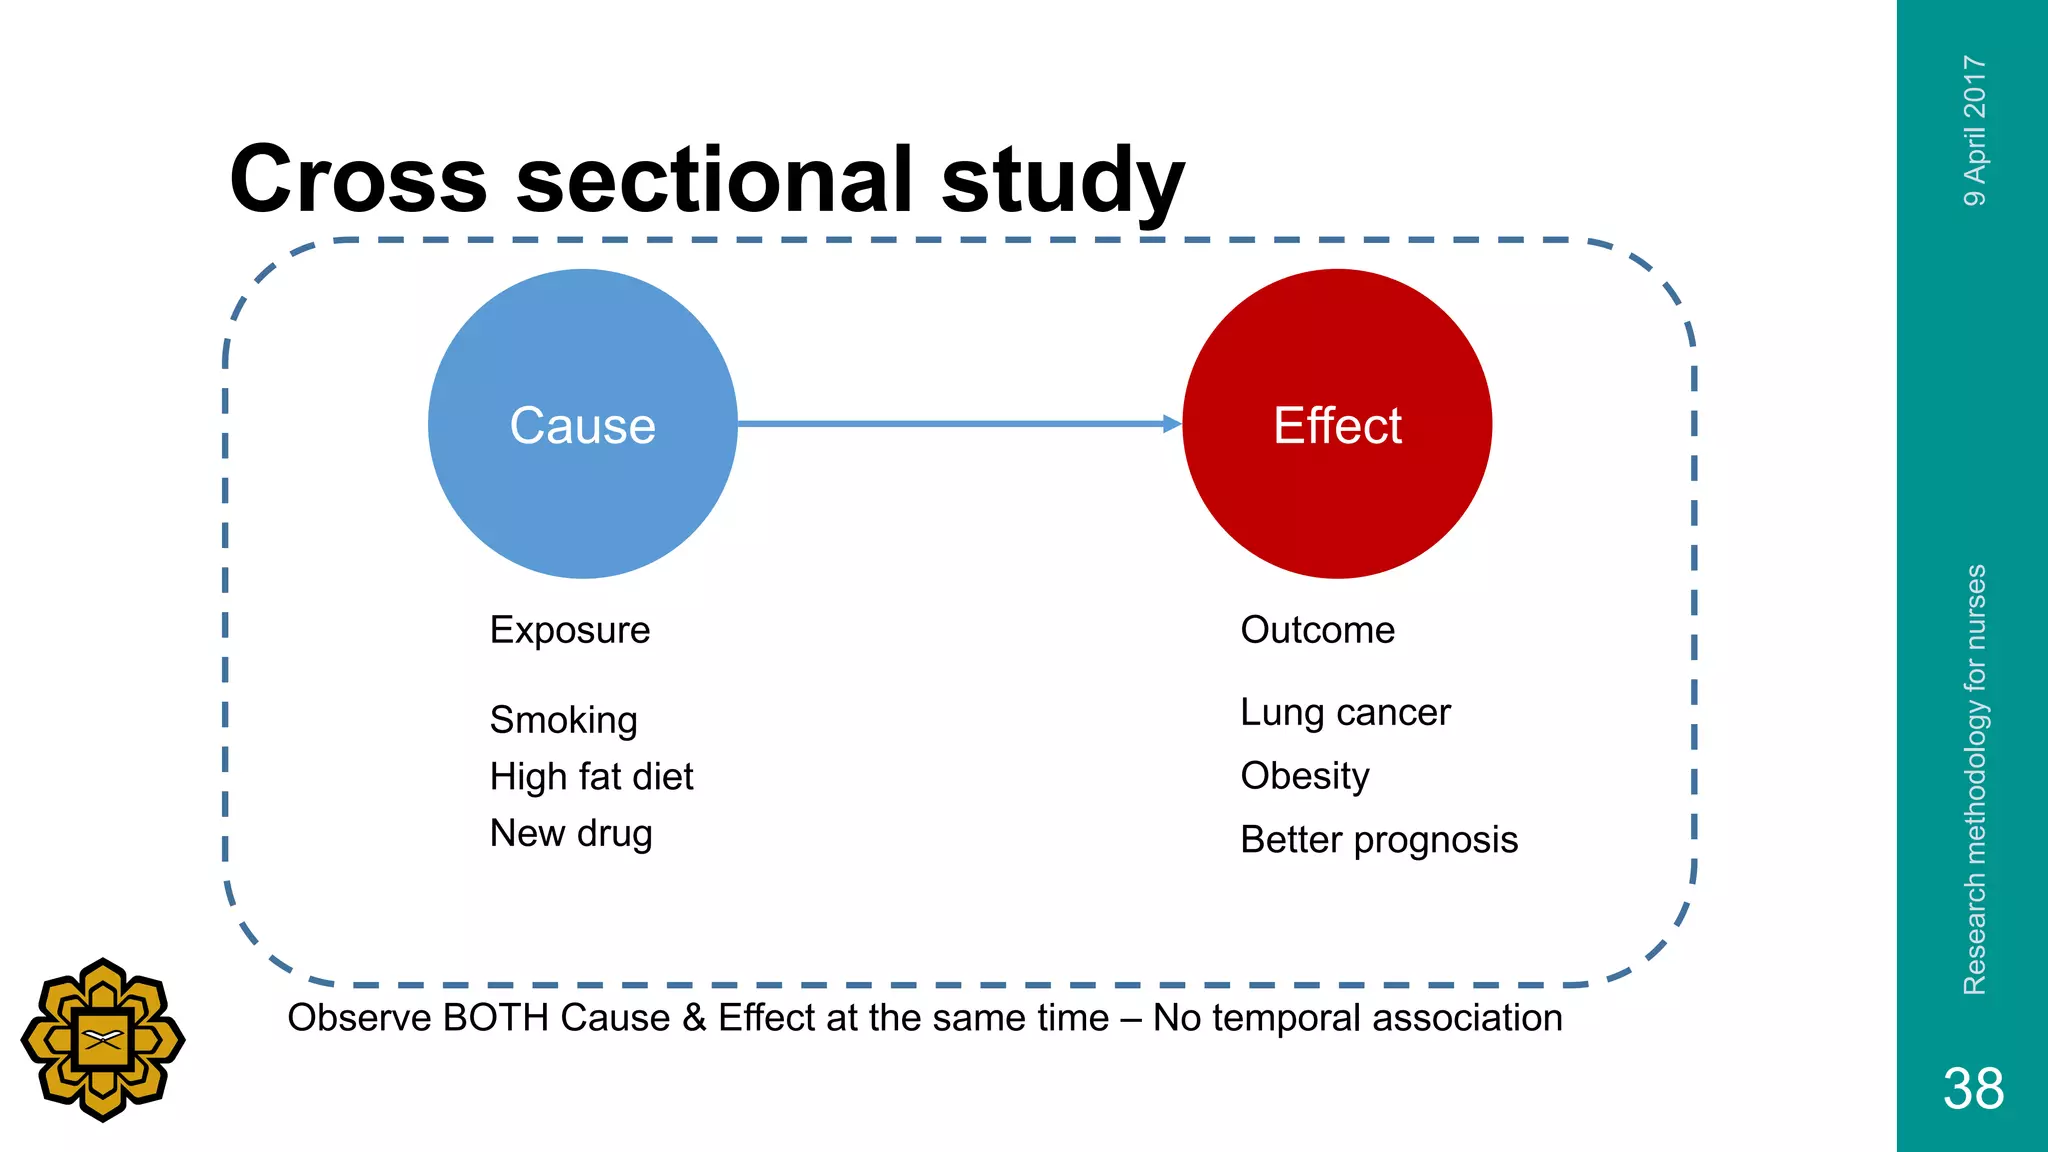
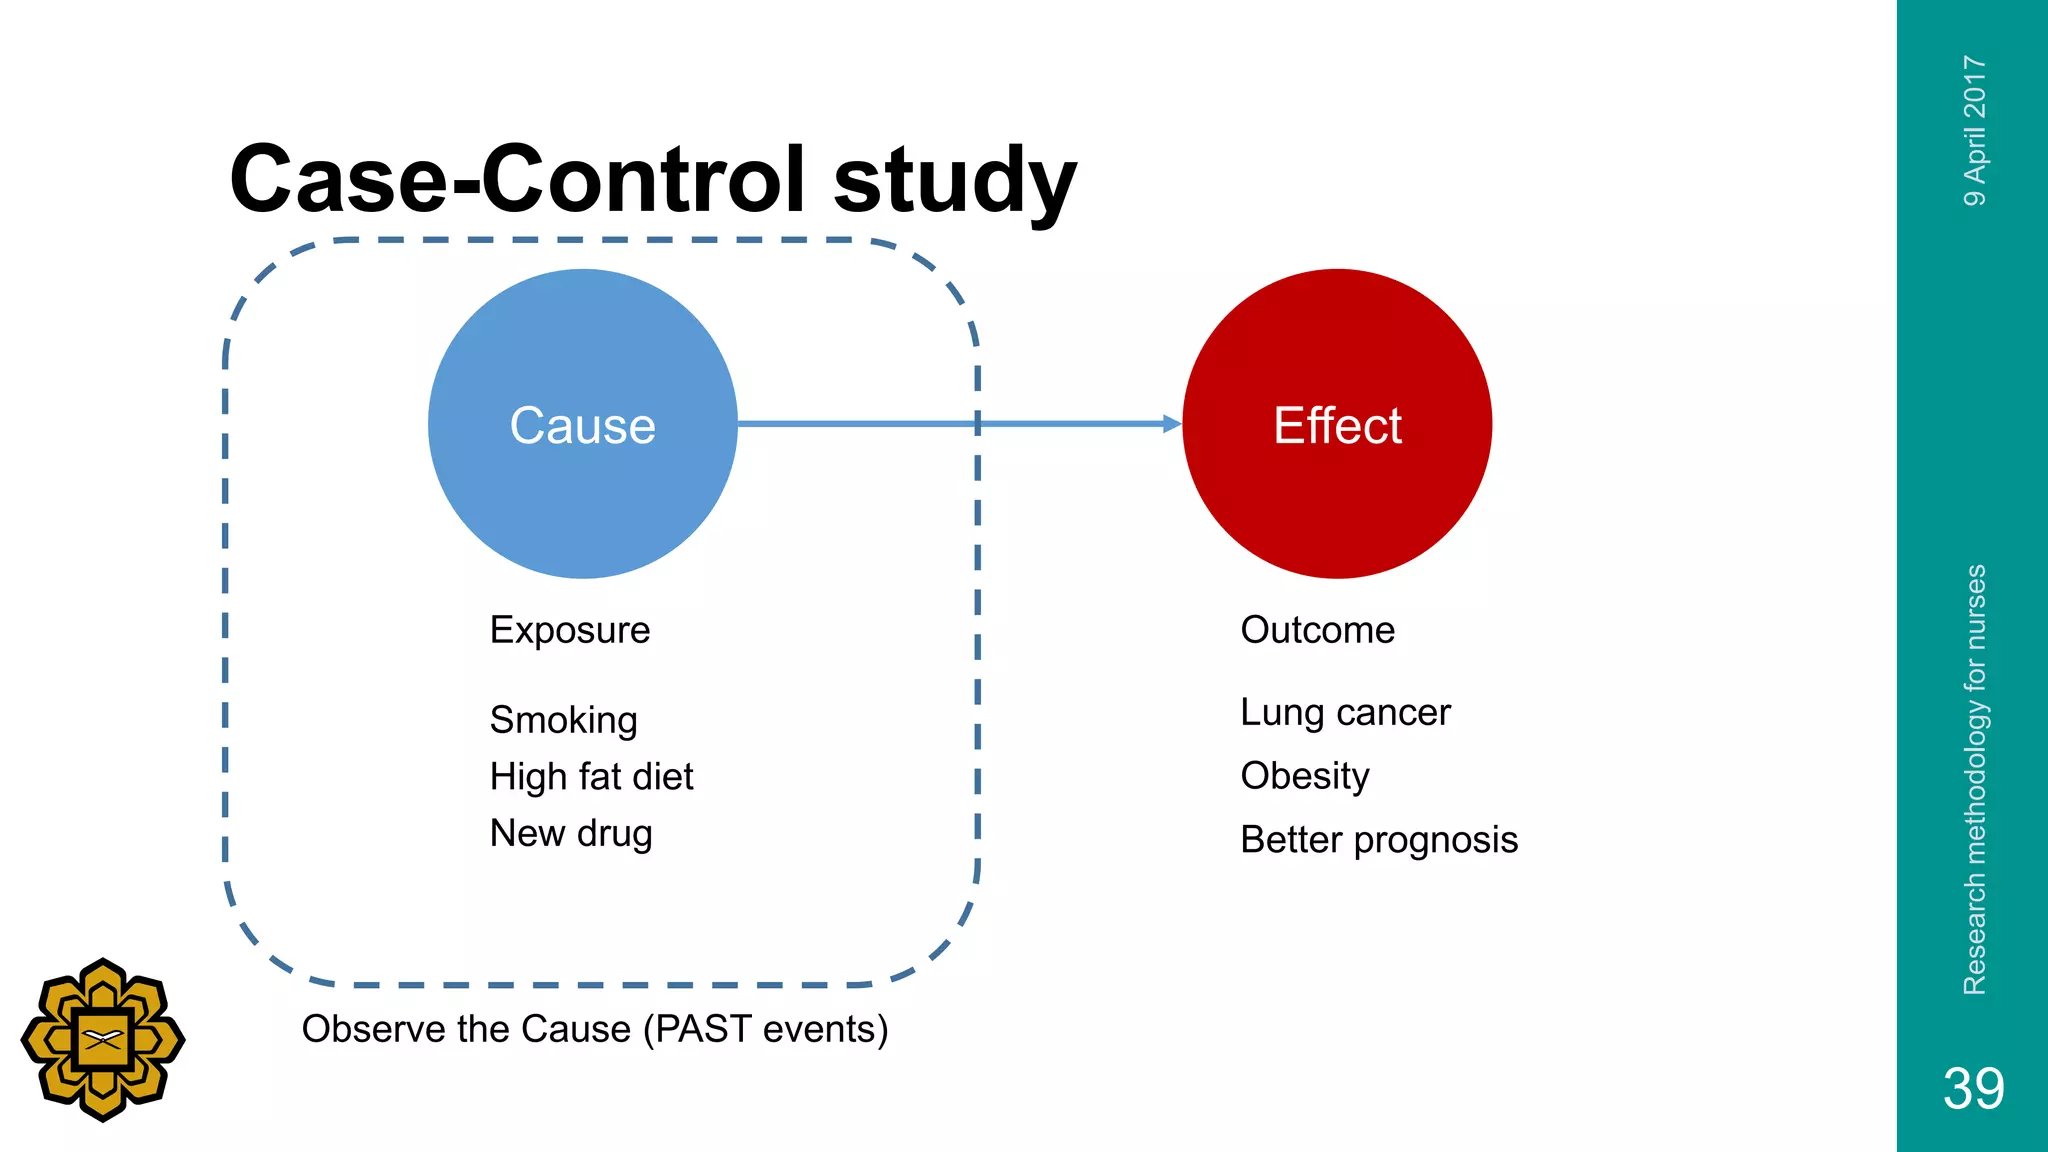

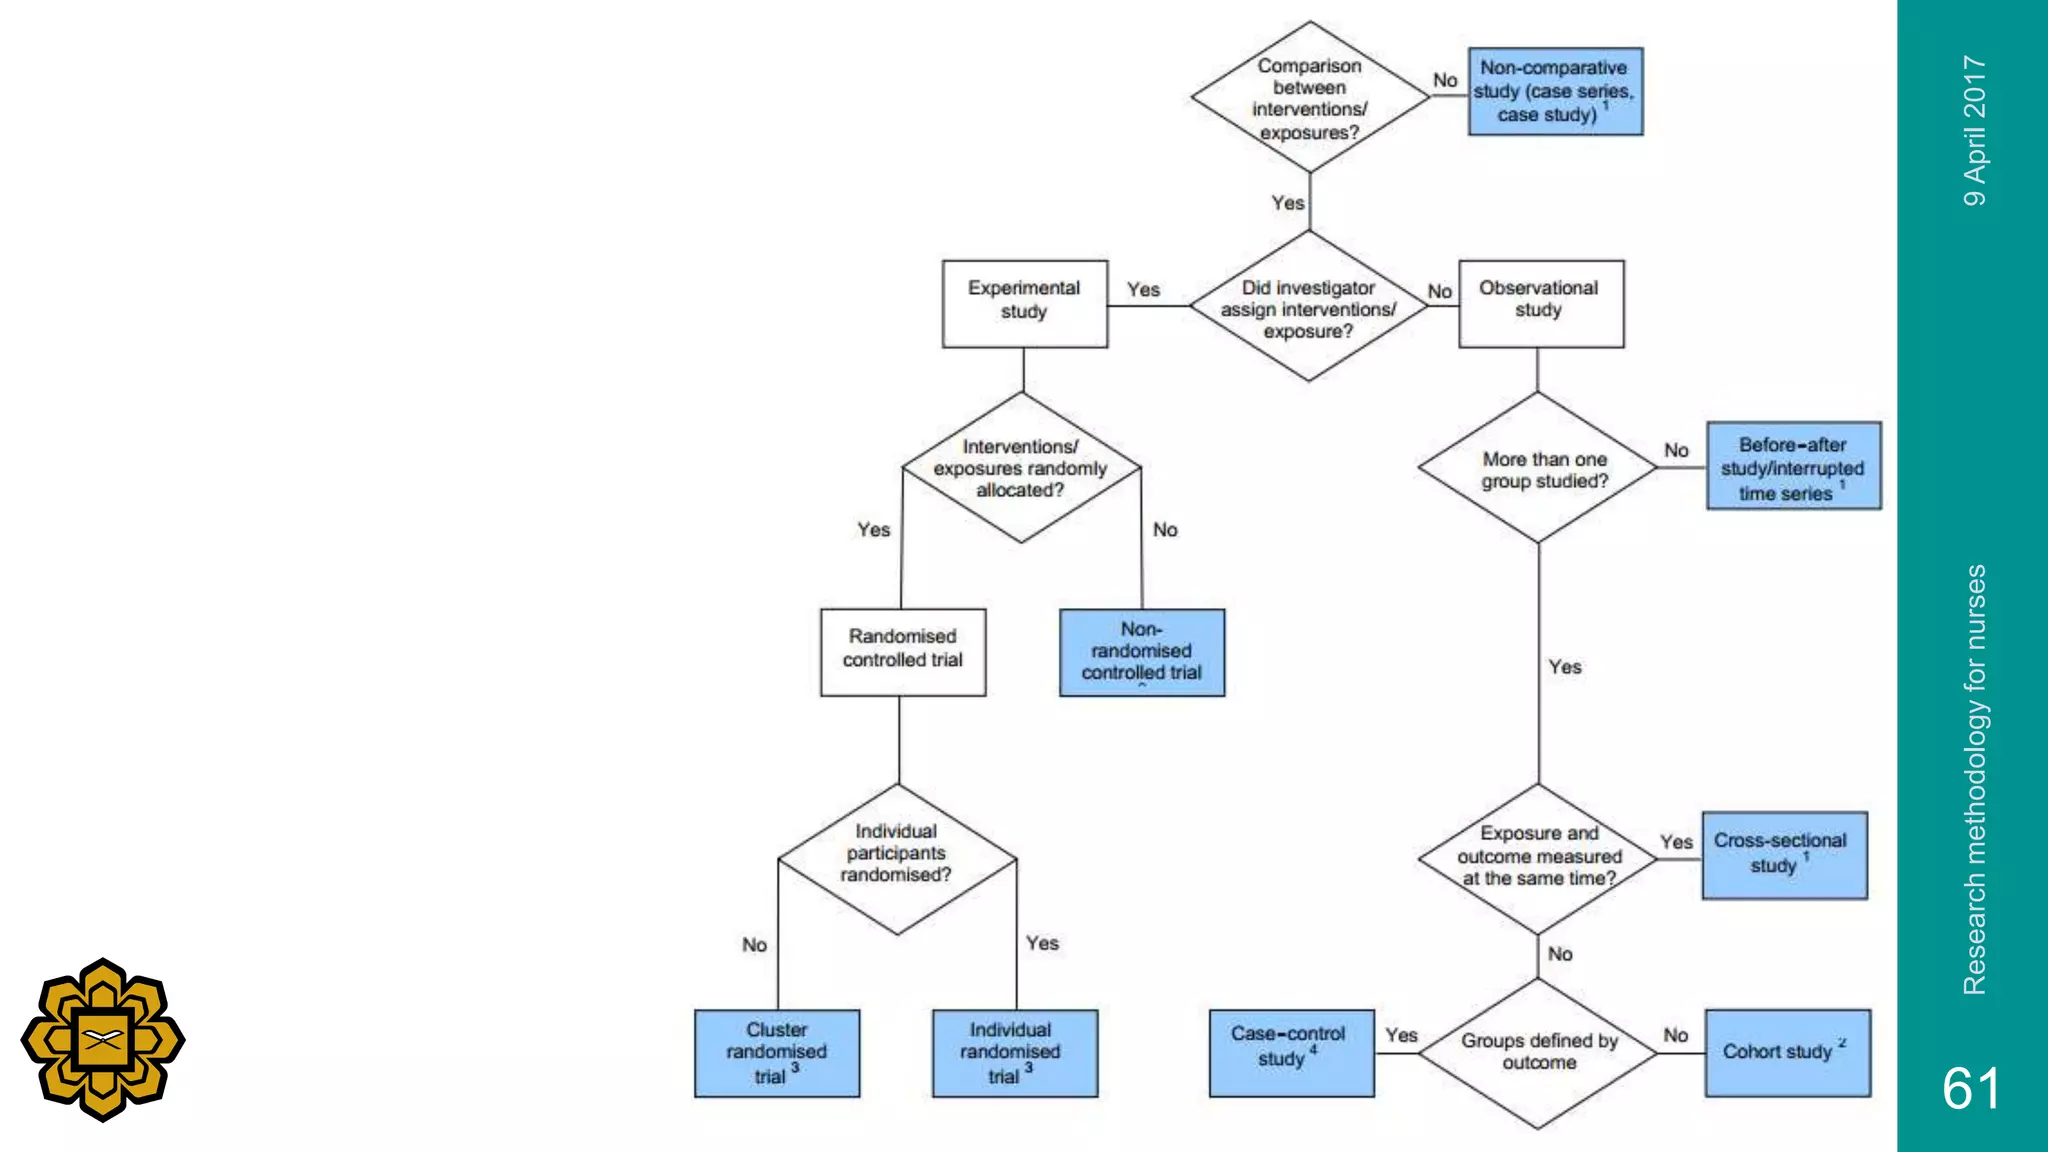
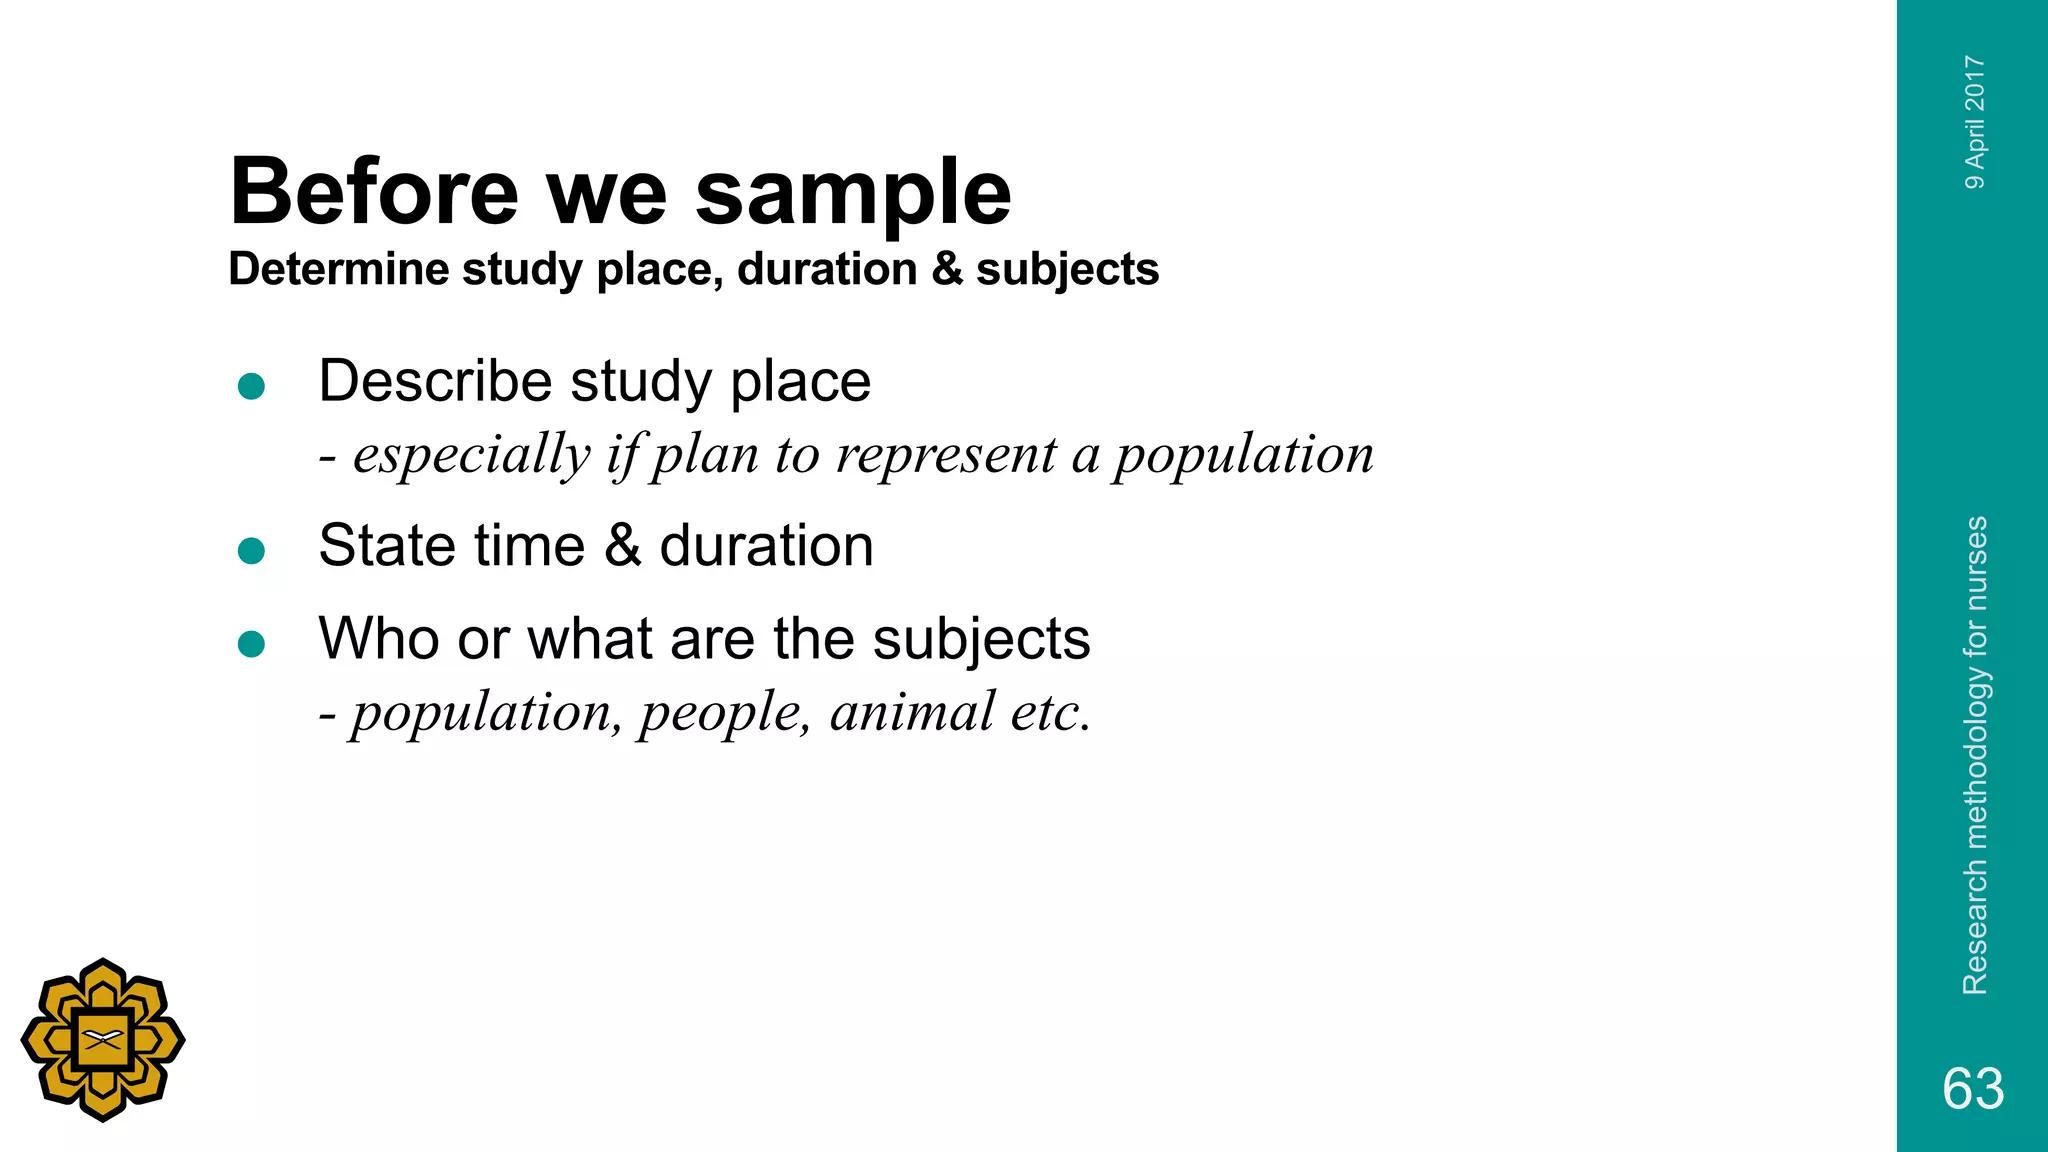
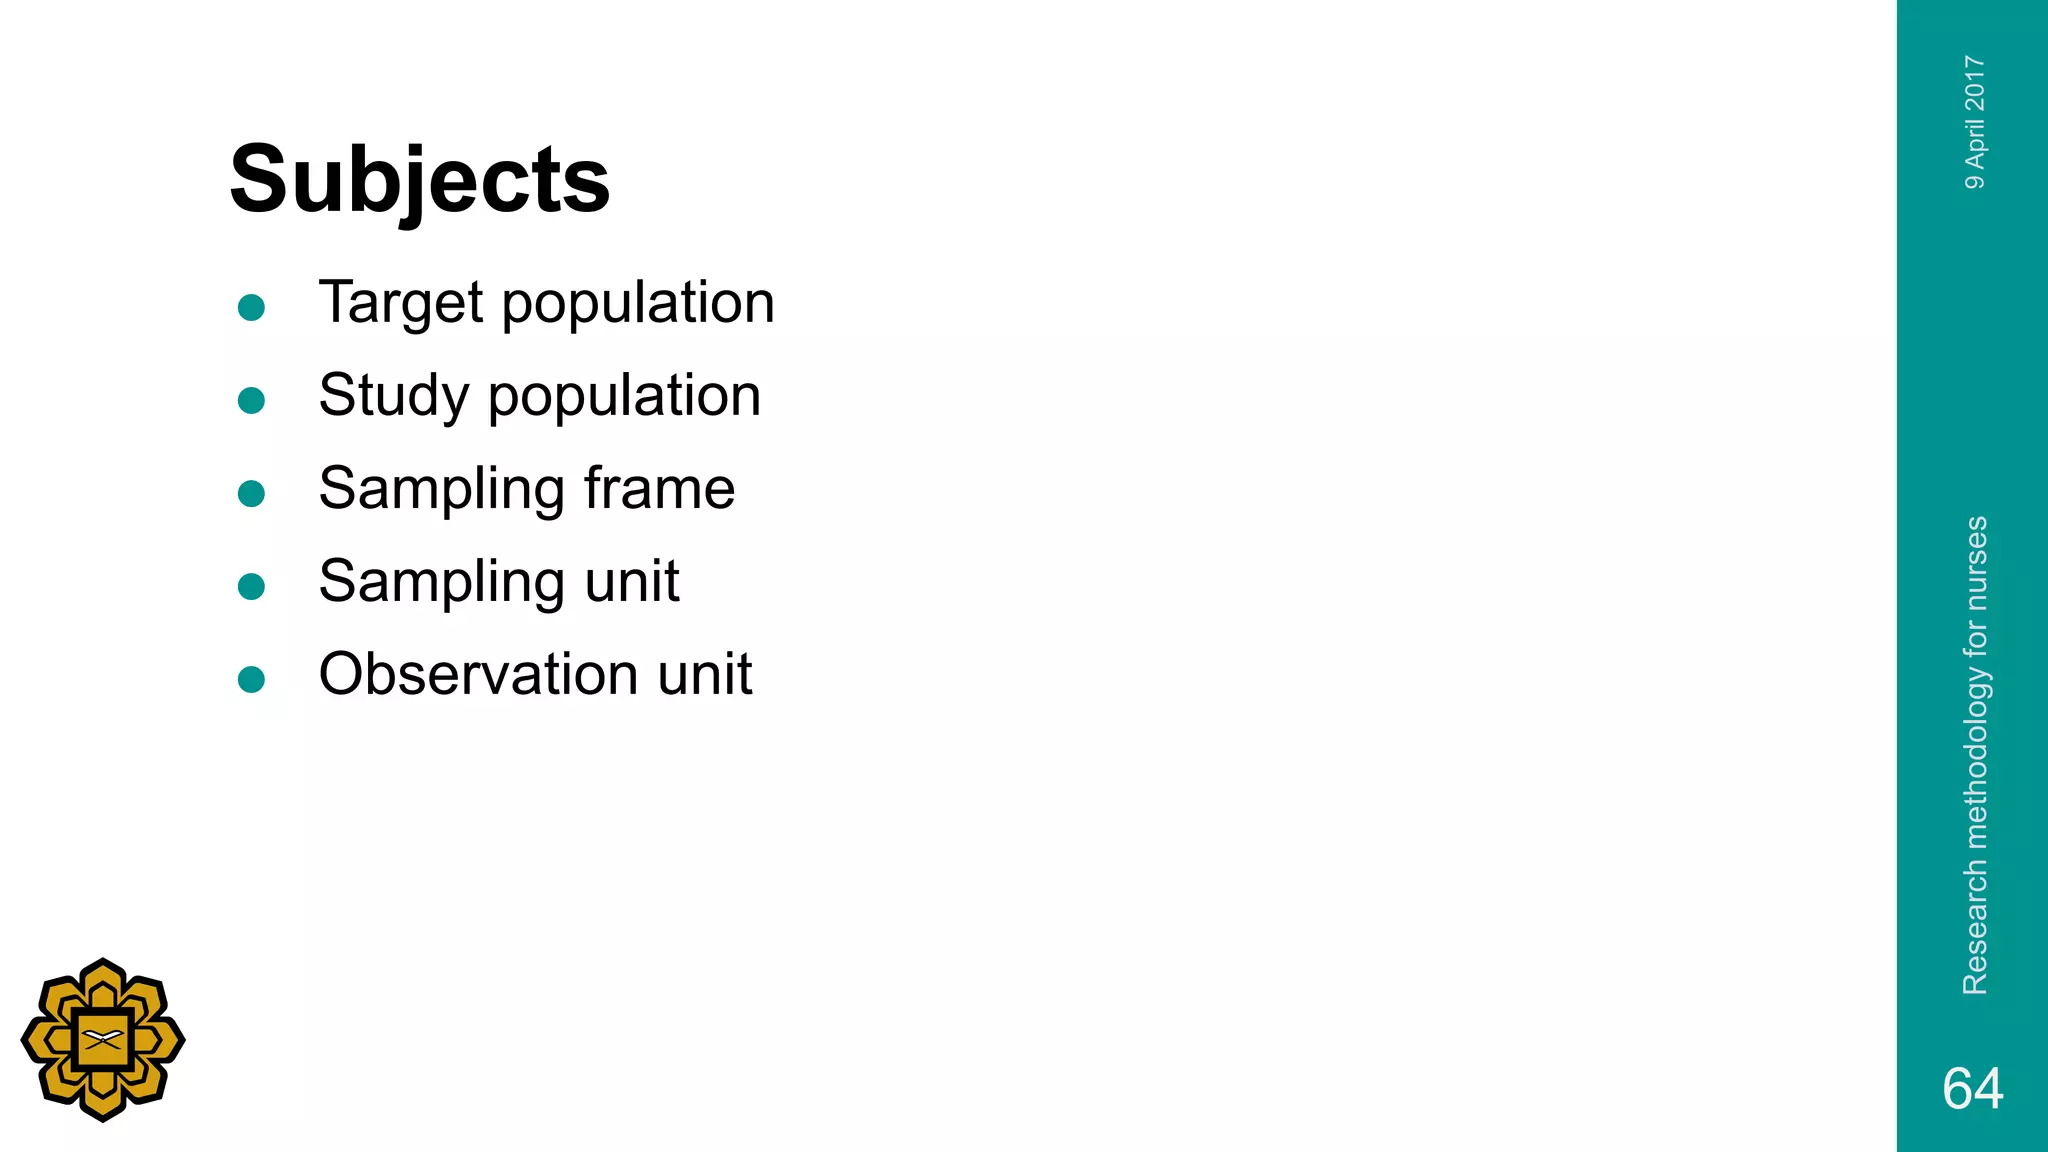


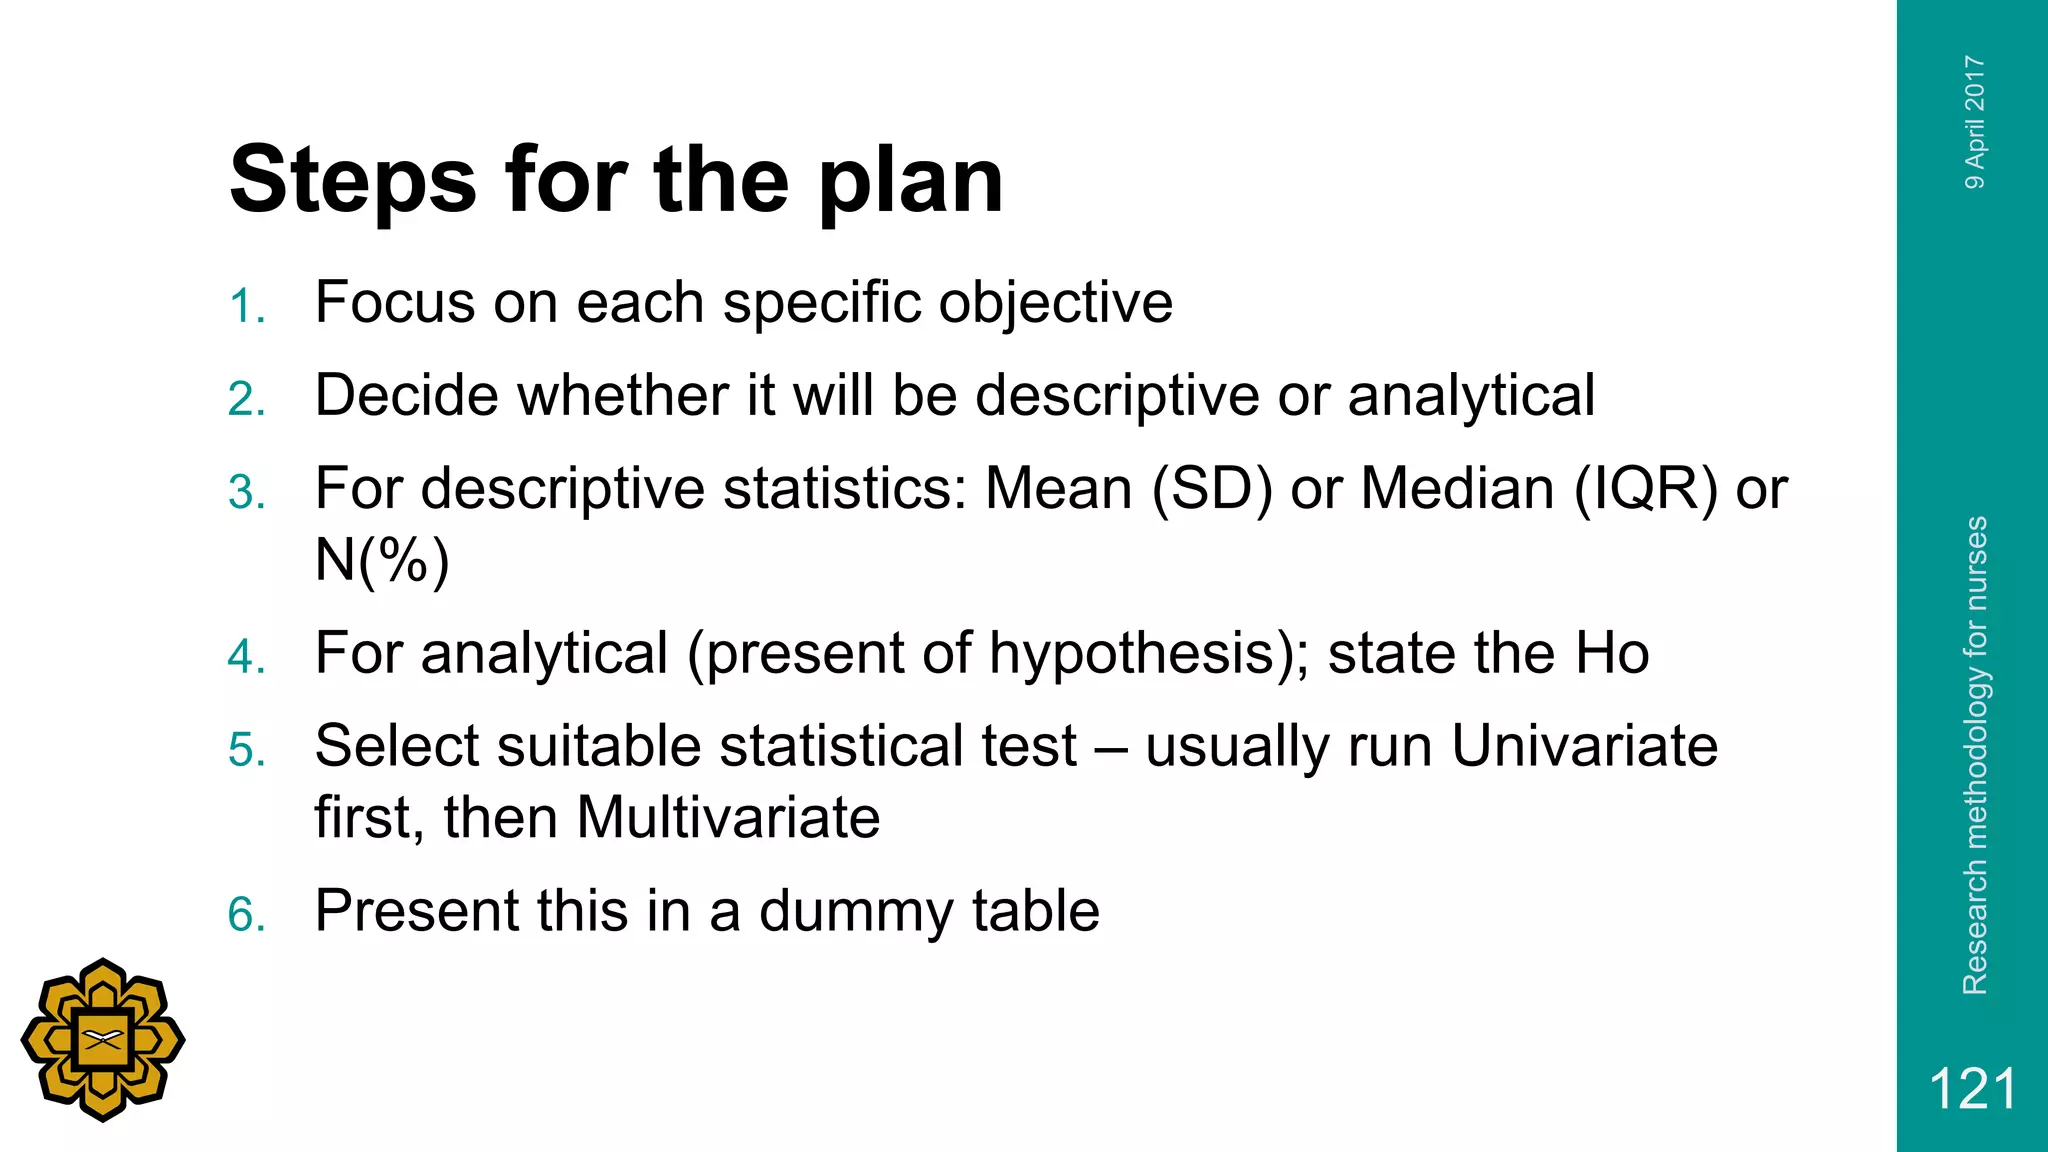
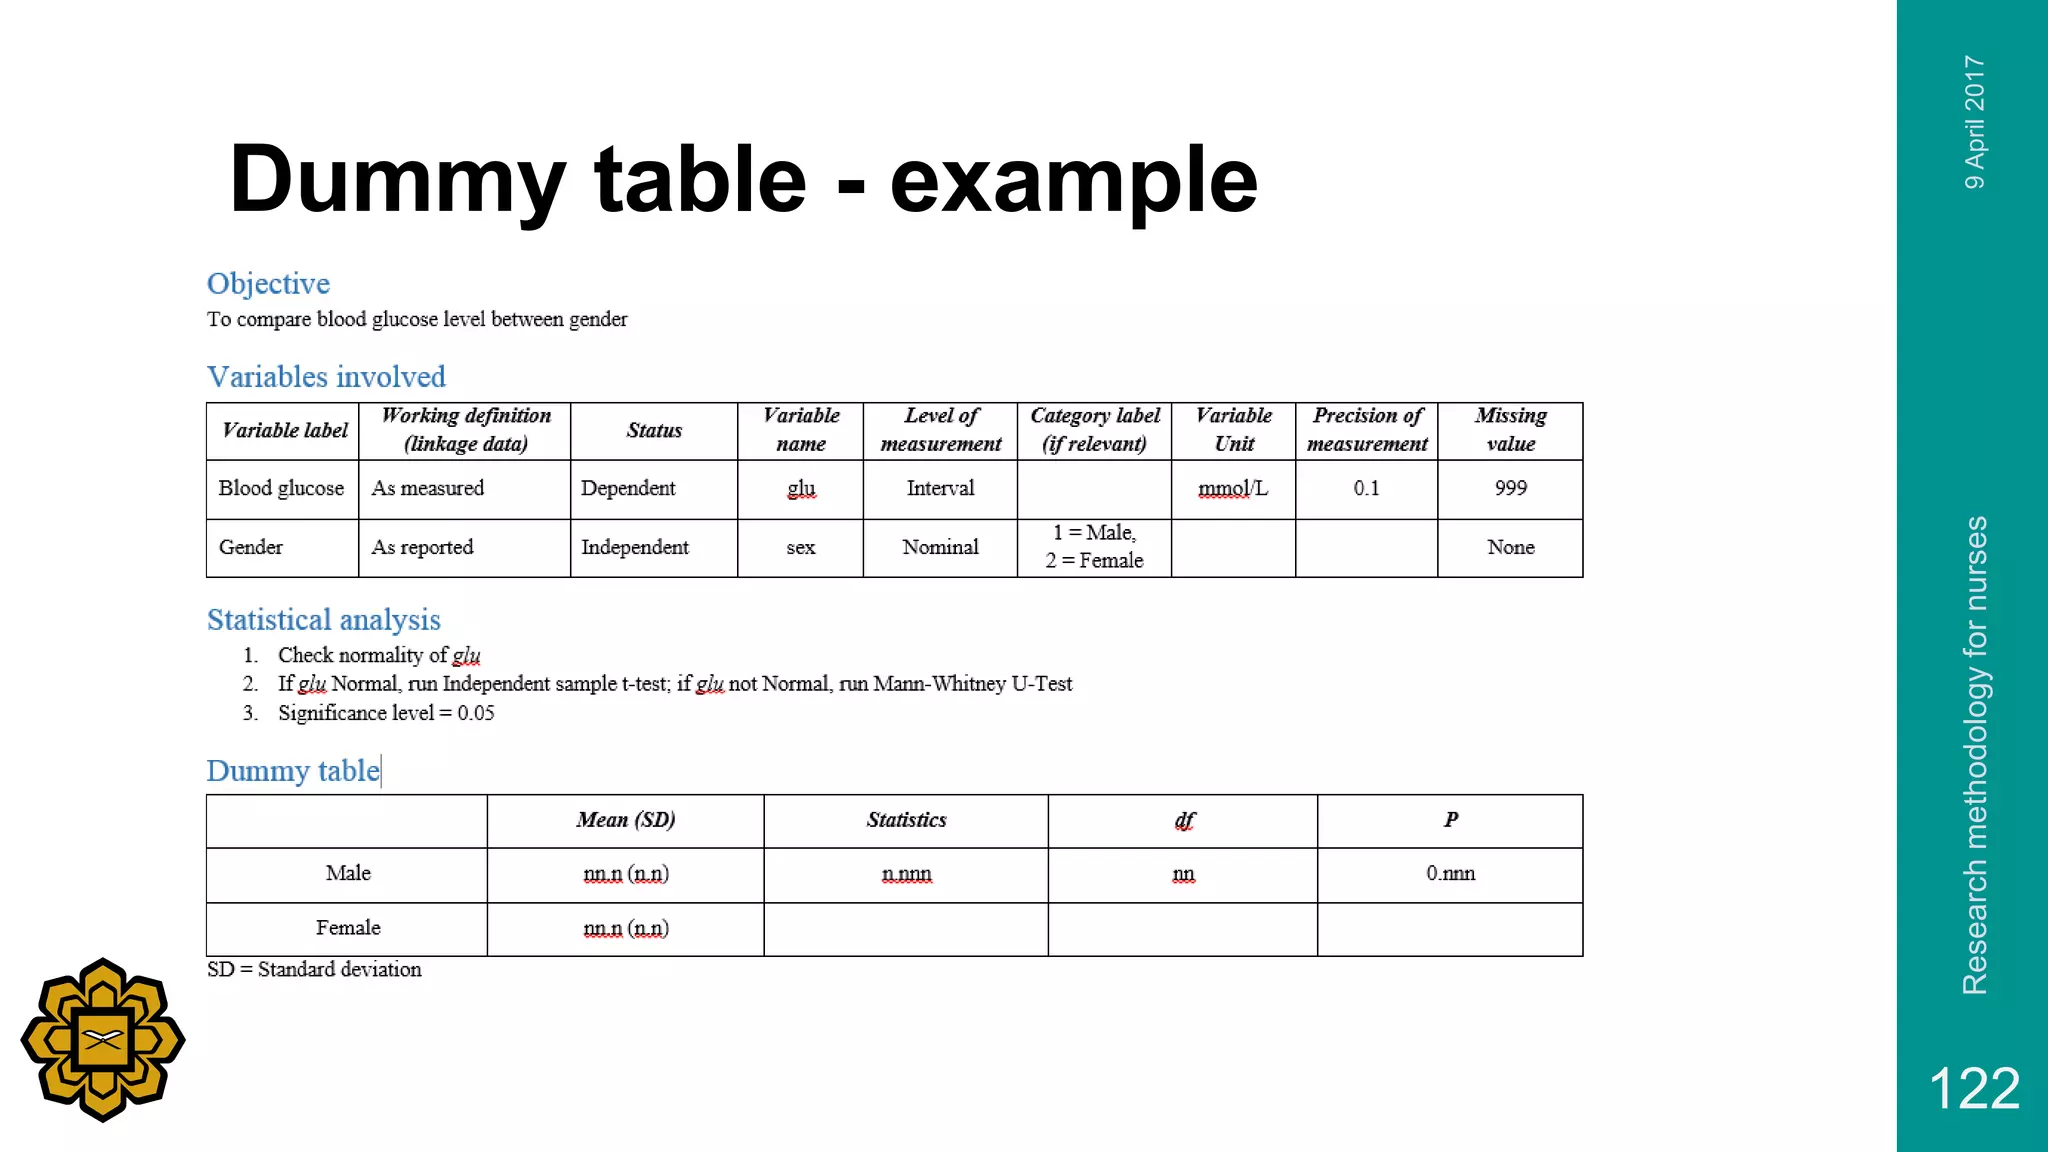


This document outlines a two-day training program on research methodology. Day 1 covers getting research ideas, conducting a literature review using EndNote, building a conceptual framework, writing objectives, determining study designs, and developing sampling plans and data collection tools. Day 2 focuses on statistical analysis plans, including preparing dummy tables and covering descriptive and analytical statistics. The document provides details on the contents to be covered, including effective literature searches, choosing appropriate study designs, planning for data collection and analysis, and writing for publication.