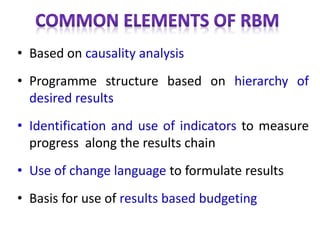
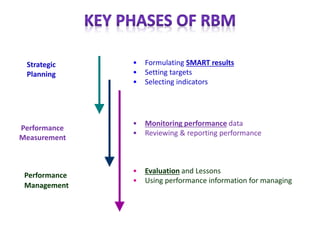
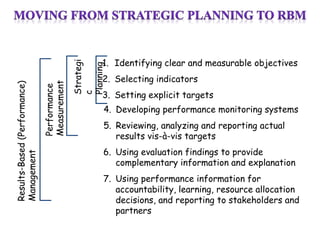
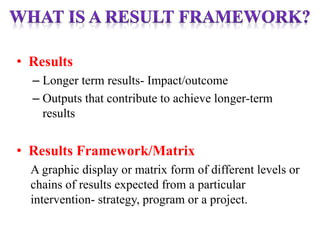
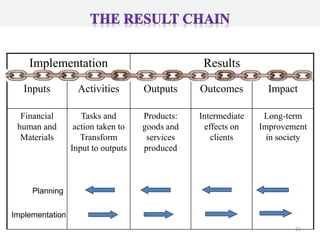
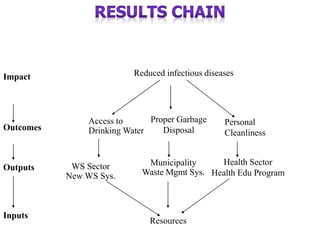
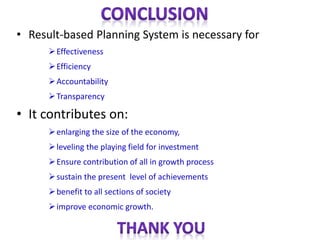
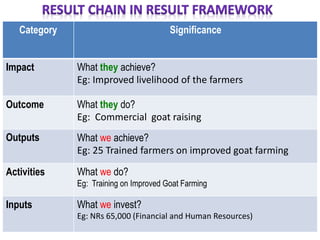
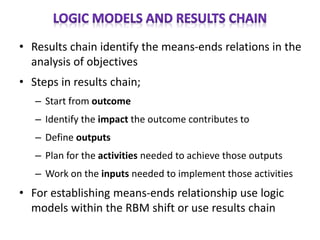
• Why result?
• What is result based planning (RBP)
• RBP Why and How?
• Elements of RBP
• Basic tools in RBP
• RBP Process
• Result Based Management (RBM)
• Common elements of RBM
• Key process of RBM
• What is Result Framework (RF)
• Why RF
• Steps to design a RF
• Result Chain
• Format for RF
• Realization to introduce participation, transparency
and accountability into government work.
• Increasing demand for the delivery of sustainable and
more equitable development.
• Positive changes of New Public Management
movement on some countries in 1980s through greater
accountability in the public sector
• Greater realization for optimum use of limited
resources for achieving greater value for money and
international goals
• Realization among the donors for development
effectiveness
• Result-based planning uses public’s needs and desired
results as the foundation for planning
 Result based planning focuses on the key
questions:
 “How has the planning made a difference?”
 “How are the lives of the general public
better as a result of planning?”
• Focuses more on the results in terms of outcome and impact
of the plan.
• Tries to ensures whether the outcome and impact of the plan
is as per the set medium term goals and long term vision.
• It gives importance to strategy as to how it could be realized
by looking at different options it has and develop policies and
programs to realize the goals and targets.
• It is thus more a strategic planning as against the normal
medium term planning that started from the Communist
Regime in Russia focusing more the material balance.
• It focuses on a medium term goal derived from a clear
vision of the future,
• It proposes a combination of objectives that have been
prioritized by rigorous analysis of the political, social and
economic environment.
• The long-term vision however should be based on a well
documented assessment of the country’s socioeconomic
status and include goals to be achieved in each of the
strategic areas.
• It also needs to respond to the question “How do we want
to get there?”
• Changes focus from HOW to get it done to WHY we do it
• To drive the planning process from people’s need
• Makes us accountable to our client and stakeholders
• Help to demonstrate results:
1. Better implementation
2. Better communication
3. Stronger capacity development
4. More realistic project schedules
5. Useful evaluation results
6. Reducing opportunities and pressures for corruption
• Understand where we are ? – Analysis of the socio-economic status ,
poverty and inequality and the strength and weaknesses of the economy
and the country’s development effort. Finding gaps and strength.
• Clear vision as to what we want to achieve or where we want to reach over
a medium to long term? – Setting up of long term vision and objectives and
targets for the medium term.
• Clear understanding of the path as to how we achieve vision and objectives
? - Choosing options for better strategy to attain the objective/goals and
designing policies and programs to ensure its outcome/output and impact
relating to medium term objectives and long term vision.
• Clear understanding of the resources - both human and capital and
institutional setup to achieve set targets? Analysis of resource potential
and availability, both domestic and foreign, in financing policies and
programs and assessing institutional set ups to carry out plan
implementation.
• Ensure whether we have accomplished the set targets . Designing
monitoring and evaluation system to check implementation process , output
and the quality of work done as envisaged.
• Planning consistency is given top most priority in RBP.
Most often a macro planning model is used for
checking the consistency and analysis.
• Expenditure framework that make consistency in
resource potential and availability in the likely future
situation is also used for the purpose.
• Result Framework is widely used to check the
consistency in the outcome/impact, output and inputs.
• Result based monitoring framework is used for
monitoring and evaluation of the plan and provide feed
back.
Results-based planning process
Plan for results
• Results defined
• Indicators,
targets
Budget for results
• Budget aligned
with activities
Implement for
results
Monitor results
• Linked to planning
• How & who
• Data, reporting
Evaluate results
• How & who
• Dissemination,
feedback
Goals
• A result is a desirable change resulting from a
cause-effect relationship (output, outcome and
impact)
• RBM includes
 Defining realistic expected results with proper analysis
 Identifying beneficiaries & design programmes meet
their needs
 Monitoring progress for results using result indicators
 Reporting on results achieved and resources involved
 Identifying and managing risks
 Lessons learning and informed decision making
• Based on causality analysis
• Programme structure based on hierarchy of
desired results
• Identification and use of indicators to measure
progress along the results chain
• Use of change language to formulate results
• Basis for use of results based budgeting
• Formulating SMART results
• Setting targets
• Selecting indicators
Performance
Measurement
Strategic
Planning
Performance
Management
• Evaluation and Lessons
• Using performance information for managing
• Monitoring performance data
• Reviewing & reporting performance
Strategi
c
Planning
1. Identifying clear and measurable objectives
2. Selecting indicators
3. Setting explicit targets
Performance
Measurement
4. Developing performance monitoring systems
5. Reviewing, analyzing and reporting actual
results vis-à-vis targets
Results-Based(Performance)
Management
6. Using evaluation findings to provide
complementary information and explanation
7. Using performance information for
accountability, learning, resource allocation
decisions, and reporting to stakeholders and
partners
• Results
– Longer term results- Impact/outcome
– Outputs that contribute to achieve longer-term
results
• Results Framework/Matrix
A graphic display or matrix form of different levels or
chains of results expected from a particular
intervention- strategy, program or a project.
It helps in management and M&E in the following
ways:
• Helps focus on specific outcomes
• Highlights the key linkages and causalities that
underpins the intervention
• Helps establish an evidence-based approach in
M&E
• Helps measure progress towards strategic objectives
• Helps achieve strategic objectives
Inputs
Decreasing management control
Output Outcome Impact
Low risk
Moderate risk
High risk
Assumptions
Assumptions
Assumptions
• Identify problems and specify the theory of change to
address them
• Set goals/objectives address them
• Define results (impact/outcomes/outputs)
• Identify critical risks and assumptions
• Specify indicators and data sources
• Design a M&E plan
Category Significance
Impact What they achieve?
Eg: Improved livelihood of the farmers
Outcome What they do?
Eg: Commercial goat raising
Outputs What we achieve?
Eg: 25 Trained farmers on improved goat farming
Activities What we do?
Eg: Training on Improved Goat Farming
Inputs What we invest?
Eg: NRs 65,000 (Financial and Human Resources)
Inputs Activities
The adm./mgmt.
product of agency, its
programmes or projects
Developmental results
Output Outcome Impact
An actual change in the
state of human devt. that is
the logical consequence of
investment in devt
Operational results
21
Implementation Results
Inputs Activities Outputs Outcomes Impact
Financial
human and
Materials
Tasks and
action taken to
Transform
Input to outputs
Products:
goods and
services
produced
Intermediate
effects on
clients
Long-term
Improvement
in society
Planning
Implementation
• Results chain identify the means-ends relations in the
analysis of objectives
• Steps in results chain;
– Start from outcome
– Identify the impact the outcome contributes to
– Define outputs
– Plan for the activities needed to achieve those outputs
– Work on the inputs needed to implement those activities
• For establishing means-ends relationship use logic
models within the RBM shift or use results chain
Inputs
Outputs
Outcomes
Impact
Resources
WS Sector
New WS Sys.
Municipality
Waste Mgmt Sys.
Access to
Drinking Water
Reduced infectious diseases
Proper Garbage
Disposal
Personal
Cleanliness
Health Sector
Health Edu Program
Inputs
Outputs
Outcomes
Impact
Resources
Trained Farmers
on Goat Raising
Commercial
Goat Raising
Increase in Farm Productivity
Access to
Improved Breeds
Adoption of GHP
Trained Farmers on
GHP
Community
breeding centers
established
Inputs
Outputs
Outcomes
Impact
Resources
Improved
Productivity
Access to Food
Improved Livelihood of Farmers
Competitive
Agribusiness
Improved International
Ag. Trade
Laboratory
Upgrading
Farm
Mechanization
• Result-based Planning System is necessary for
Effectiveness
Efficiency
Accountability
Transparency
• It contributes on:
enlarging the size of the economy,
leveling the playing field for investment
Ensure contribution of all in growth process
sustain the present level of achievements
benefit to all sections of society
improve economic growth.
Category Significance
Impact What they achieve?
Eg: Improved livelihood of the farmers
Outcome What they do?
Eg: Commercial goat raising
Outputs What we achieve?
Eg: 25 Trained farmers on improved goat farming
Activities What we do?
Eg: Training on Improved Goat Farming
Inputs What we invest?
Eg: NRs 65,000 (Financial and Human Resources)
• Results chain identify the means-ends relations in the
analysis of objectives
• Steps in results chain;
– Start from outcome
– Identify the impact the outcome contributes to
– Define outputs
– Plan for the activities needed to achieve those outputs
– Work on the inputs needed to implement those activities
• For establishing means-ends relationship use logic
models within the RBM shift or use results chain
Inputs
Outputs
Outcomes
Impact
Resources
Trained Farmers
on Goat Raising
Commercial
Goat Raising
Increase in Farm Productivity
Access to
Improved Breeds
Adoption of GHP
Trained Farmers on
GHP
Community
breeding centers
established
Format of Results Framework
Results
Indicators and MOV
Responsible Assumpti
on/Risk
Indicators Baseline Target MOV
Yr 1 Yr 2 Yr 3
Impact
Outcome 1 -
Output 1.1
Output 1.2
Outcome 2-
Output 2.1
Output 2.2
Outcome 3-
Output 3.1
Output 3.2
Outcome 4-
Output 4.1
Output 4.2
Programs/ sub-programs Bud
get
Bud
get
Bud
get
Results Framework
Results Indicators Base
line
Targets MOV Res Assump./
Risks
70/71 71/72 72/73
Impact
Improved
livelihood of the
farmers and agri
entrepreneurs
Rural
poverty (%)
Outcome 1:
Access to the
food and
nutrition
increased
Output -1.1
Production and
Productivity
enhanced
• Per capita
meat
Availability
(kg/person/ye
ar)
• Annual meat
Production
(000 mt)
Surveys,
Census
and
Annual
reports
MoAD Policy
priorities in
agriculture
Results Framework
Results Indicators Baseli
ne
Targets MOV Res
p
Assump./
Risks
70/71 71/72 72/73
Outcome - 2
Agricultural
Production System
commercialized
Output -2.1
Marketing system
developed
• Annual Market
Transaction
(00,000Rs)
• Number of
livestock
collection center
Progress
reports
Mo
AD
Policy
priorities in
agriculture
Major Programs/ Projects
Capacity/ Status
• Livestock Extension Program
(Output 1.1)
• Livestock market promotion
program (Output 2.1)
Budget
Budget
Budget
Budget
Budget
Budget
Budget
Budget
Budget
Budget
Budget
Budget
TOR
• Result Based Matrix preparation
- Outline of results – impact (s), Outcomes,
output, programs/projects
-Define indicators
• Group presentation
Groups
1. District Livestock Development Plan
2. Sectoral plan – Poultry
3. Sectoral plan - Dairy
Impact :
Indicator -
Outcome 1:
Indicator :
Output 1.1 :
Indicator :
Outcome 2 :
Indicator :
Output 2.1 :
Indicator :
Program/projects (output …)
Impact:
Outcomes
1.
2.
3.
Outcome 1:
Output 1.1:
Programs/projects
1.
2.
Output 1.2:
Programs/projects
1.
2.
Outcome 2:
Output 2.1:
Programs/projects
1.
2.
Output 2.2:
Programs/projects
1.
2.

Result based management

  • 2.
    • Why result? •What is result based planning (RBP) • RBP Why and How? • Elements of RBP • Basic tools in RBP • RBP Process • Result Based Management (RBM) • Common elements of RBM • Key process of RBM • What is Result Framework (RF) • Why RF • Steps to design a RF • Result Chain • Format for RF
  • 3.
    • Realization tointroduce participation, transparency and accountability into government work. • Increasing demand for the delivery of sustainable and more equitable development. • Positive changes of New Public Management movement on some countries in 1980s through greater accountability in the public sector • Greater realization for optimum use of limited resources for achieving greater value for money and international goals • Realization among the donors for development effectiveness
  • 4.
    • Result-based planninguses public’s needs and desired results as the foundation for planning  Result based planning focuses on the key questions:  “How has the planning made a difference?”  “How are the lives of the general public better as a result of planning?”
  • 5.
    • Focuses moreon the results in terms of outcome and impact of the plan. • Tries to ensures whether the outcome and impact of the plan is as per the set medium term goals and long term vision. • It gives importance to strategy as to how it could be realized by looking at different options it has and develop policies and programs to realize the goals and targets. • It is thus more a strategic planning as against the normal medium term planning that started from the Communist Regime in Russia focusing more the material balance.
  • 6.
    • It focuseson a medium term goal derived from a clear vision of the future, • It proposes a combination of objectives that have been prioritized by rigorous analysis of the political, social and economic environment. • The long-term vision however should be based on a well documented assessment of the country’s socioeconomic status and include goals to be achieved in each of the strategic areas. • It also needs to respond to the question “How do we want to get there?”
  • 7.
    • Changes focusfrom HOW to get it done to WHY we do it • To drive the planning process from people’s need • Makes us accountable to our client and stakeholders • Help to demonstrate results: 1. Better implementation 2. Better communication 3. Stronger capacity development 4. More realistic project schedules 5. Useful evaluation results 6. Reducing opportunities and pressures for corruption
  • 8.
    • Understand wherewe are ? – Analysis of the socio-economic status , poverty and inequality and the strength and weaknesses of the economy and the country’s development effort. Finding gaps and strength. • Clear vision as to what we want to achieve or where we want to reach over a medium to long term? – Setting up of long term vision and objectives and targets for the medium term. • Clear understanding of the path as to how we achieve vision and objectives ? - Choosing options for better strategy to attain the objective/goals and designing policies and programs to ensure its outcome/output and impact relating to medium term objectives and long term vision. • Clear understanding of the resources - both human and capital and institutional setup to achieve set targets? Analysis of resource potential and availability, both domestic and foreign, in financing policies and programs and assessing institutional set ups to carry out plan implementation. • Ensure whether we have accomplished the set targets . Designing monitoring and evaluation system to check implementation process , output and the quality of work done as envisaged.
  • 9.
    • Planning consistencyis given top most priority in RBP. Most often a macro planning model is used for checking the consistency and analysis. • Expenditure framework that make consistency in resource potential and availability in the likely future situation is also used for the purpose. • Result Framework is widely used to check the consistency in the outcome/impact, output and inputs. • Result based monitoring framework is used for monitoring and evaluation of the plan and provide feed back.
  • 10.
    Results-based planning process Planfor results • Results defined • Indicators, targets Budget for results • Budget aligned with activities Implement for results Monitor results • Linked to planning • How & who • Data, reporting Evaluate results • How & who • Dissemination, feedback Goals
  • 11.
    • A resultis a desirable change resulting from a cause-effect relationship (output, outcome and impact) • RBM includes  Defining realistic expected results with proper analysis  Identifying beneficiaries & design programmes meet their needs  Monitoring progress for results using result indicators  Reporting on results achieved and resources involved  Identifying and managing risks  Lessons learning and informed decision making
  • 12.
    • Based oncausality analysis • Programme structure based on hierarchy of desired results • Identification and use of indicators to measure progress along the results chain • Use of change language to formulate results • Basis for use of results based budgeting
  • 13.
    • Formulating SMARTresults • Setting targets • Selecting indicators Performance Measurement Strategic Planning Performance Management • Evaluation and Lessons • Using performance information for managing • Monitoring performance data • Reviewing & reporting performance
  • 14.
    Strategi c Planning 1. Identifying clearand measurable objectives 2. Selecting indicators 3. Setting explicit targets Performance Measurement 4. Developing performance monitoring systems 5. Reviewing, analyzing and reporting actual results vis-à-vis targets Results-Based(Performance) Management 6. Using evaluation findings to provide complementary information and explanation 7. Using performance information for accountability, learning, resource allocation decisions, and reporting to stakeholders and partners
  • 15.
    • Results – Longerterm results- Impact/outcome – Outputs that contribute to achieve longer-term results • Results Framework/Matrix A graphic display or matrix form of different levels or chains of results expected from a particular intervention- strategy, program or a project.
  • 16.
    It helps inmanagement and M&E in the following ways: • Helps focus on specific outcomes • Highlights the key linkages and causalities that underpins the intervention • Helps establish an evidence-based approach in M&E • Helps measure progress towards strategic objectives • Helps achieve strategic objectives
  • 17.
    Inputs Decreasing management control OutputOutcome Impact Low risk Moderate risk High risk Assumptions Assumptions Assumptions
  • 18.
    • Identify problemsand specify the theory of change to address them • Set goals/objectives address them • Define results (impact/outcomes/outputs) • Identify critical risks and assumptions • Specify indicators and data sources • Design a M&E plan
  • 19.
    Category Significance Impact Whatthey achieve? Eg: Improved livelihood of the farmers Outcome What they do? Eg: Commercial goat raising Outputs What we achieve? Eg: 25 Trained farmers on improved goat farming Activities What we do? Eg: Training on Improved Goat Farming Inputs What we invest? Eg: NRs 65,000 (Financial and Human Resources)
  • 20.
    Inputs Activities The adm./mgmt. productof agency, its programmes or projects Developmental results Output Outcome Impact An actual change in the state of human devt. that is the logical consequence of investment in devt Operational results
  • 21.
    21 Implementation Results Inputs ActivitiesOutputs Outcomes Impact Financial human and Materials Tasks and action taken to Transform Input to outputs Products: goods and services produced Intermediate effects on clients Long-term Improvement in society Planning Implementation
  • 22.
    • Results chainidentify the means-ends relations in the analysis of objectives • Steps in results chain; – Start from outcome – Identify the impact the outcome contributes to – Define outputs – Plan for the activities needed to achieve those outputs – Work on the inputs needed to implement those activities • For establishing means-ends relationship use logic models within the RBM shift or use results chain
  • 23.
    Inputs Outputs Outcomes Impact Resources WS Sector New WSSys. Municipality Waste Mgmt Sys. Access to Drinking Water Reduced infectious diseases Proper Garbage Disposal Personal Cleanliness Health Sector Health Edu Program
  • 24.
    Inputs Outputs Outcomes Impact Resources Trained Farmers on GoatRaising Commercial Goat Raising Increase in Farm Productivity Access to Improved Breeds Adoption of GHP Trained Farmers on GHP Community breeding centers established
  • 25.
    Inputs Outputs Outcomes Impact Resources Improved Productivity Access to Food ImprovedLivelihood of Farmers Competitive Agribusiness Improved International Ag. Trade Laboratory Upgrading Farm Mechanization
  • 26.
    • Result-based PlanningSystem is necessary for Effectiveness Efficiency Accountability Transparency • It contributes on: enlarging the size of the economy, leveling the playing field for investment Ensure contribution of all in growth process sustain the present level of achievements benefit to all sections of society improve economic growth.
  • 28.
    Category Significance Impact Whatthey achieve? Eg: Improved livelihood of the farmers Outcome What they do? Eg: Commercial goat raising Outputs What we achieve? Eg: 25 Trained farmers on improved goat farming Activities What we do? Eg: Training on Improved Goat Farming Inputs What we invest? Eg: NRs 65,000 (Financial and Human Resources)
  • 29.
    • Results chainidentify the means-ends relations in the analysis of objectives • Steps in results chain; – Start from outcome – Identify the impact the outcome contributes to – Define outputs – Plan for the activities needed to achieve those outputs – Work on the inputs needed to implement those activities • For establishing means-ends relationship use logic models within the RBM shift or use results chain
  • 30.
    Inputs Outputs Outcomes Impact Resources Trained Farmers on GoatRaising Commercial Goat Raising Increase in Farm Productivity Access to Improved Breeds Adoption of GHP Trained Farmers on GHP Community breeding centers established
  • 31.
    Format of ResultsFramework Results Indicators and MOV Responsible Assumpti on/Risk Indicators Baseline Target MOV Yr 1 Yr 2 Yr 3 Impact Outcome 1 - Output 1.1 Output 1.2 Outcome 2- Output 2.1 Output 2.2 Outcome 3- Output 3.1 Output 3.2 Outcome 4- Output 4.1 Output 4.2 Programs/ sub-programs Bud get Bud get Bud get
  • 32.
    Results Framework Results IndicatorsBase line Targets MOV Res Assump./ Risks 70/71 71/72 72/73 Impact Improved livelihood of the farmers and agri entrepreneurs Rural poverty (%) Outcome 1: Access to the food and nutrition increased Output -1.1 Production and Productivity enhanced • Per capita meat Availability (kg/person/ye ar) • Annual meat Production (000 mt) Surveys, Census and Annual reports MoAD Policy priorities in agriculture
  • 33.
    Results Framework Results IndicatorsBaseli ne Targets MOV Res p Assump./ Risks 70/71 71/72 72/73 Outcome - 2 Agricultural Production System commercialized Output -2.1 Marketing system developed • Annual Market Transaction (00,000Rs) • Number of livestock collection center Progress reports Mo AD Policy priorities in agriculture Major Programs/ Projects Capacity/ Status • Livestock Extension Program (Output 1.1) • Livestock market promotion program (Output 2.1) Budget Budget Budget Budget Budget Budget Budget Budget Budget Budget Budget Budget
  • 34.
    TOR • Result BasedMatrix preparation - Outline of results – impact (s), Outcomes, output, programs/projects -Define indicators • Group presentation Groups 1. District Livestock Development Plan 2. Sectoral plan – Poultry 3. Sectoral plan - Dairy
  • 35.
    Impact : Indicator - Outcome1: Indicator : Output 1.1 : Indicator : Outcome 2 : Indicator : Output 2.1 : Indicator : Program/projects (output …)
  • 36.
    Impact: Outcomes 1. 2. 3. Outcome 1: Output 1.1: Programs/projects 1. 2. Output1.2: Programs/projects 1. 2. Outcome 2: Output 2.1: Programs/projects 1. 2. Output 2.2: Programs/projects 1. 2.