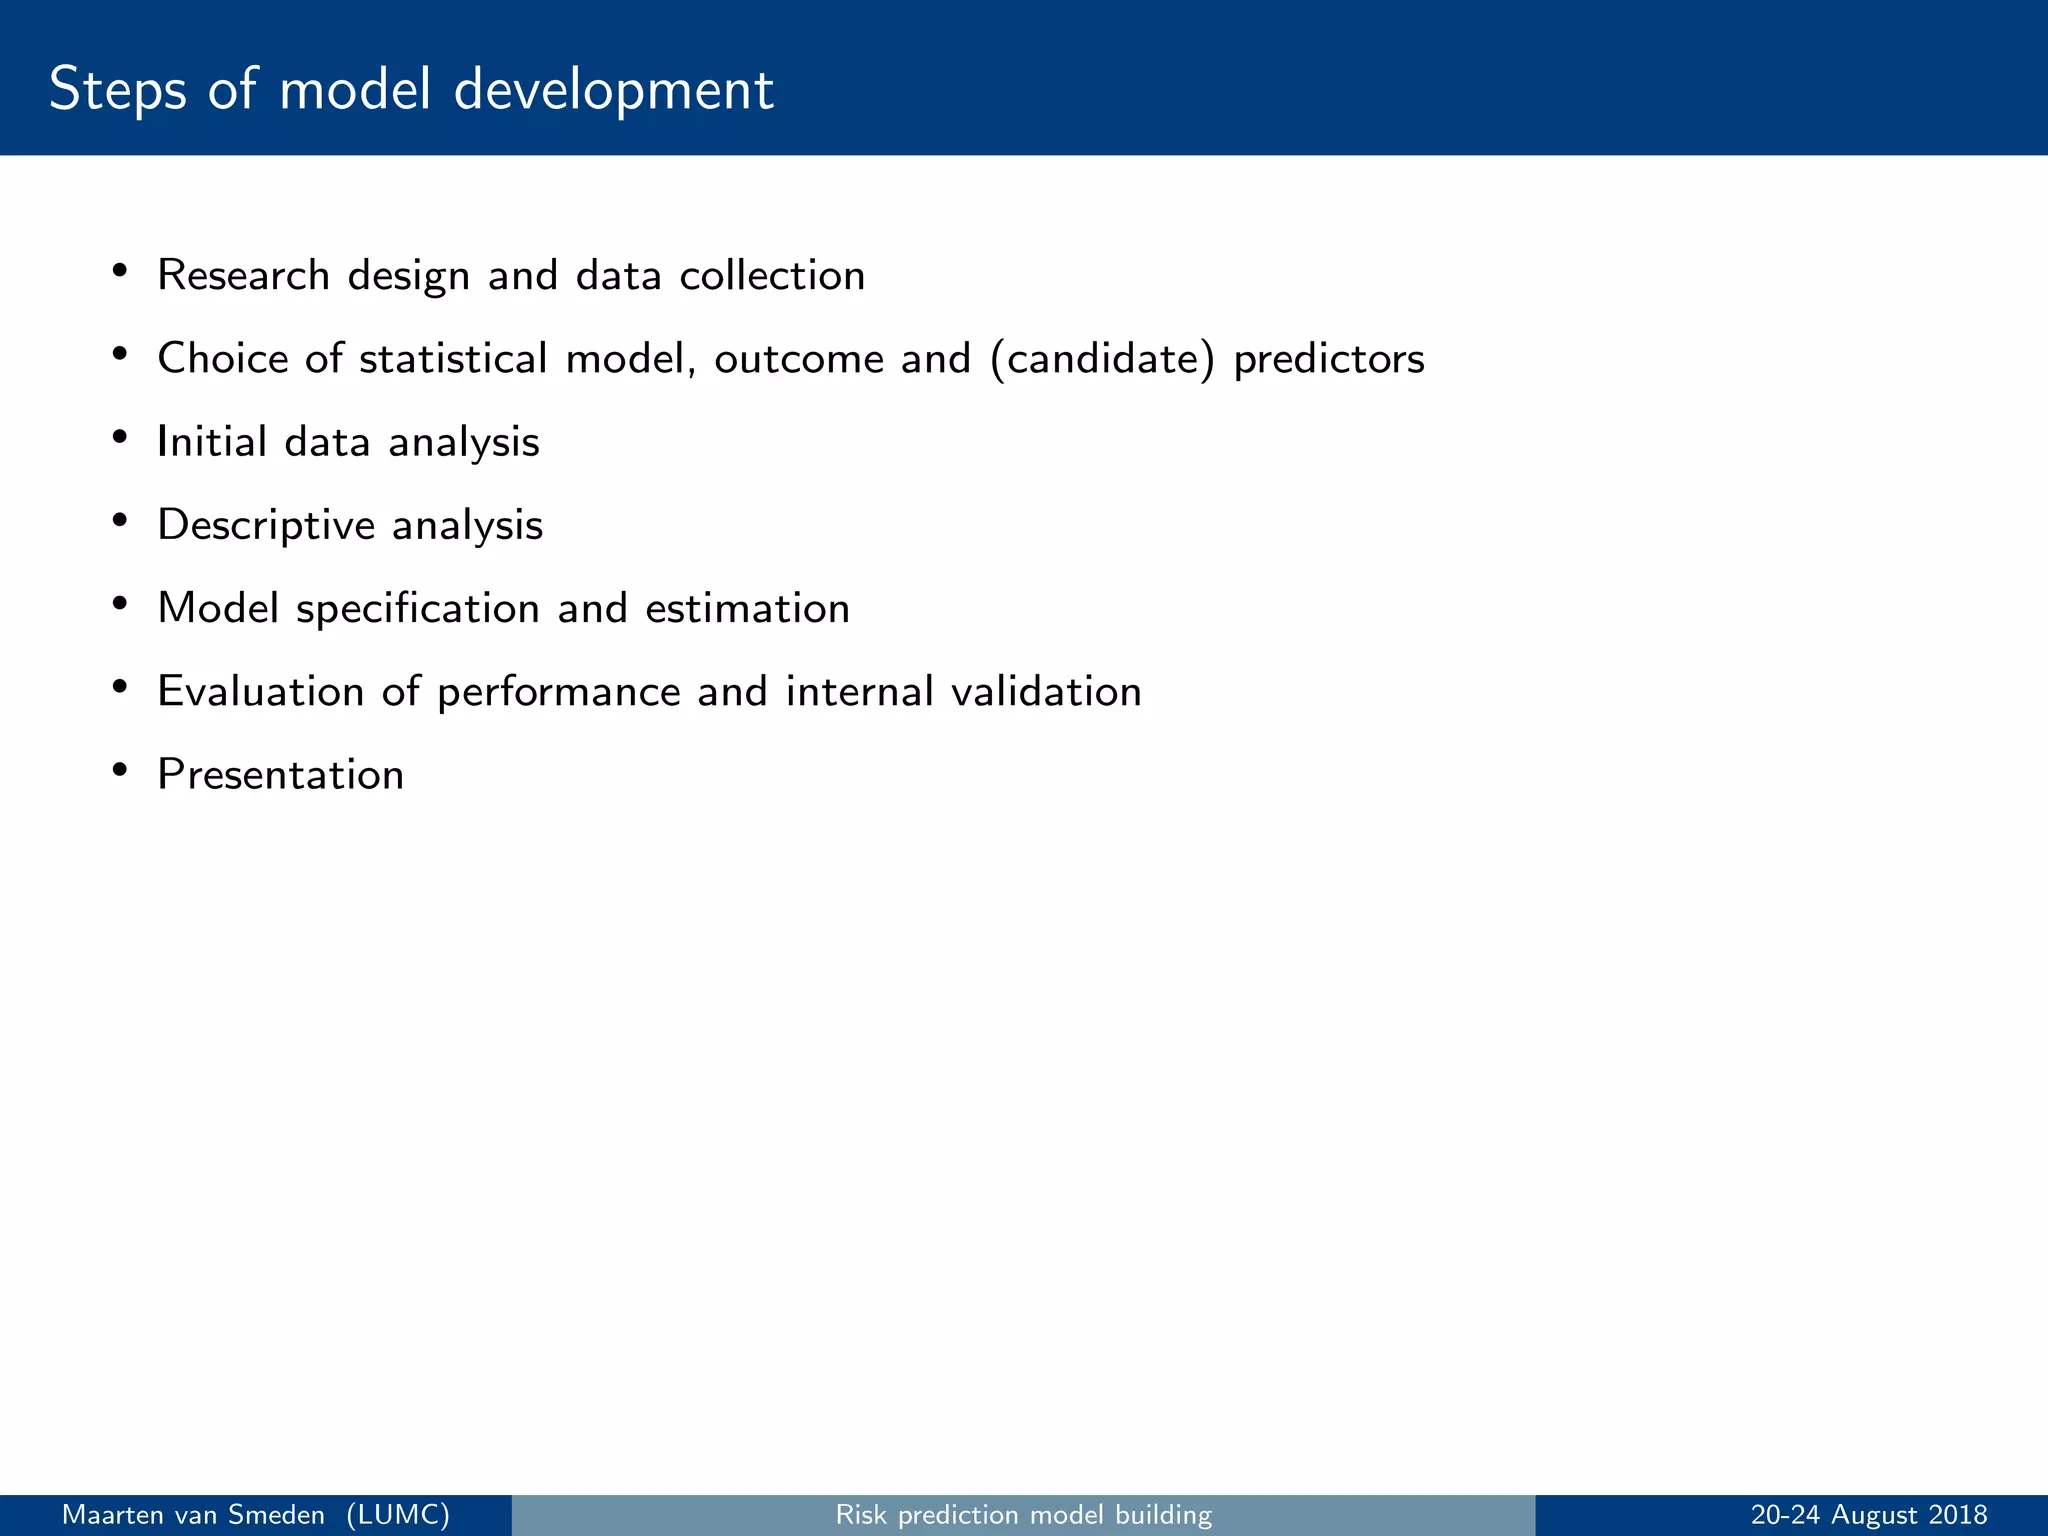
This document summarizes the key steps in building a risk prediction model:
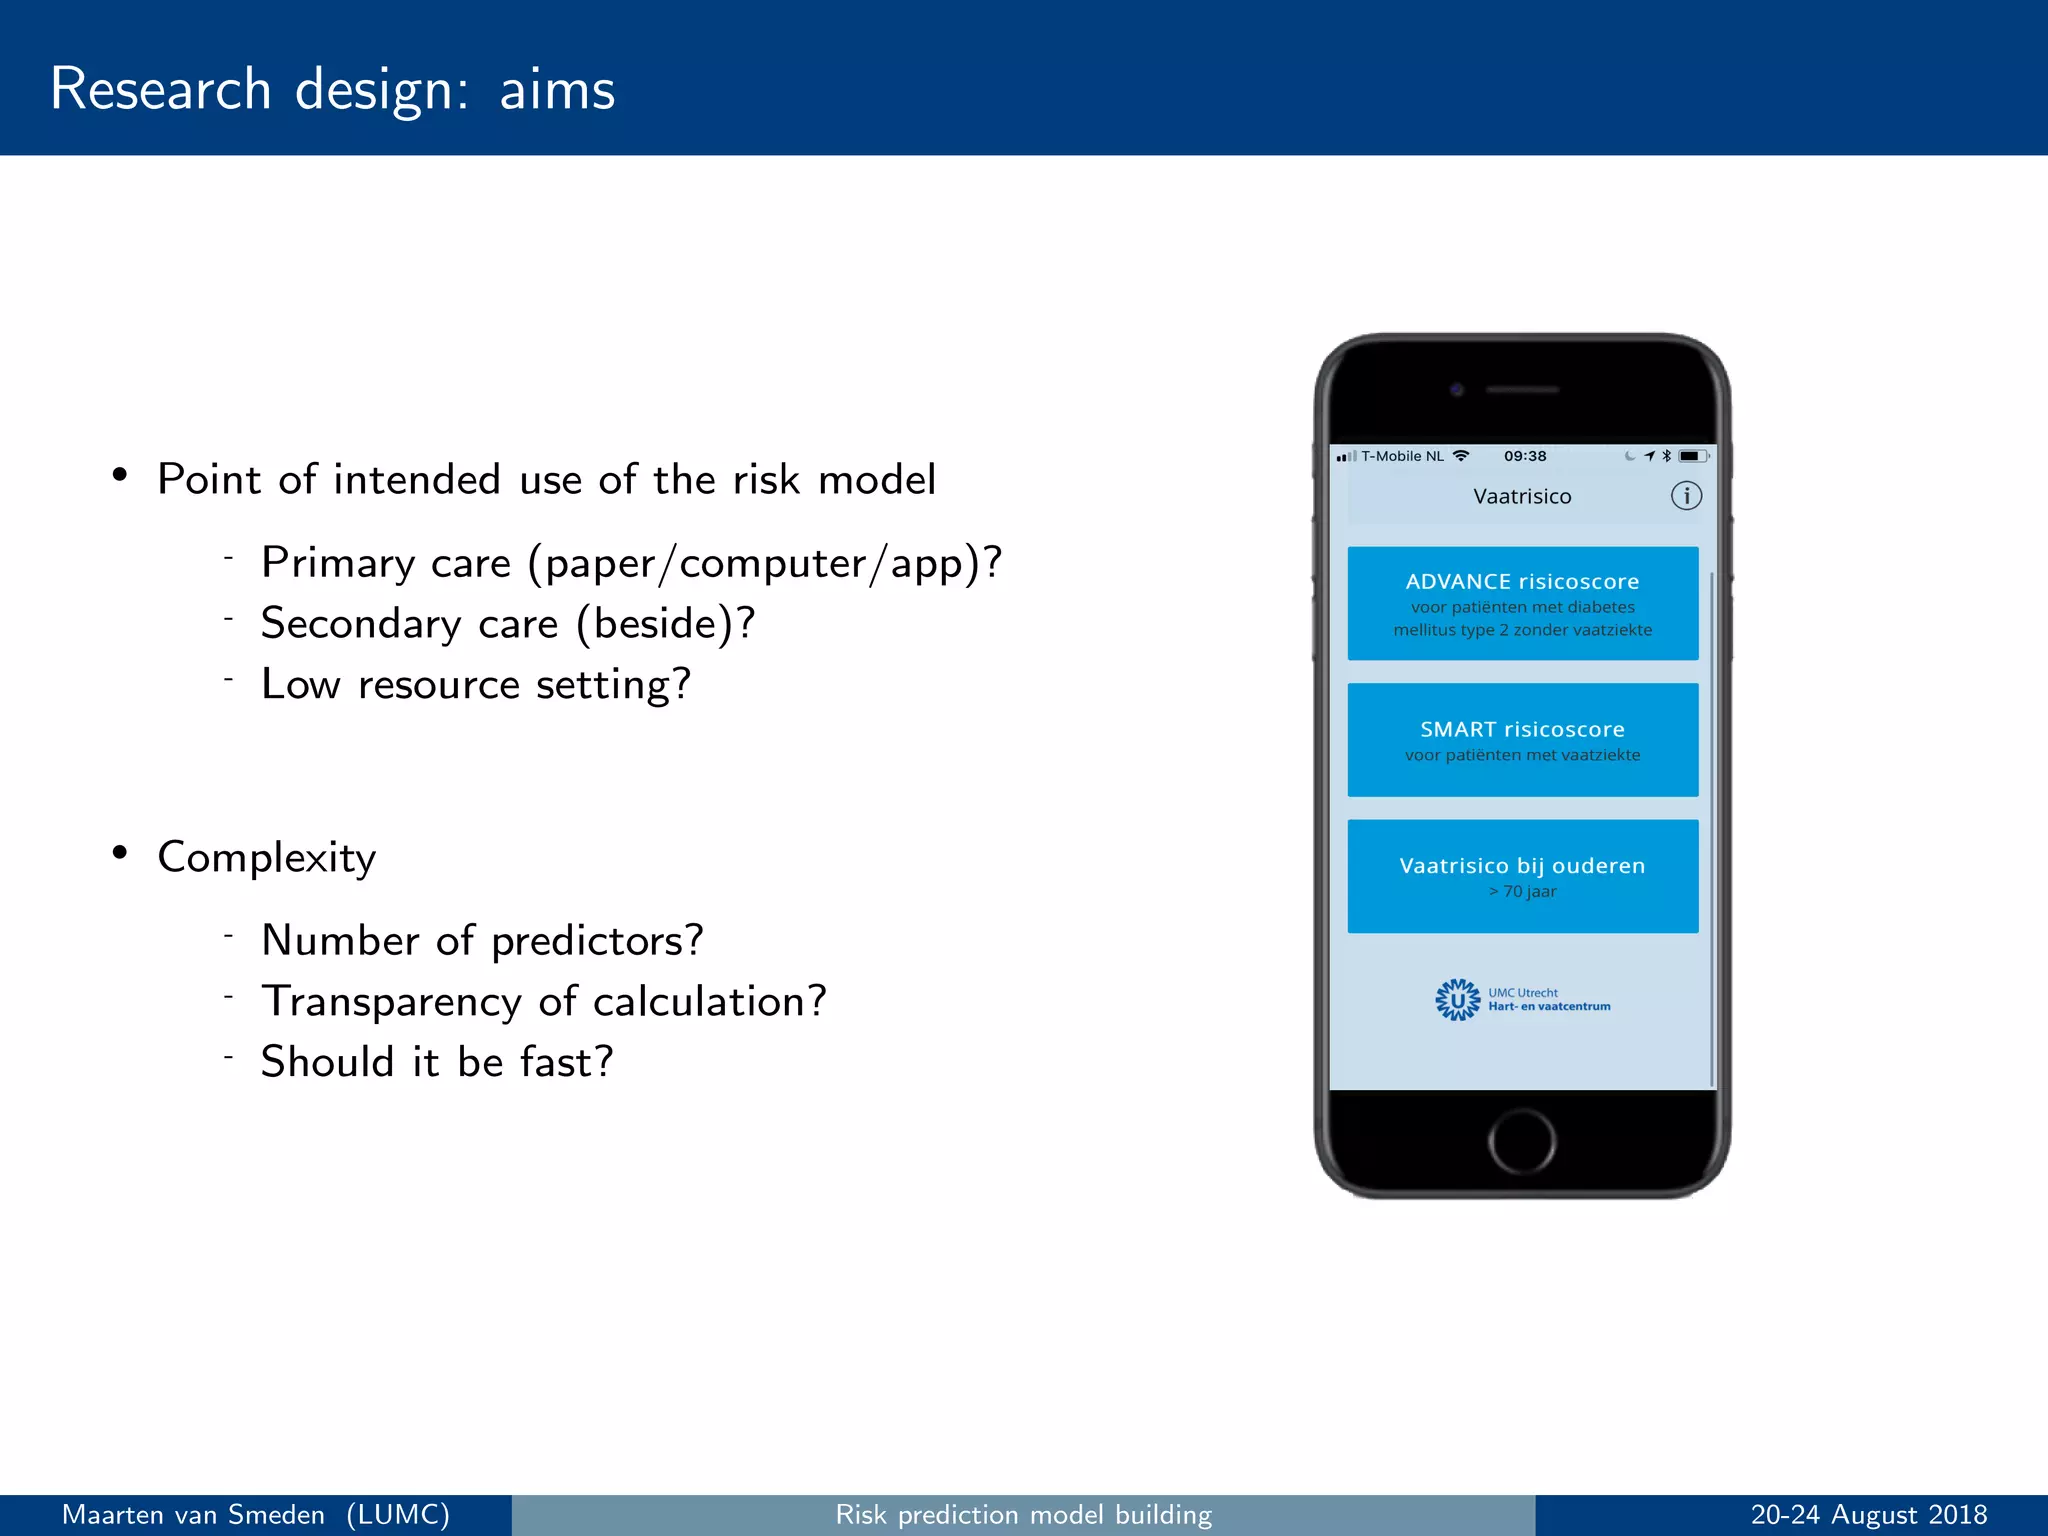
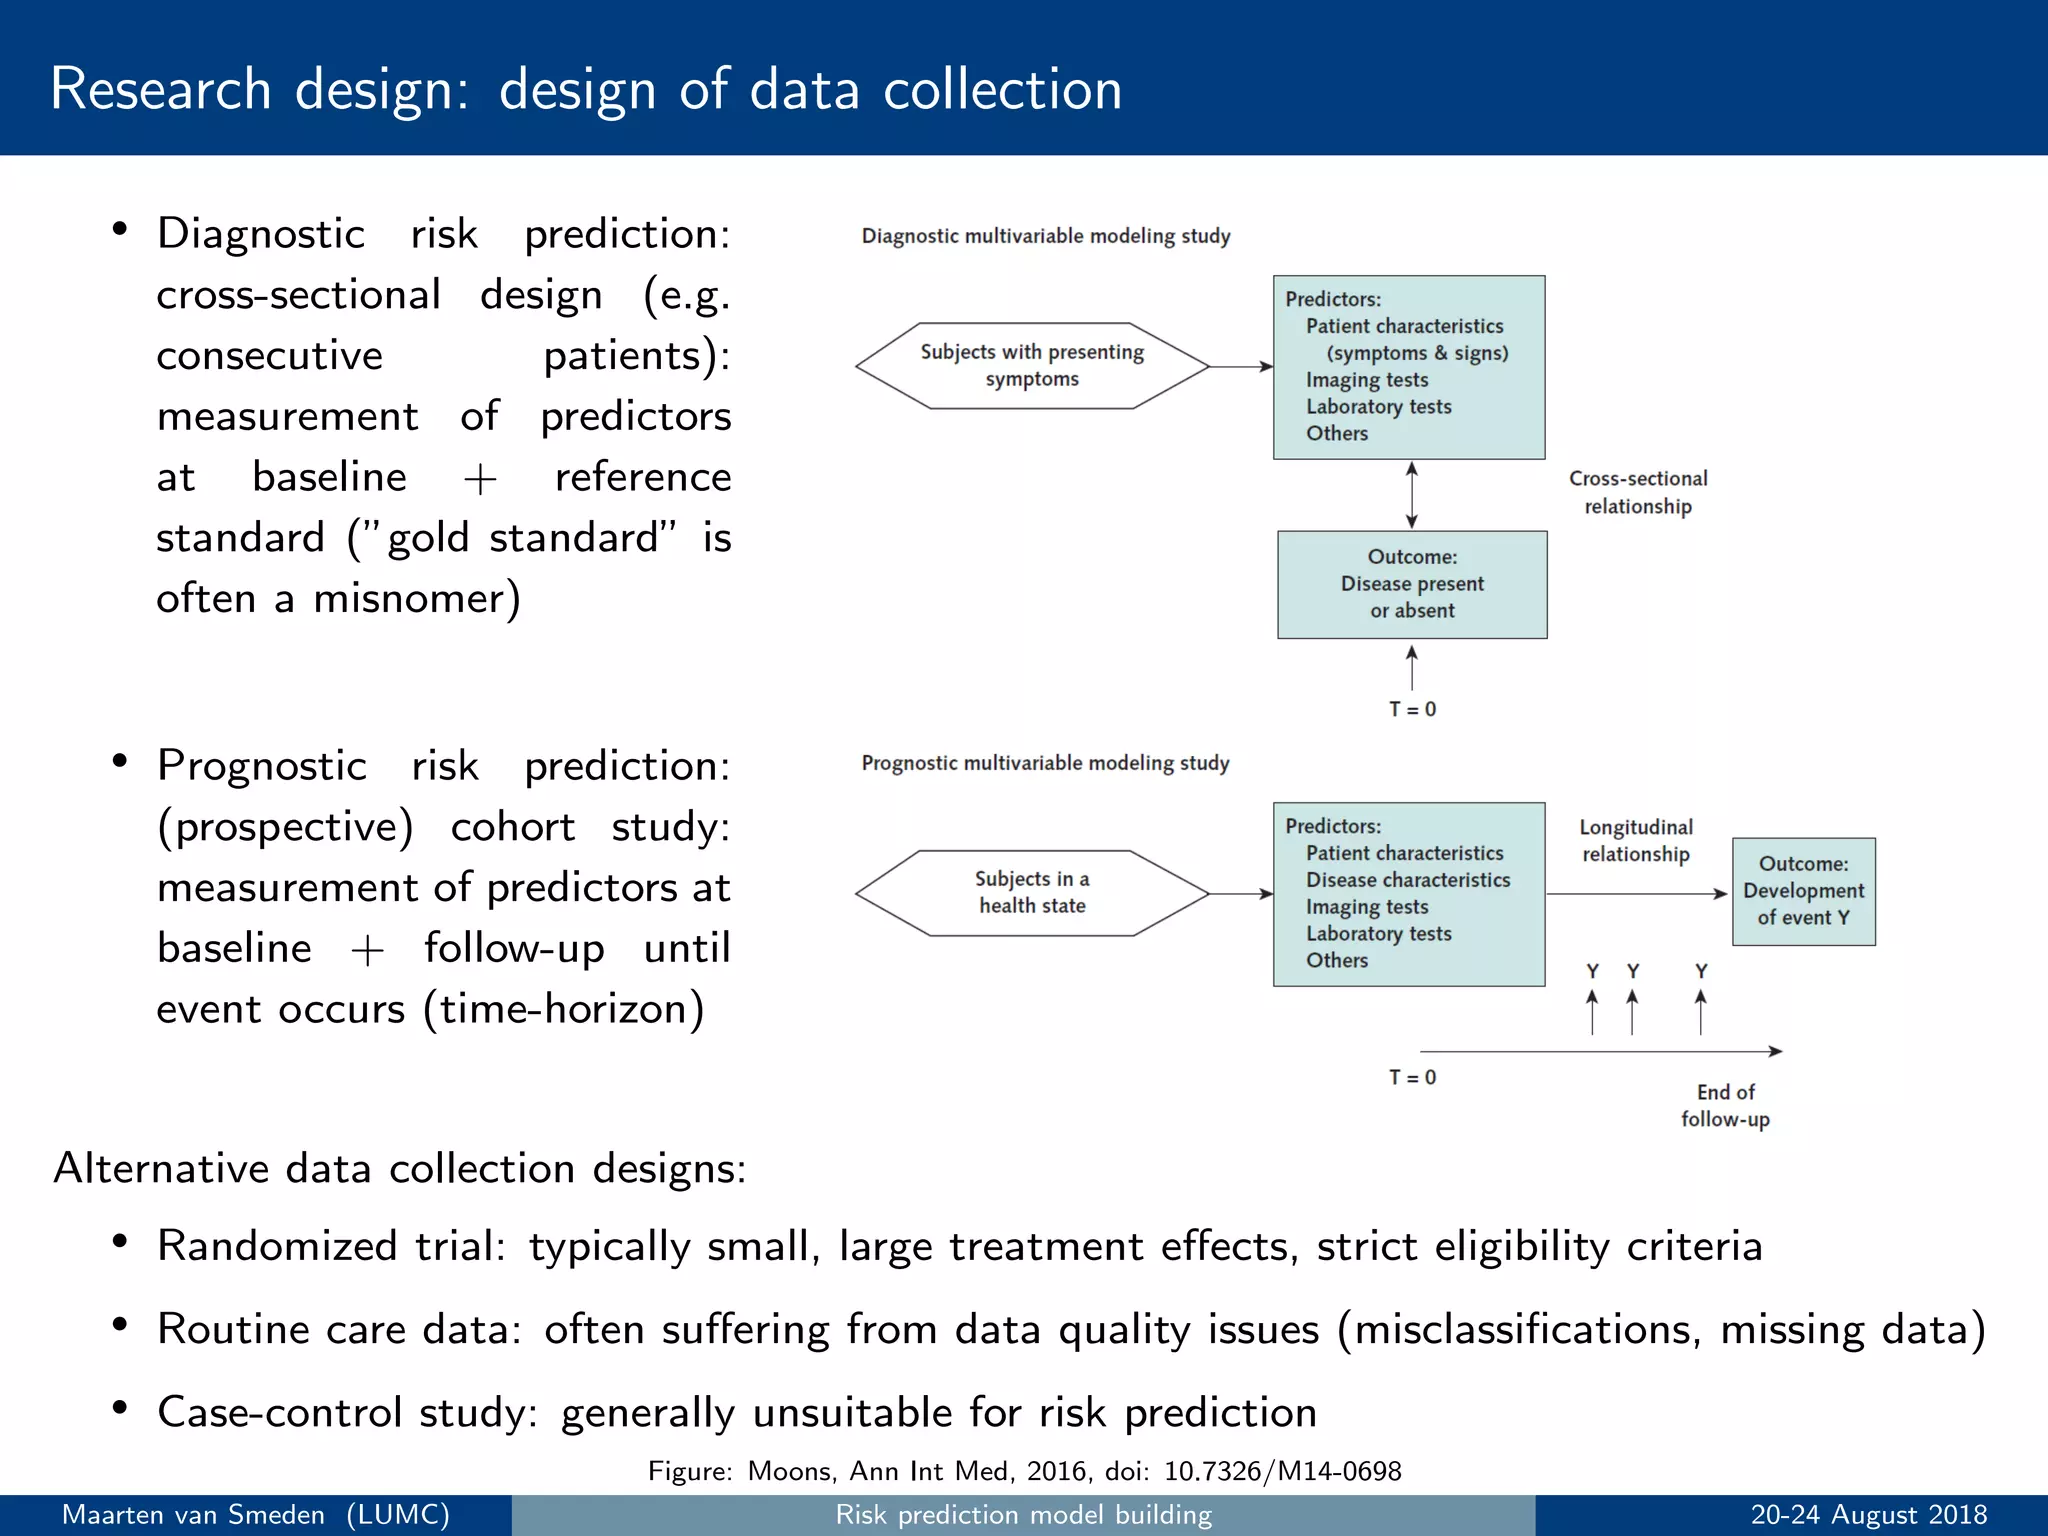
1. Conduct research design and data collection, typically using a prospective cohort study.
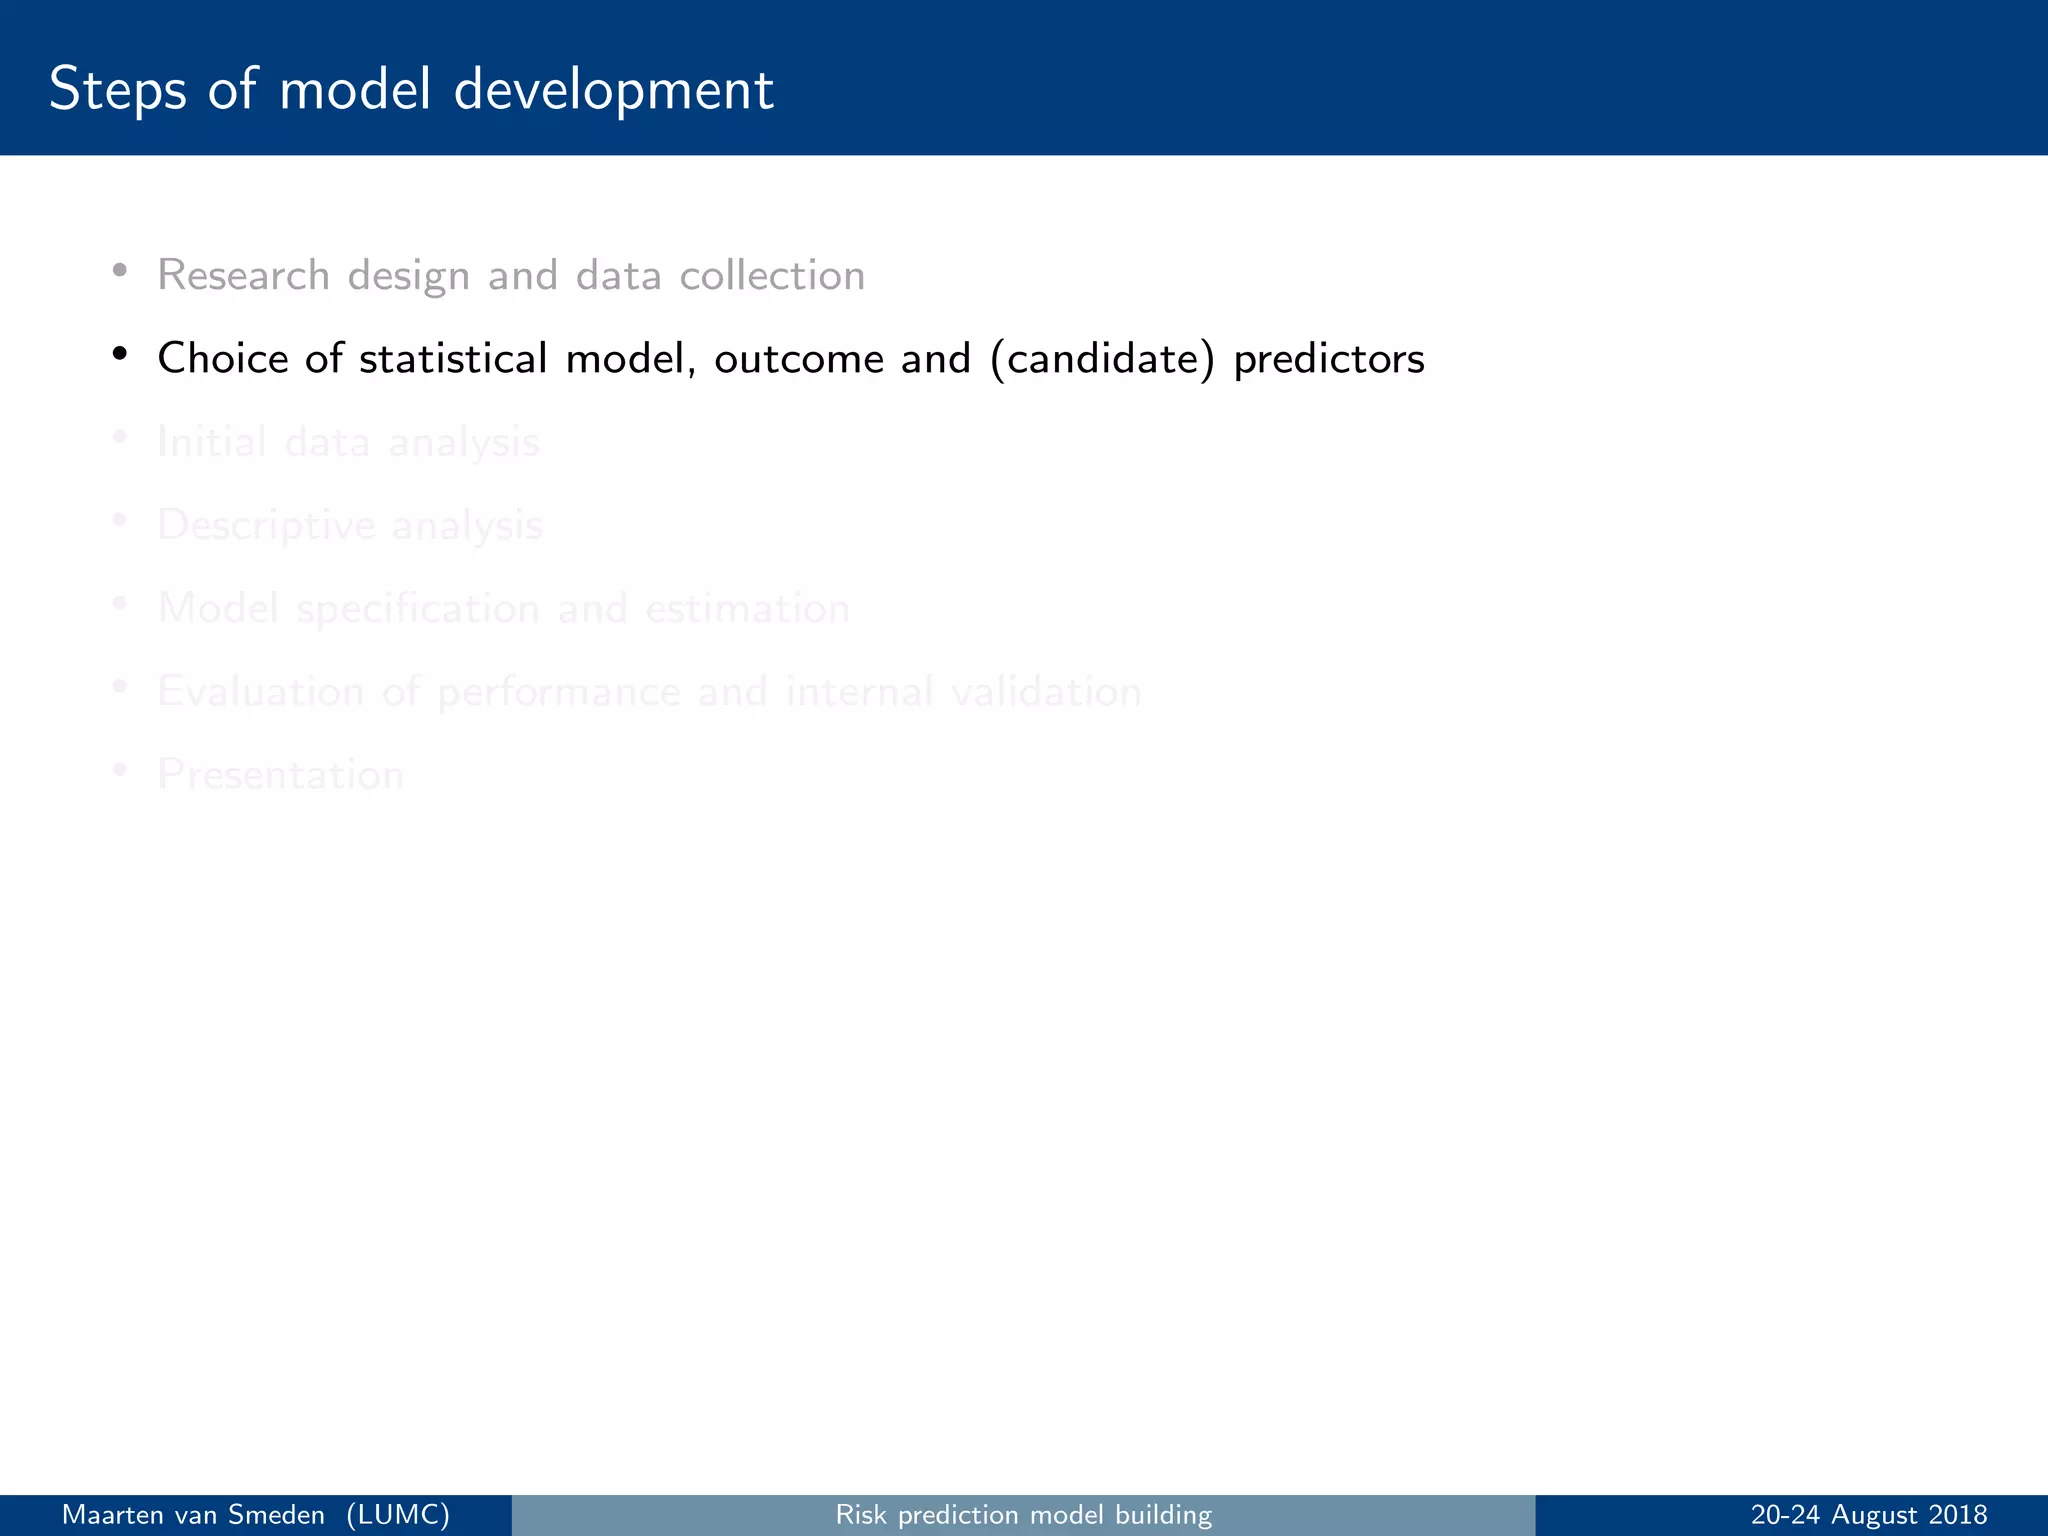
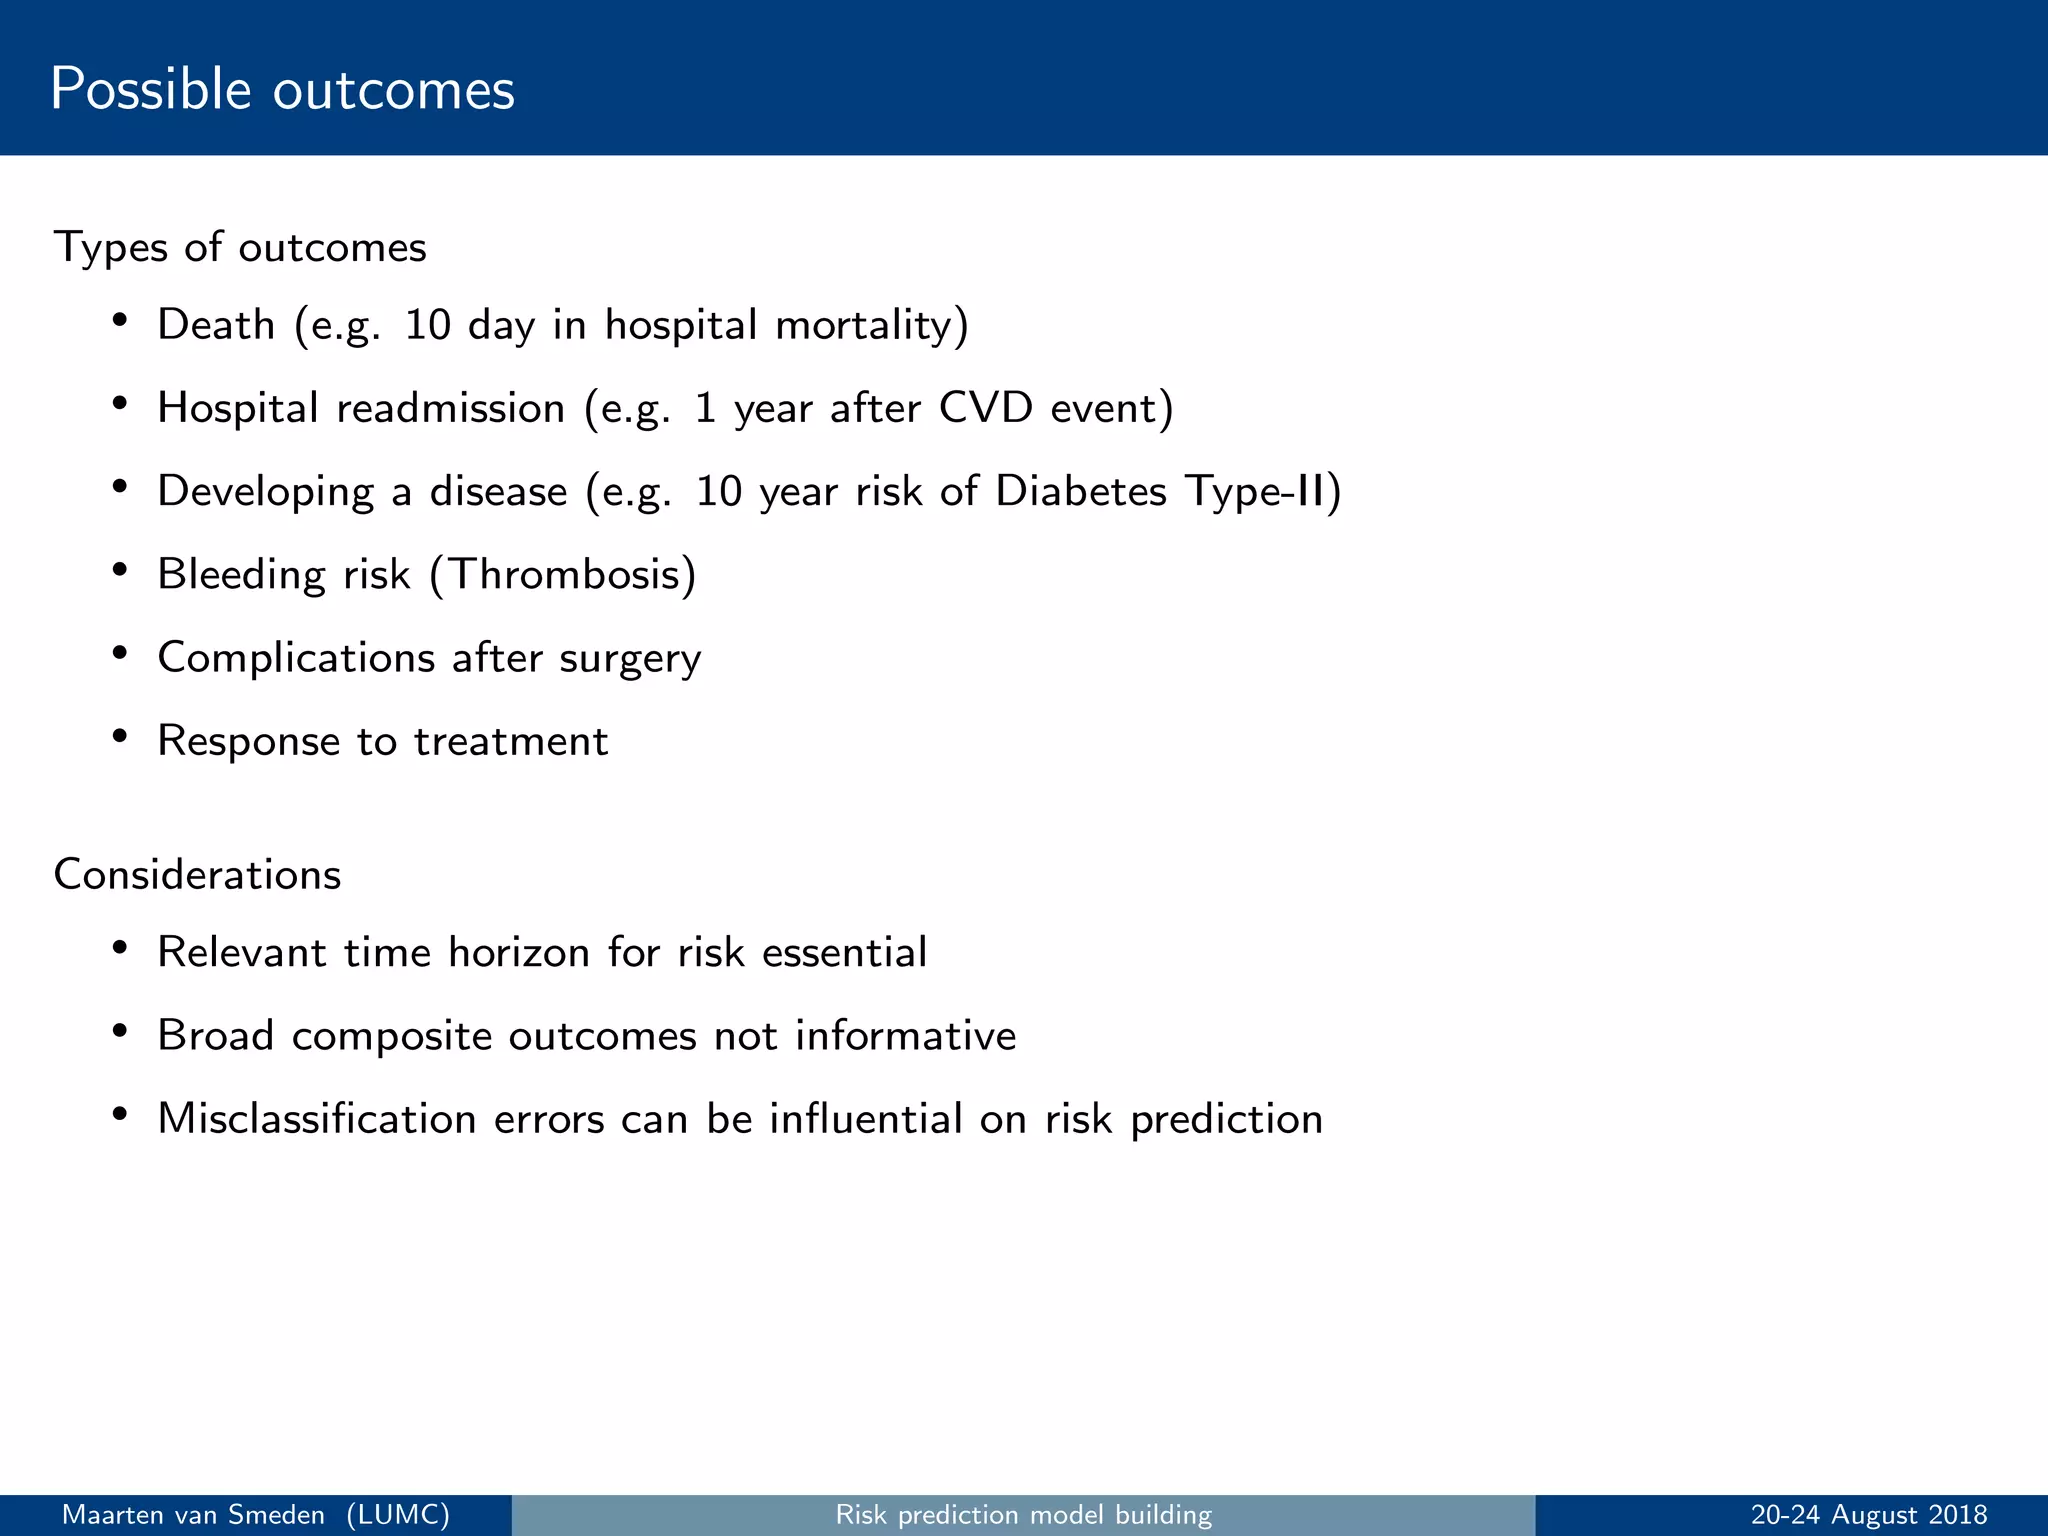
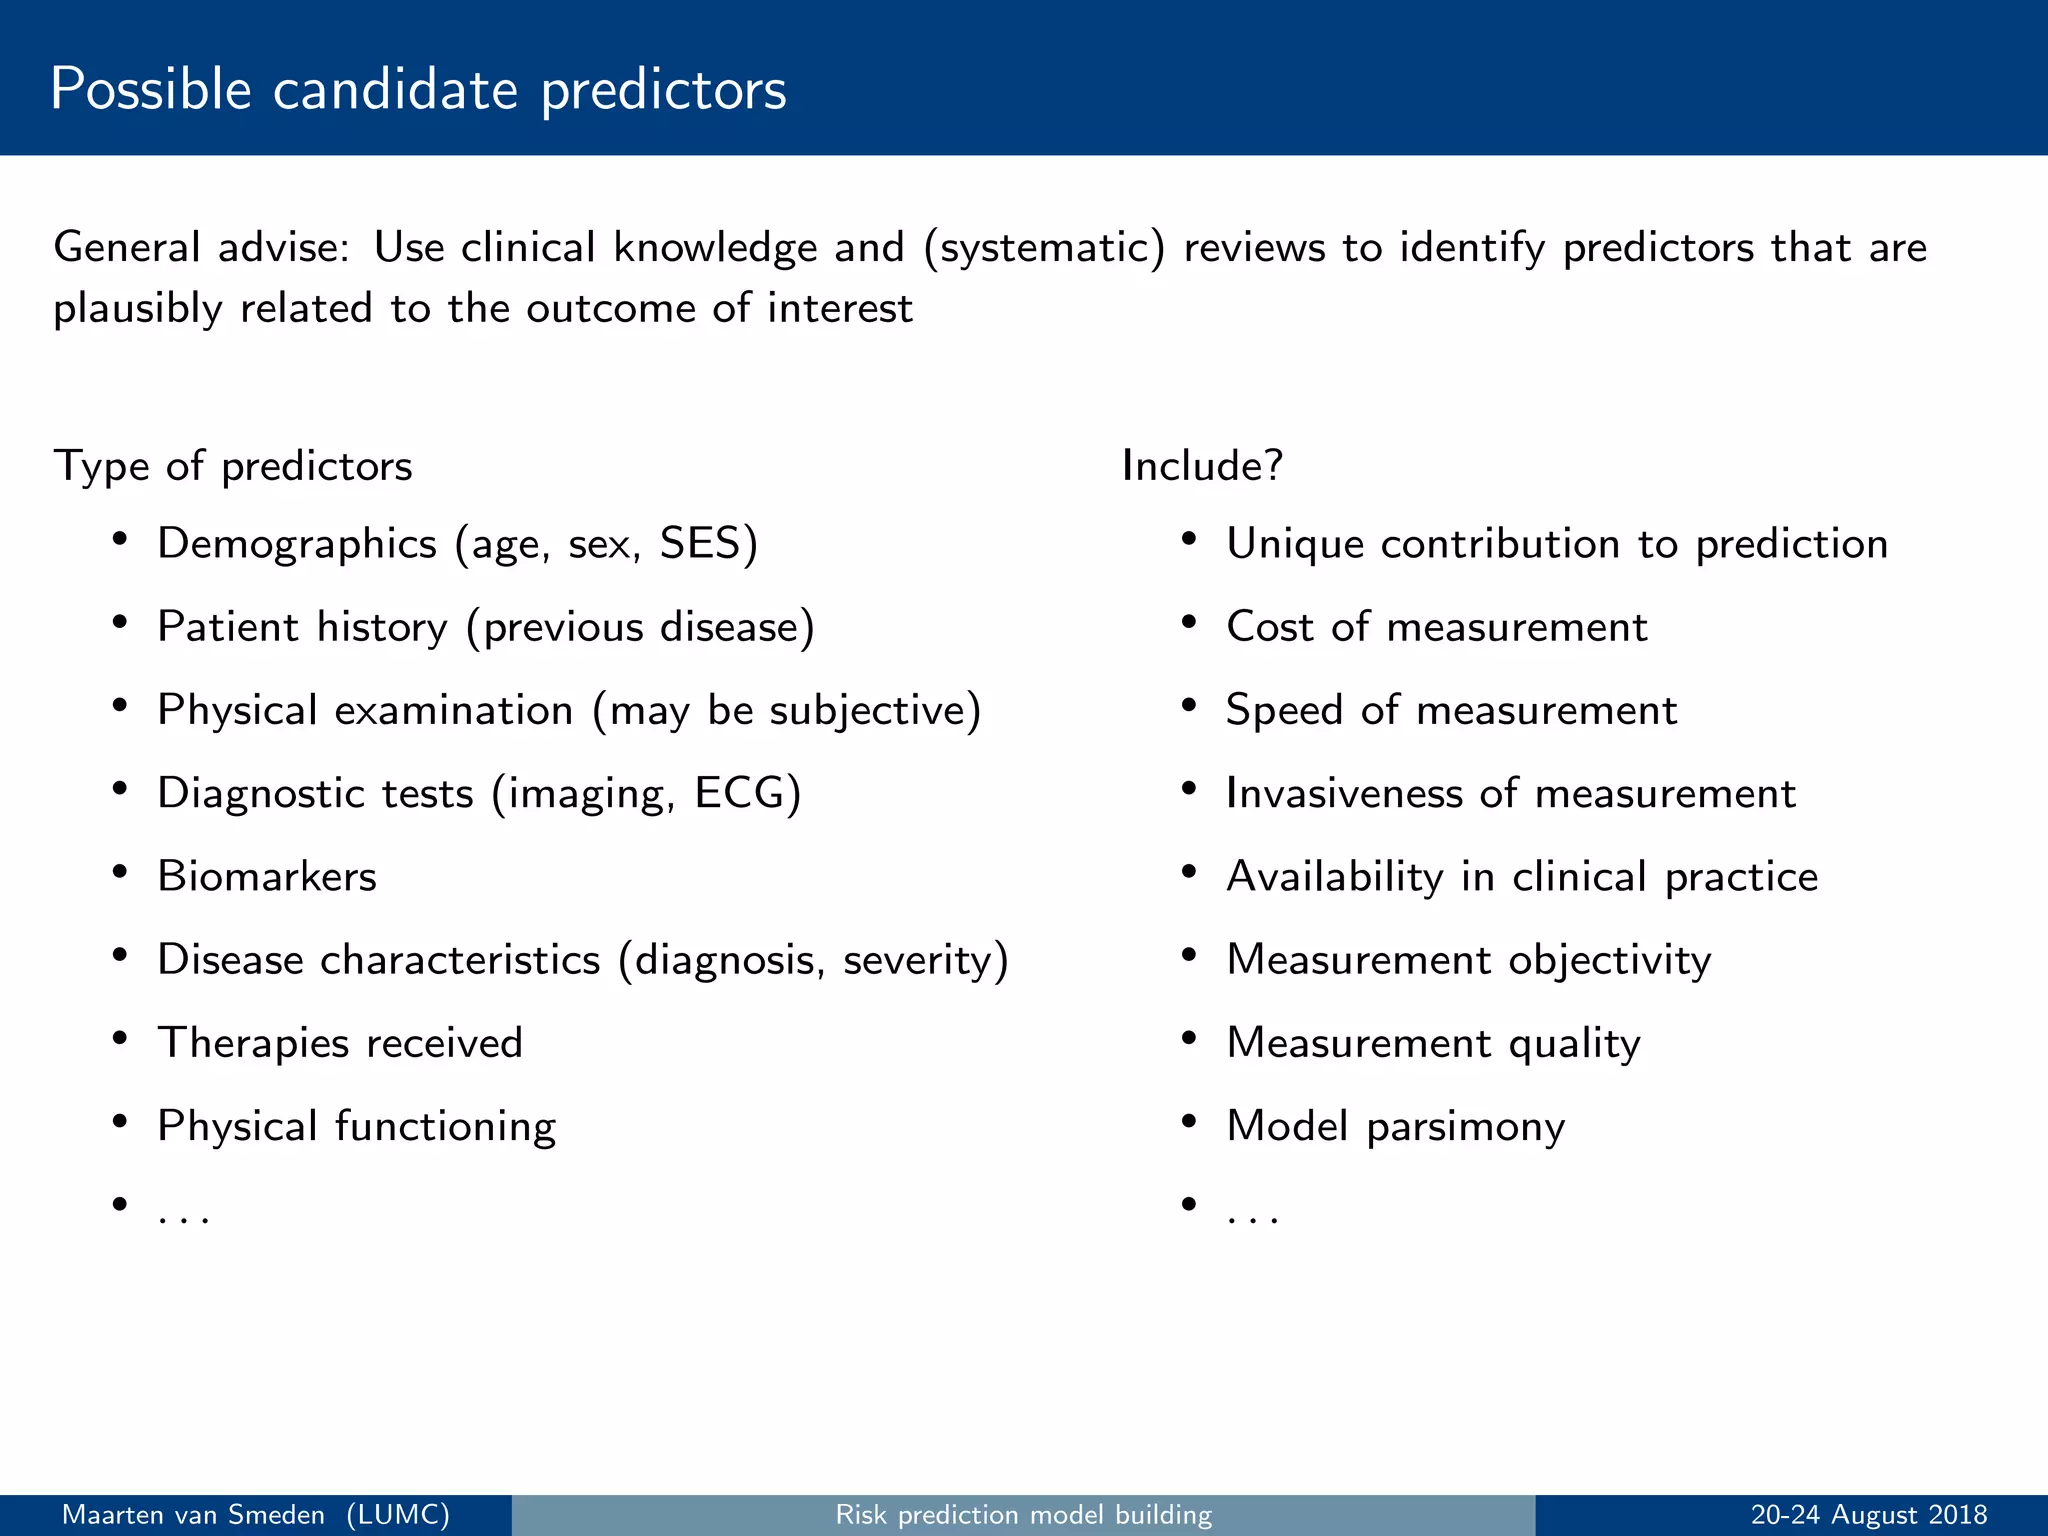
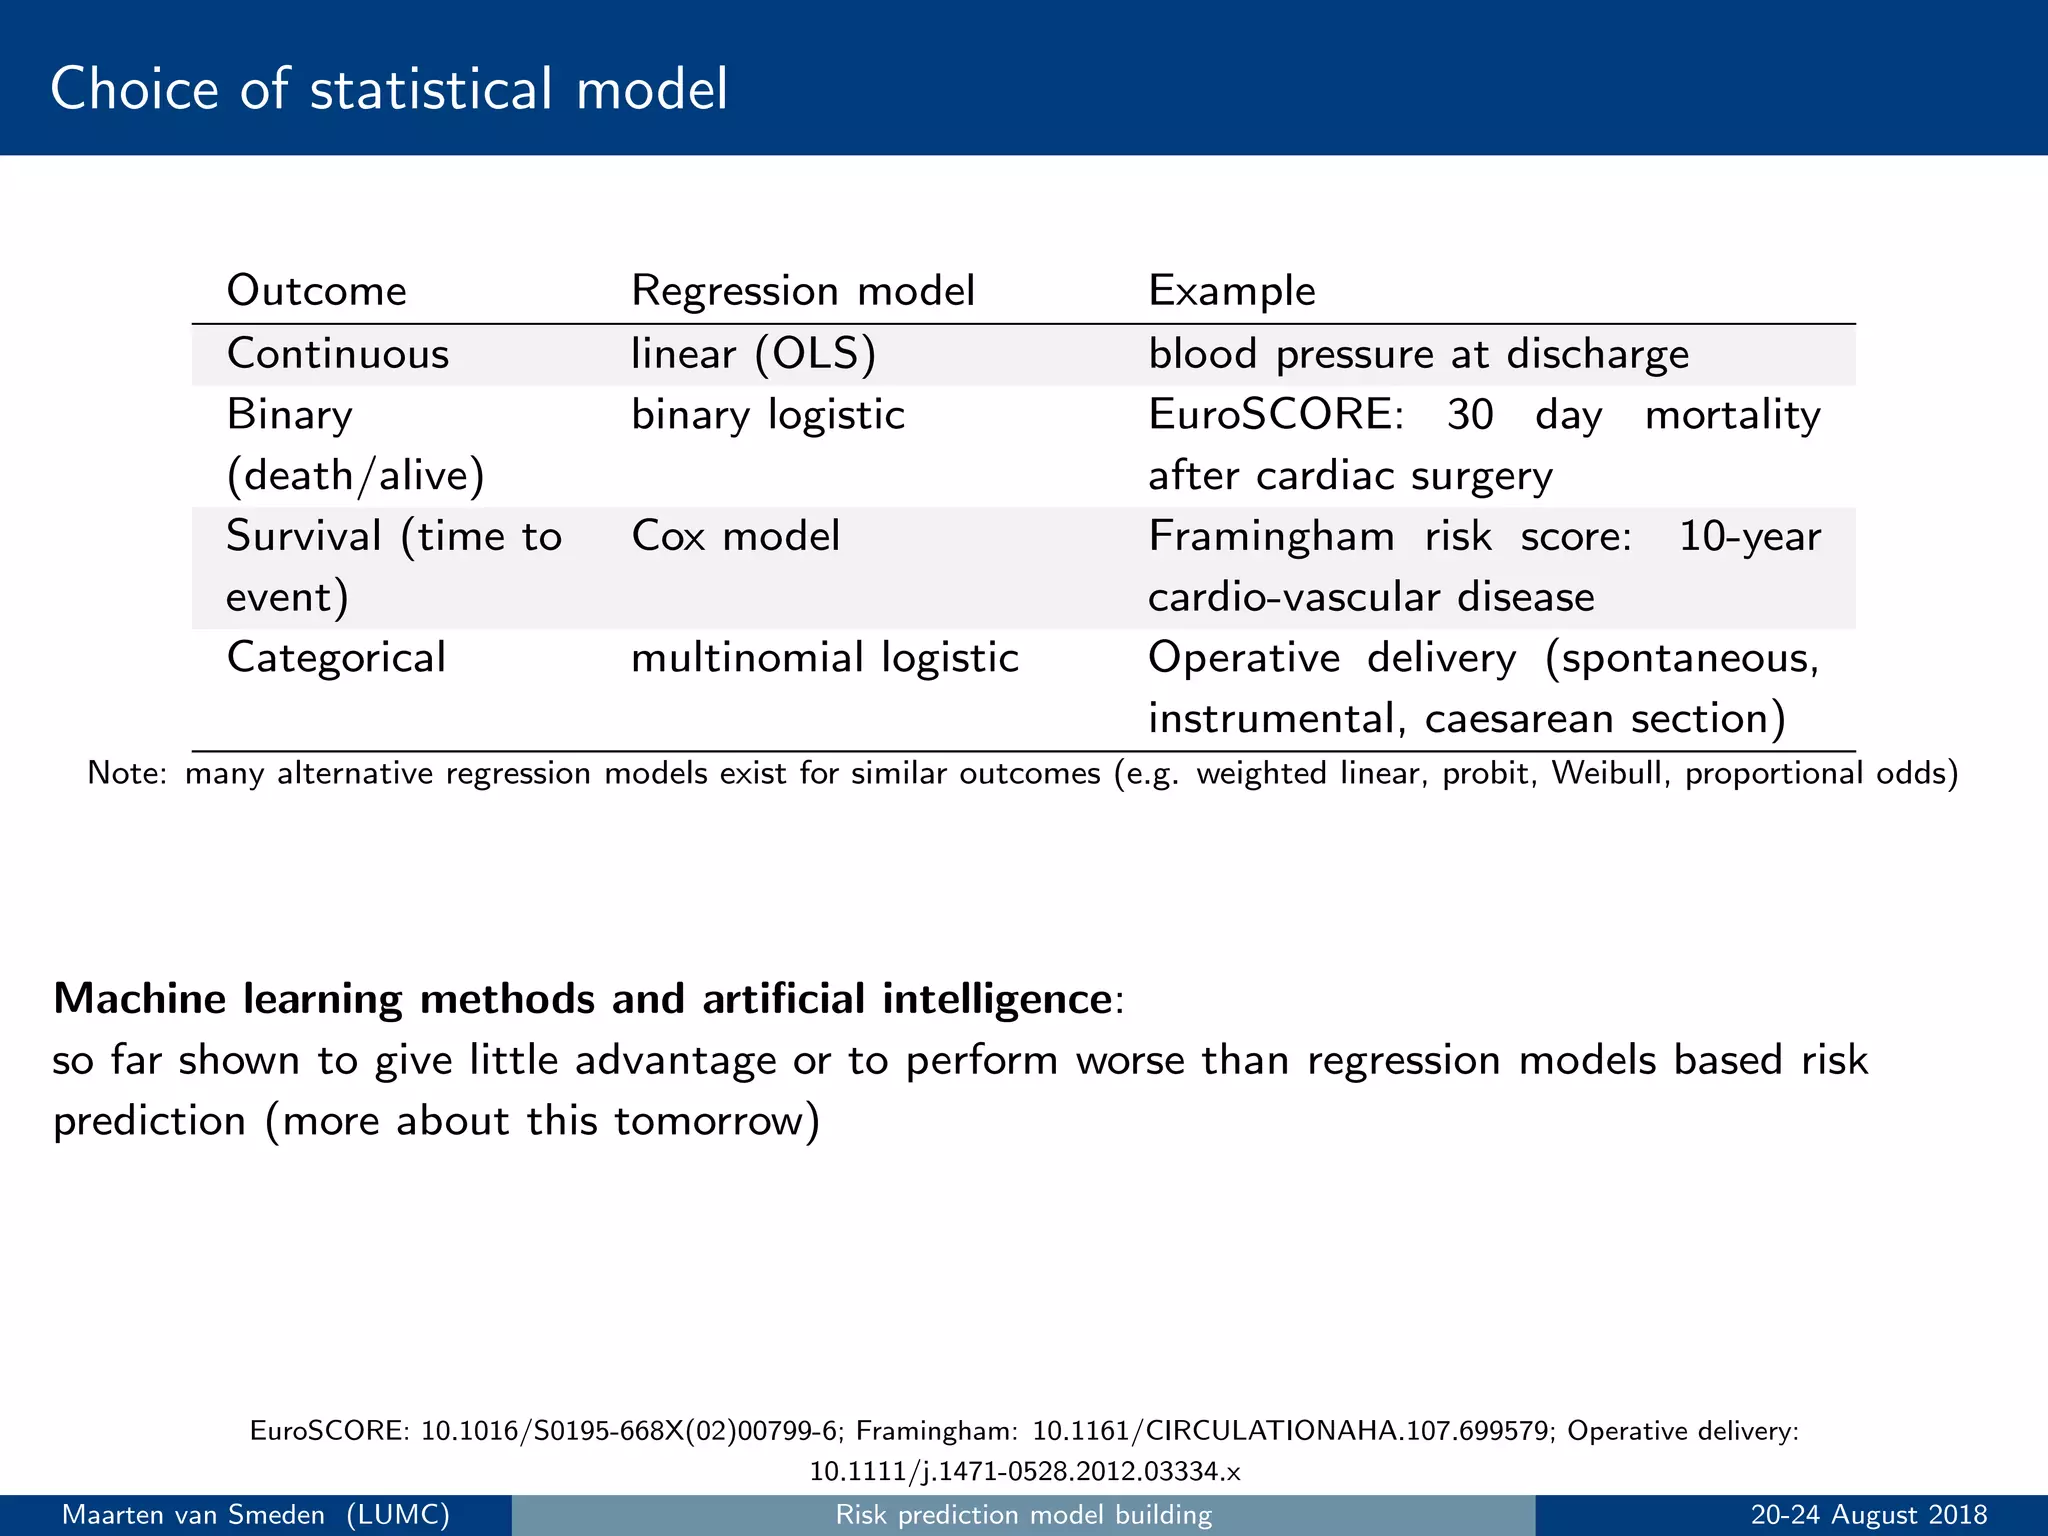
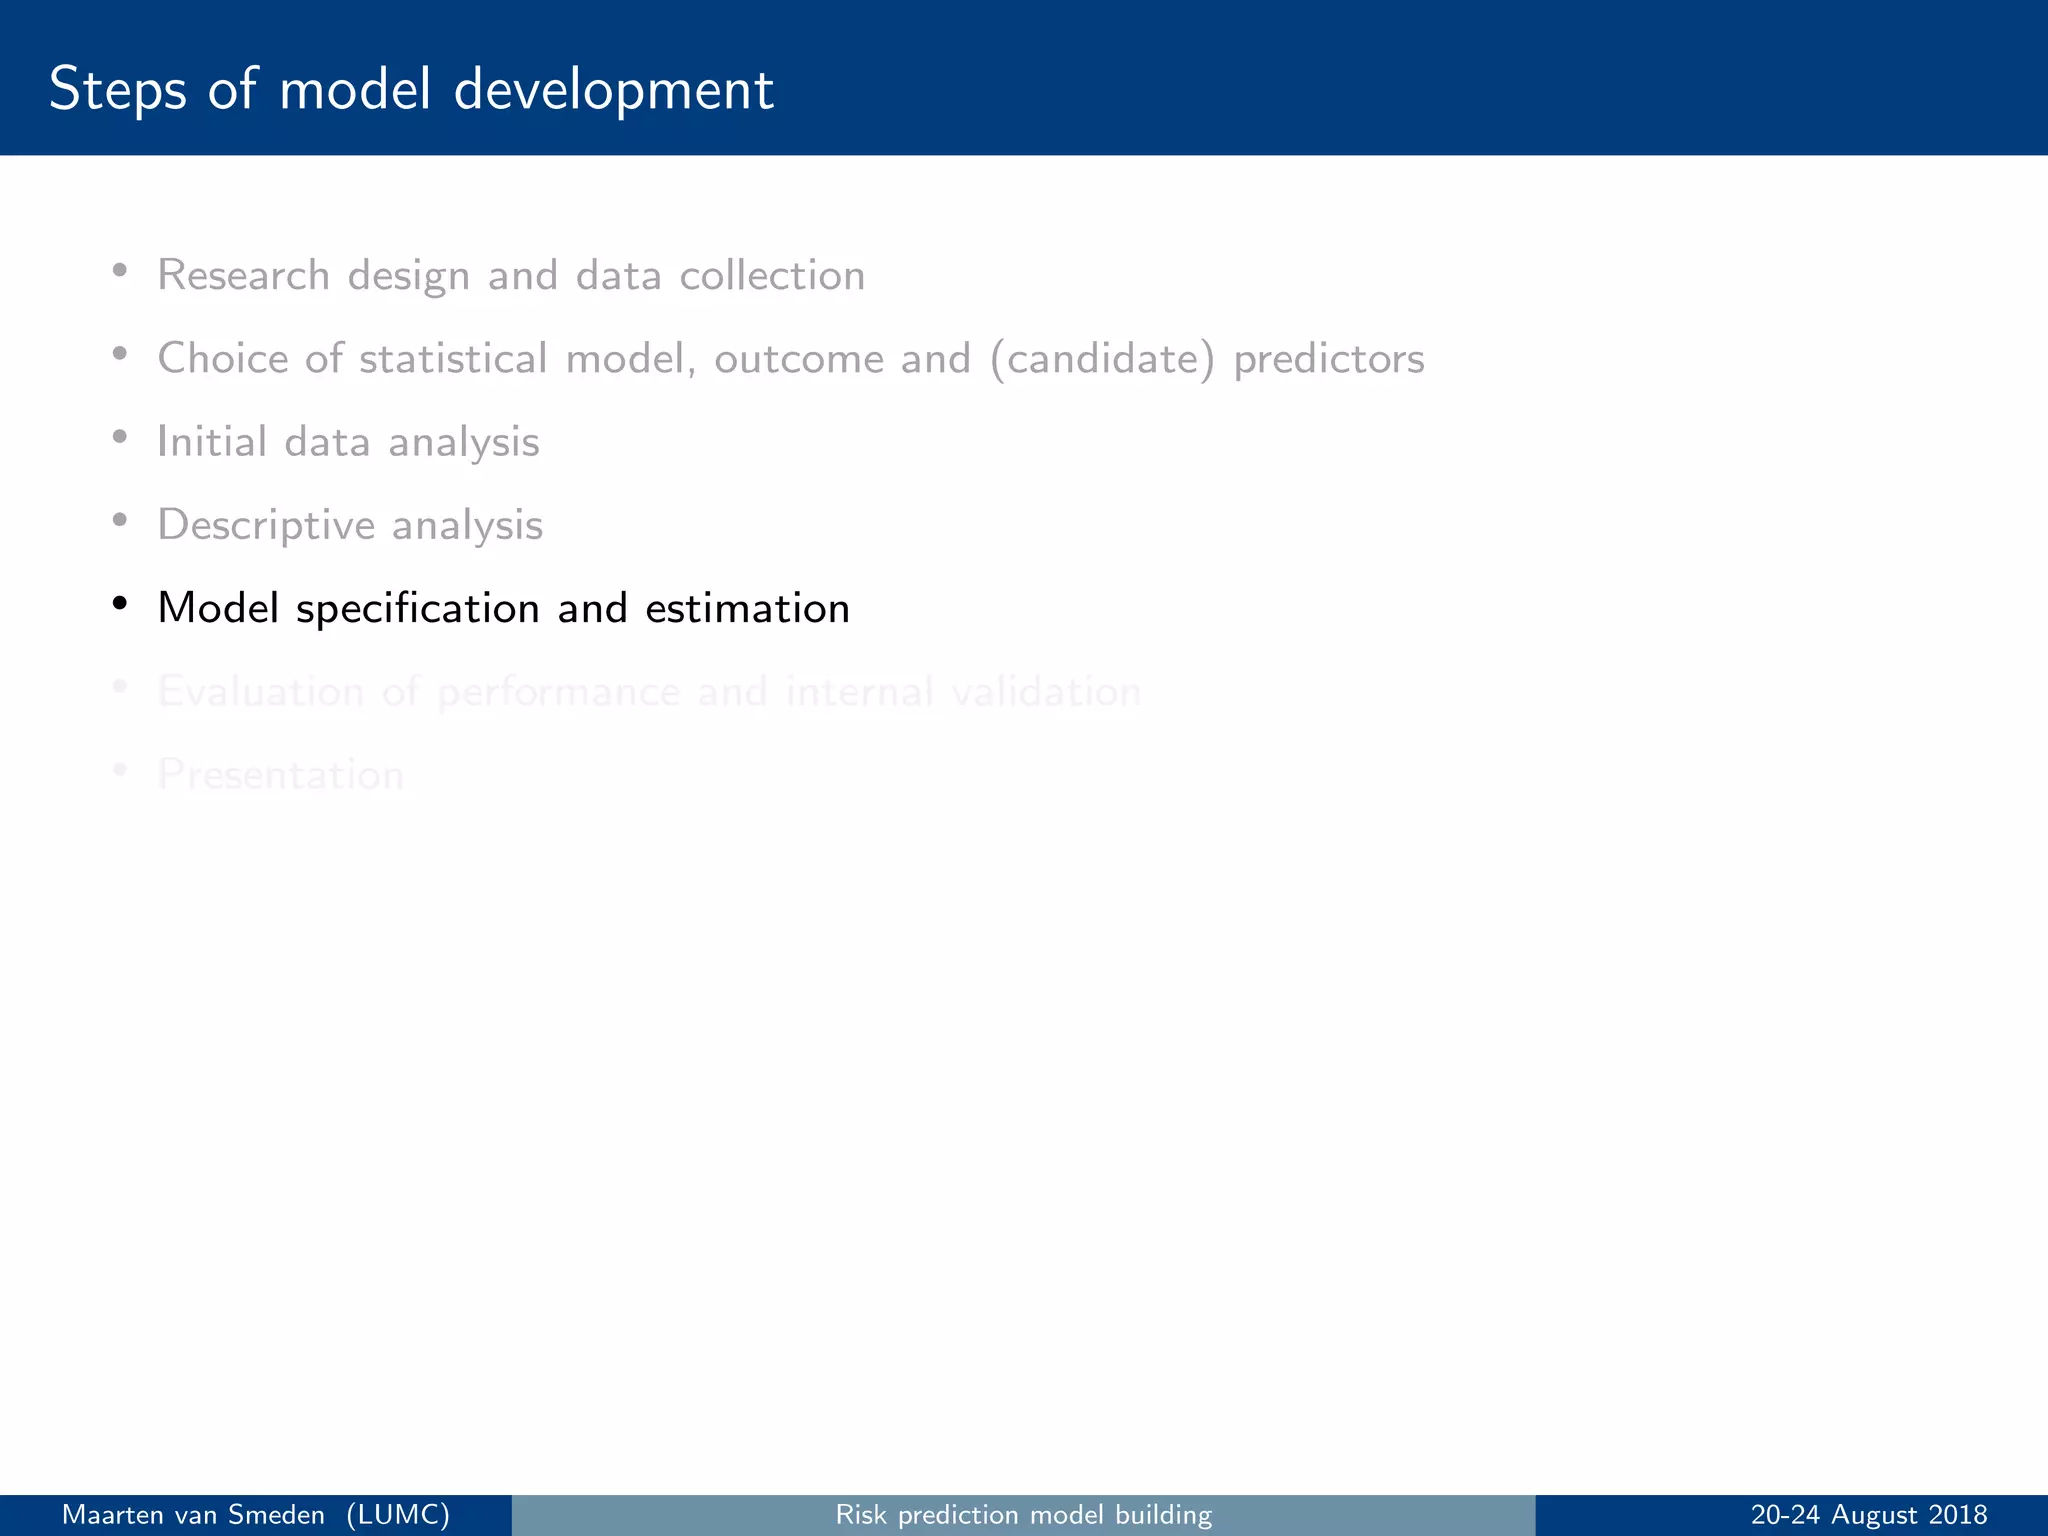
2. Choose statistical model, outcome, and candidate predictors based on clinical knowledge.
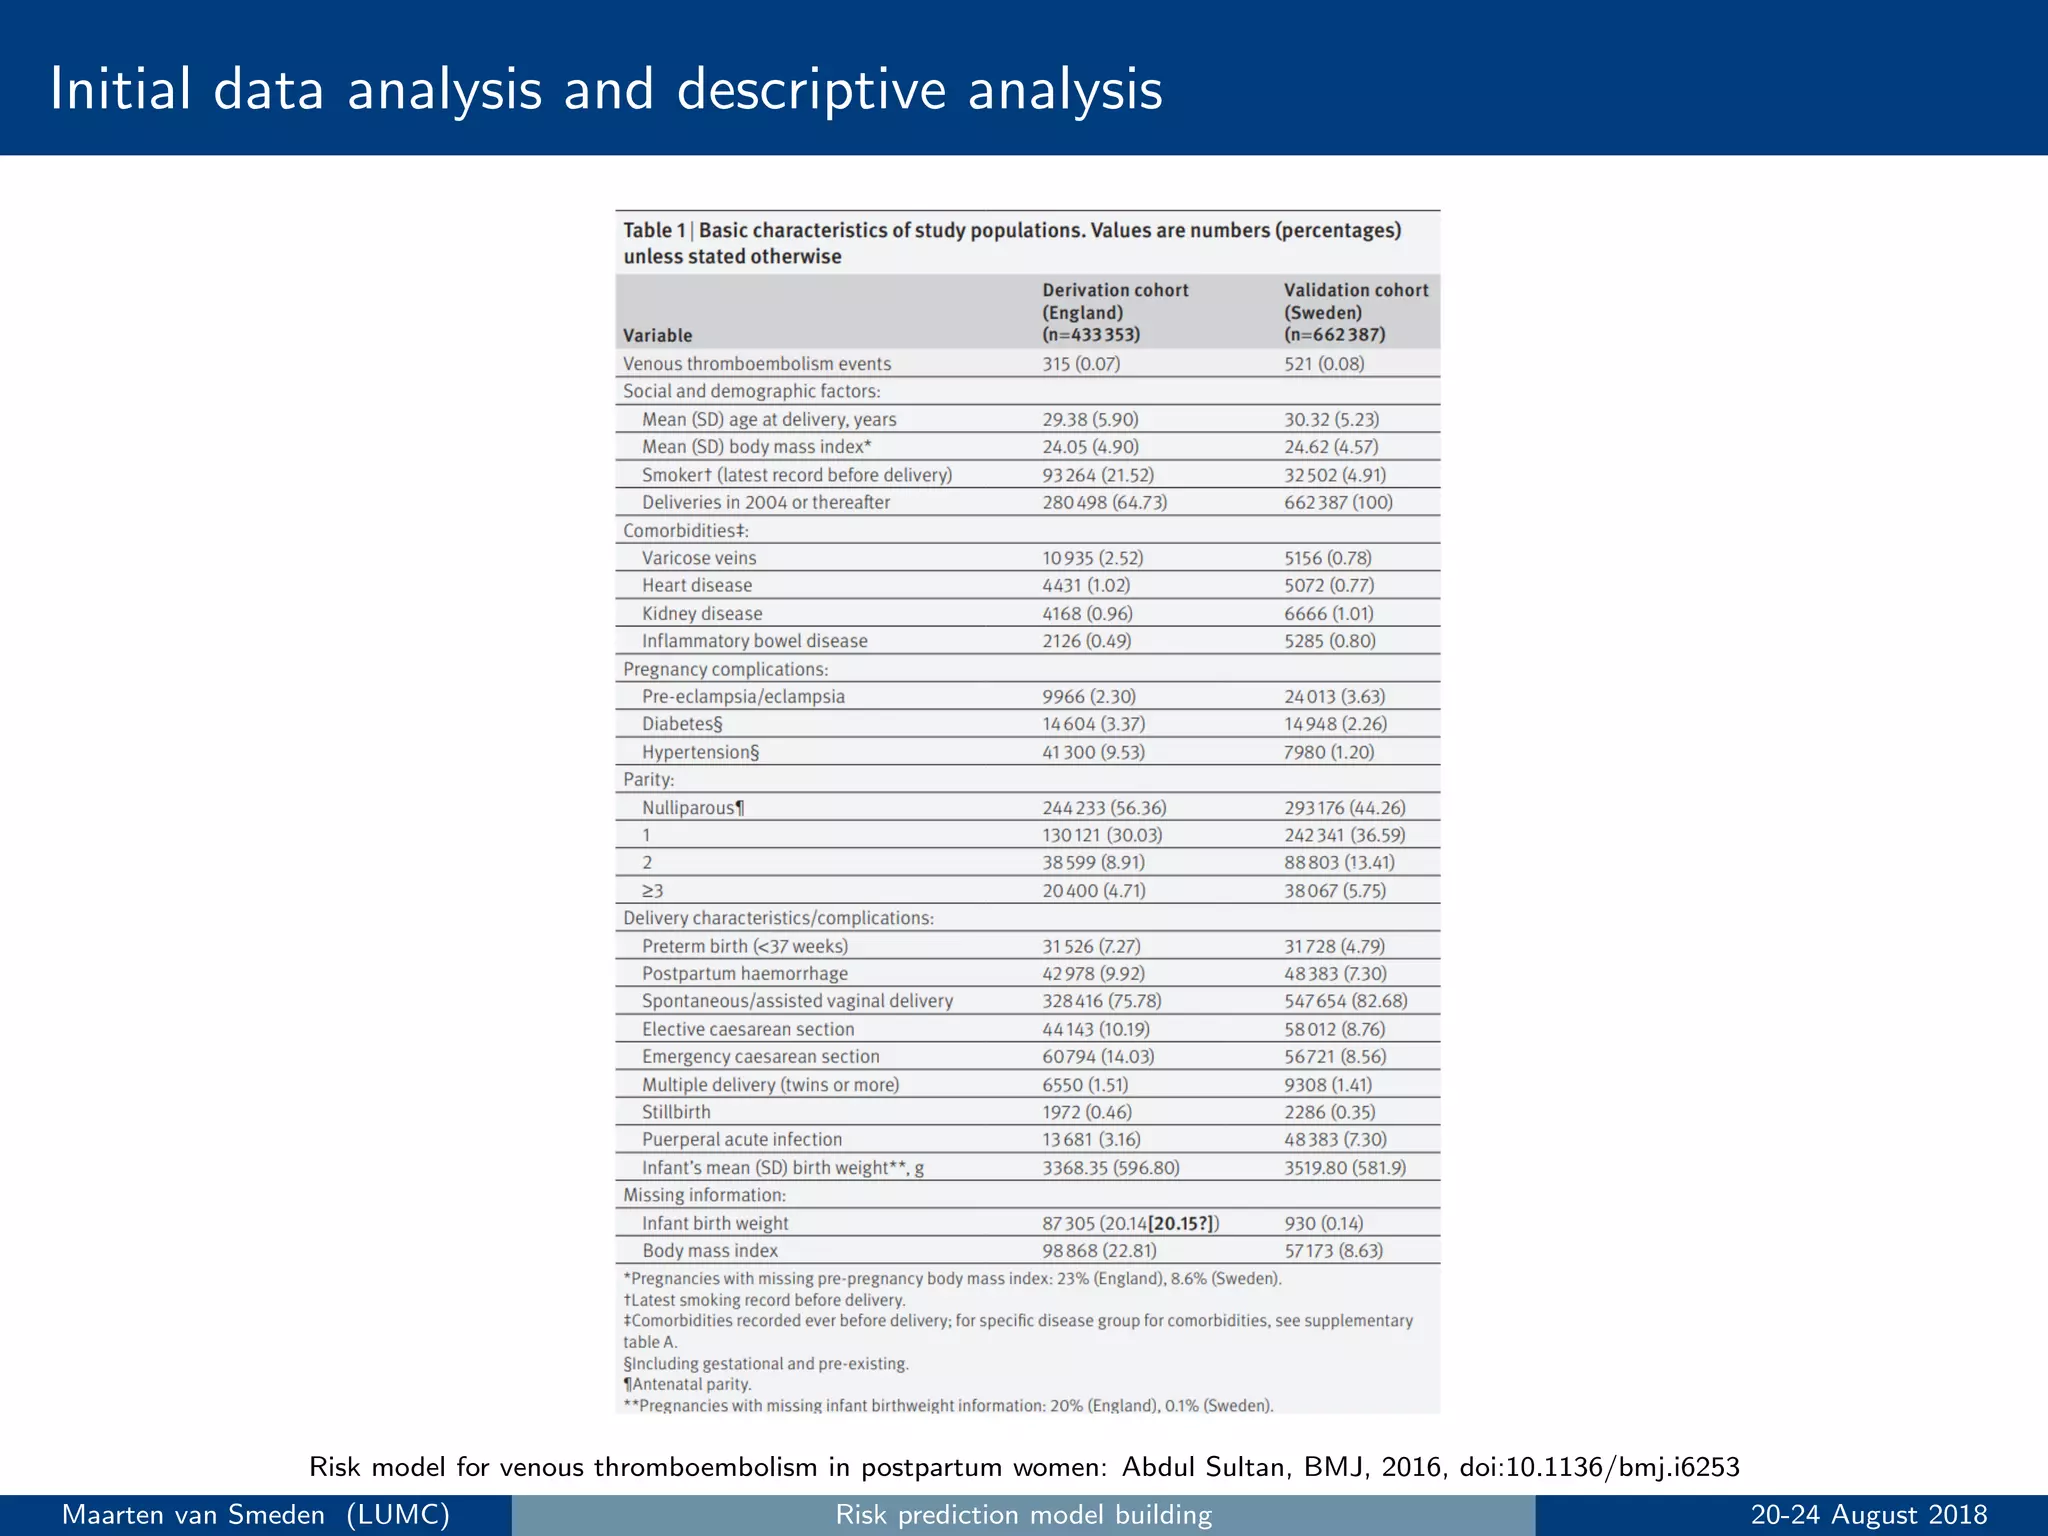
3. Perform initial data analysis including descriptive statistics and assessing predictors.
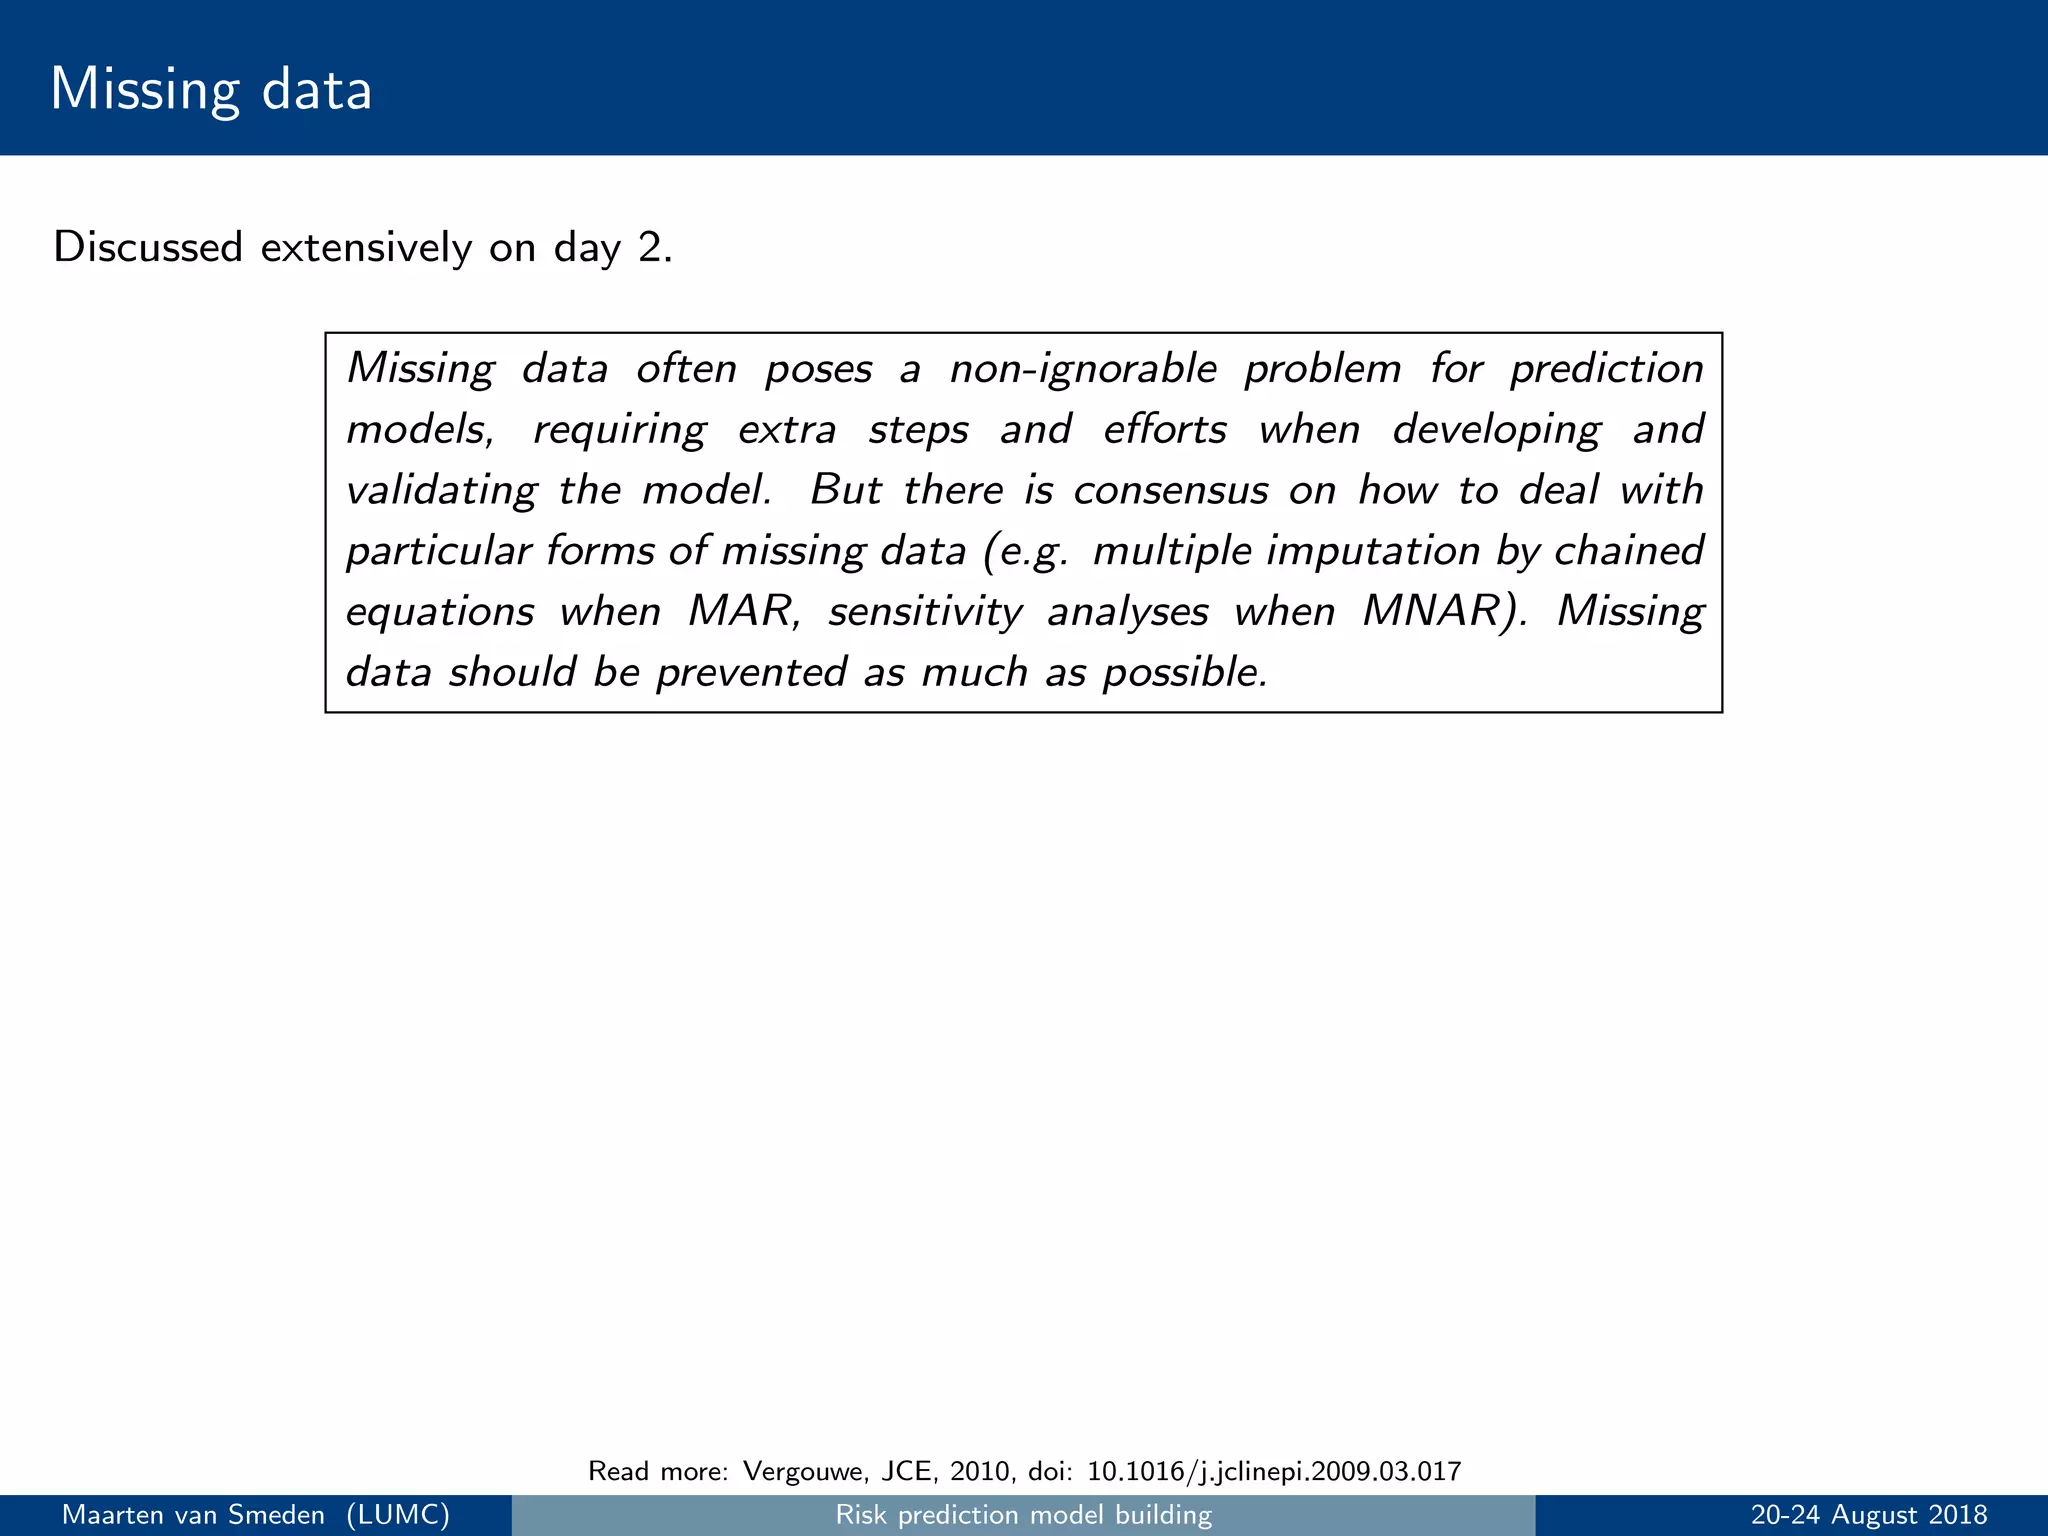
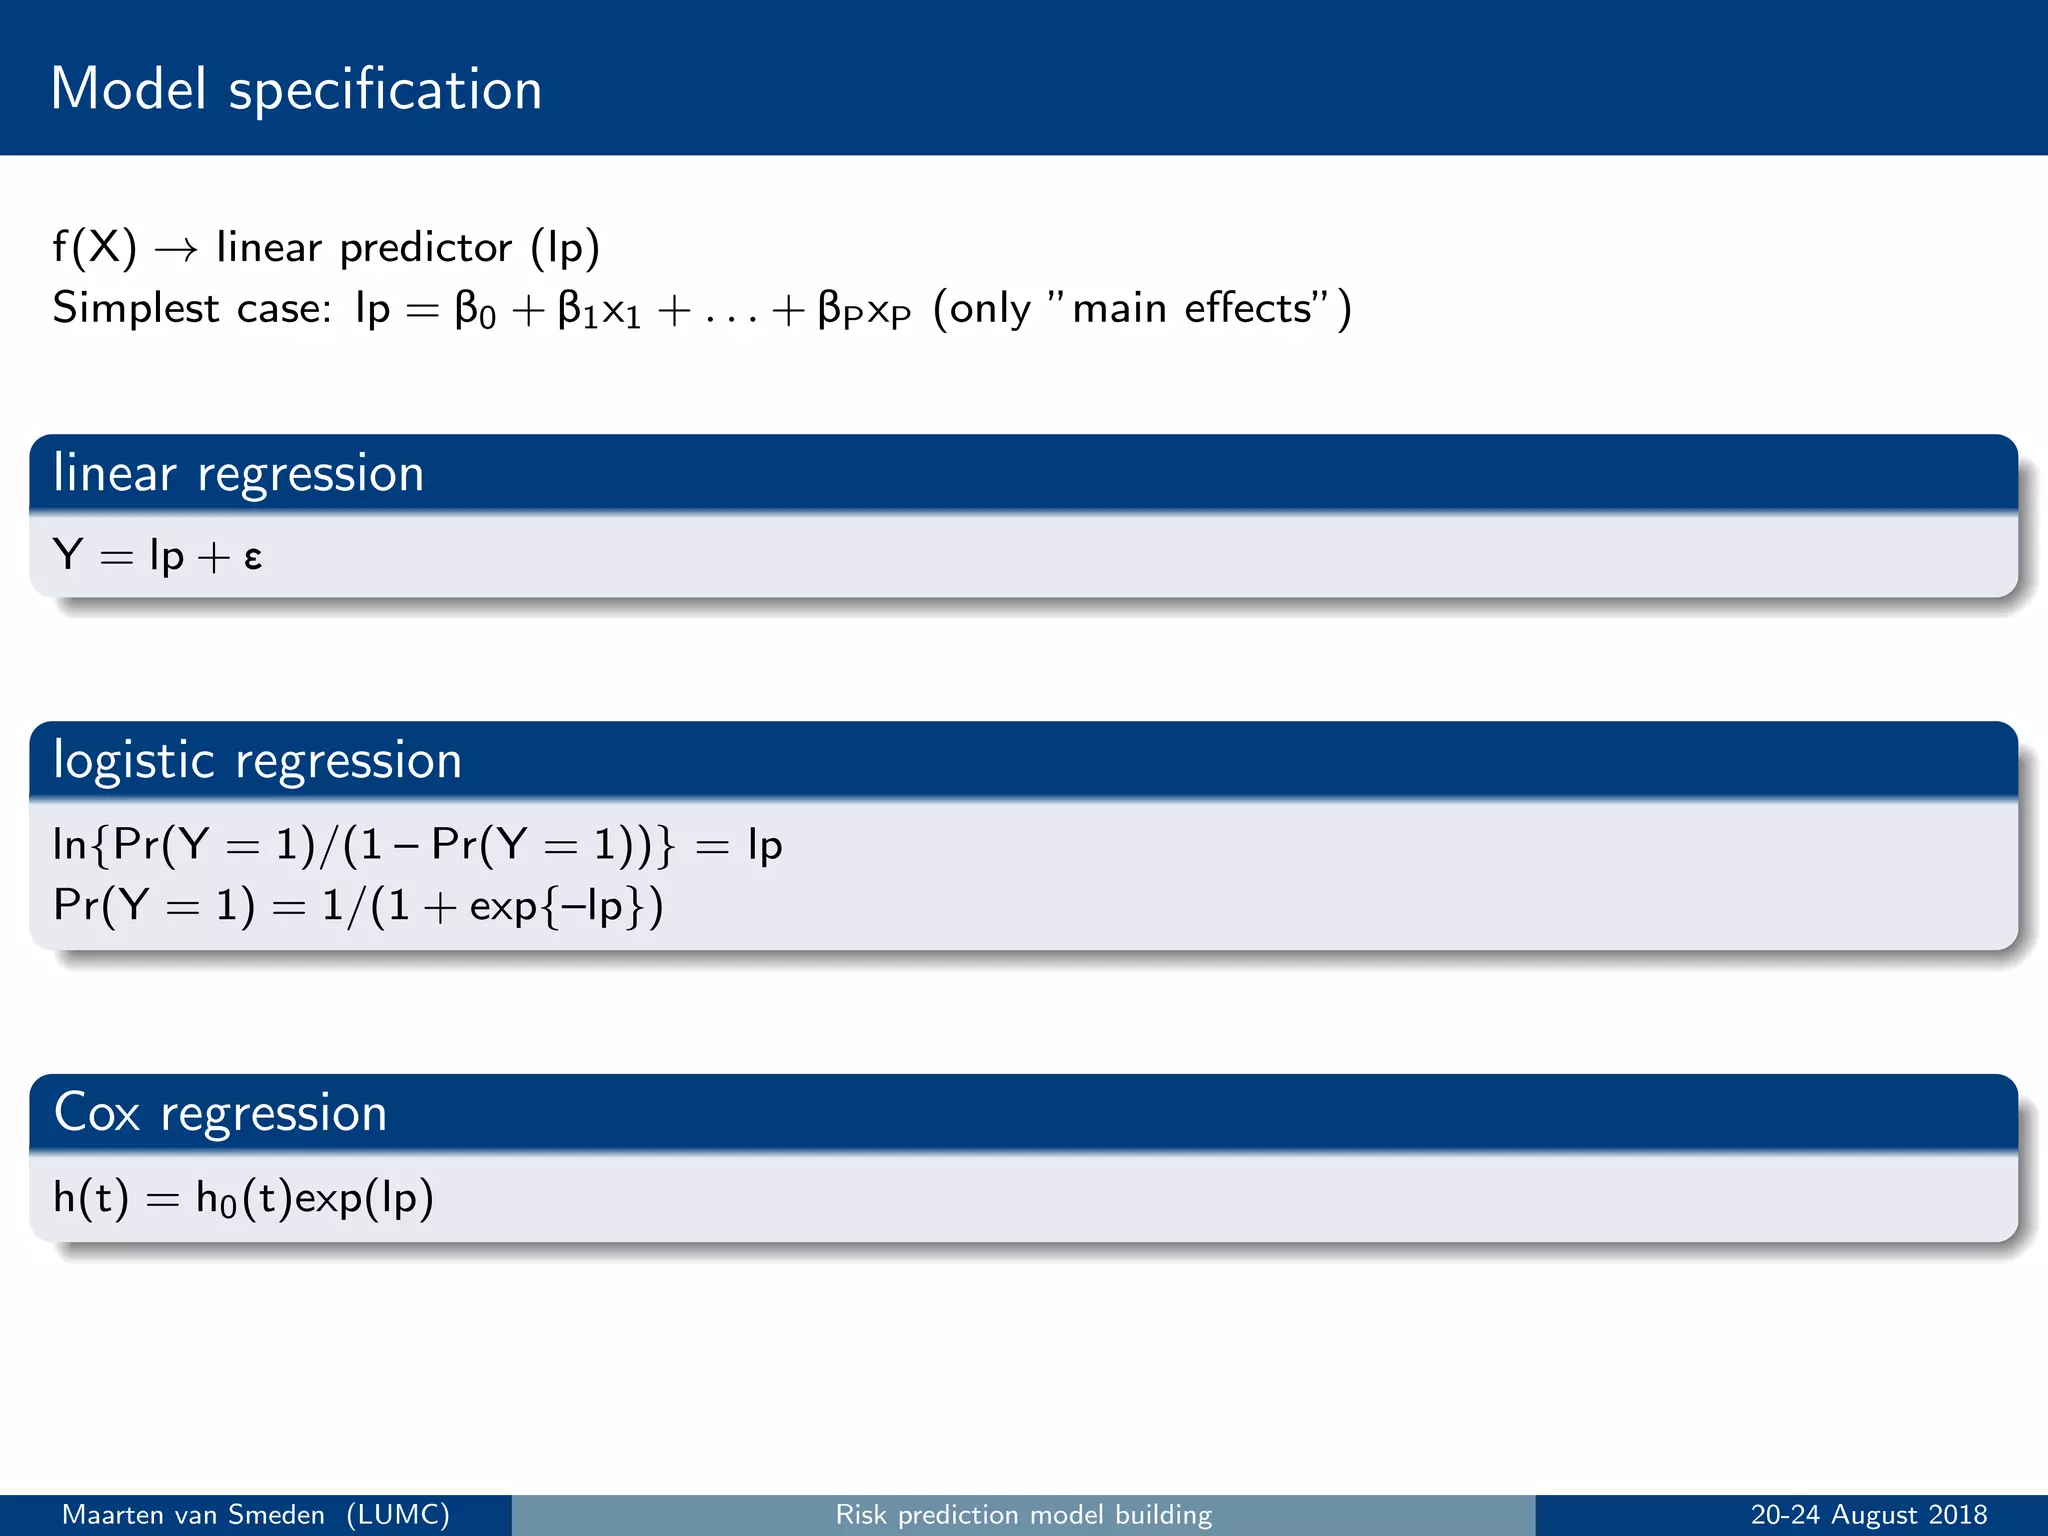
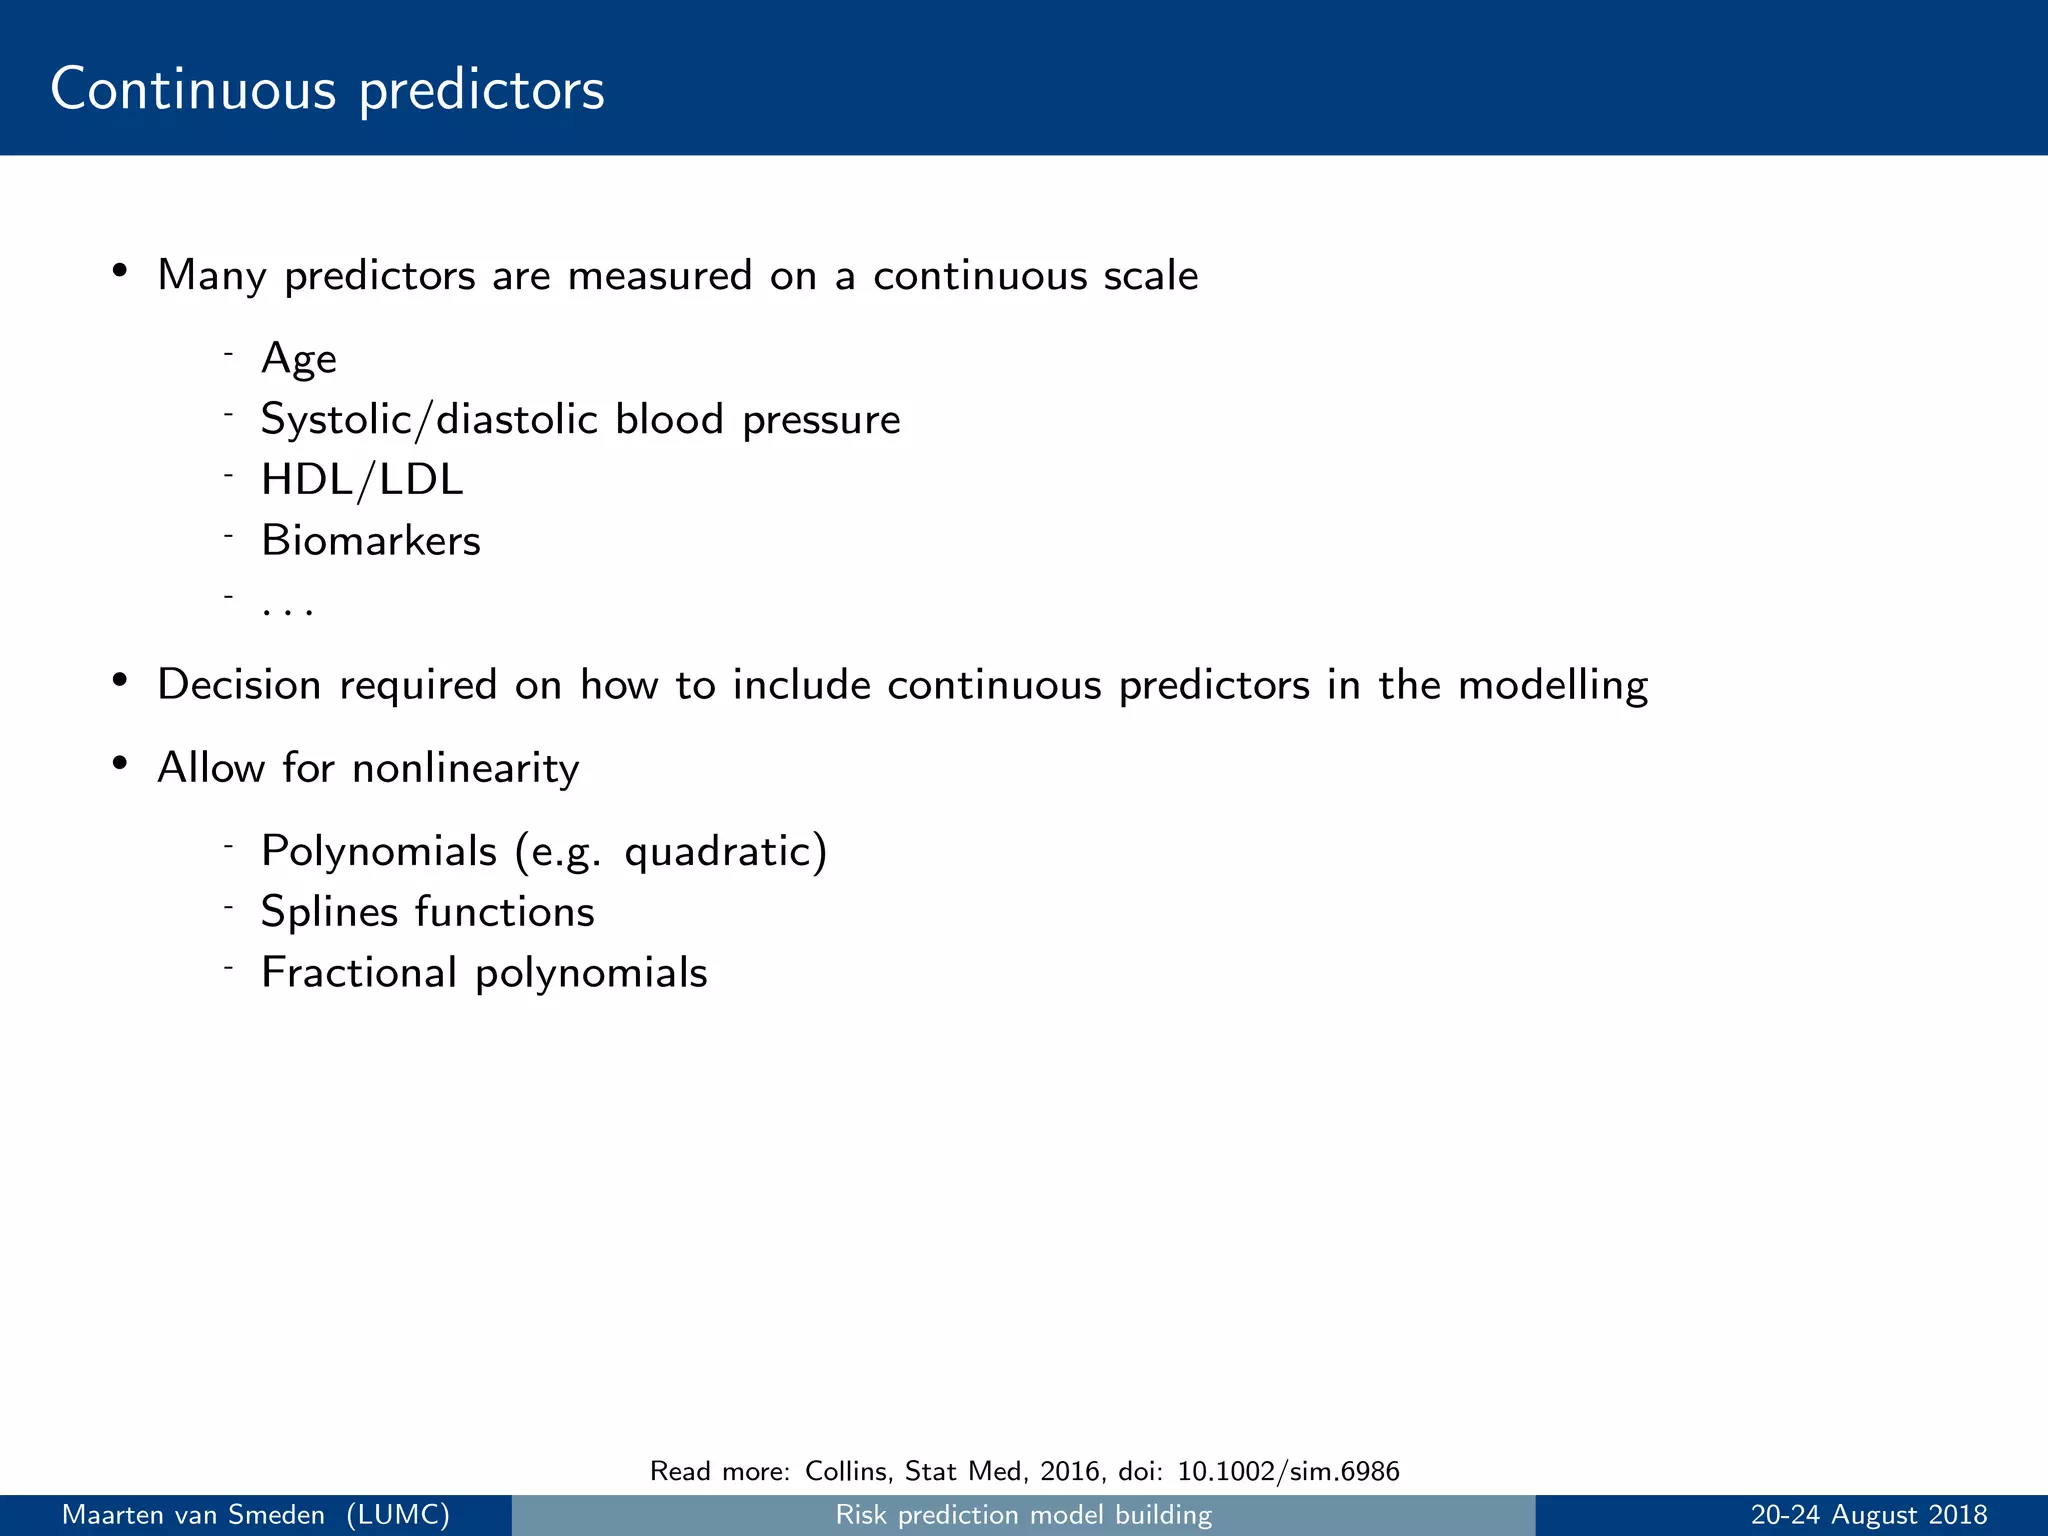
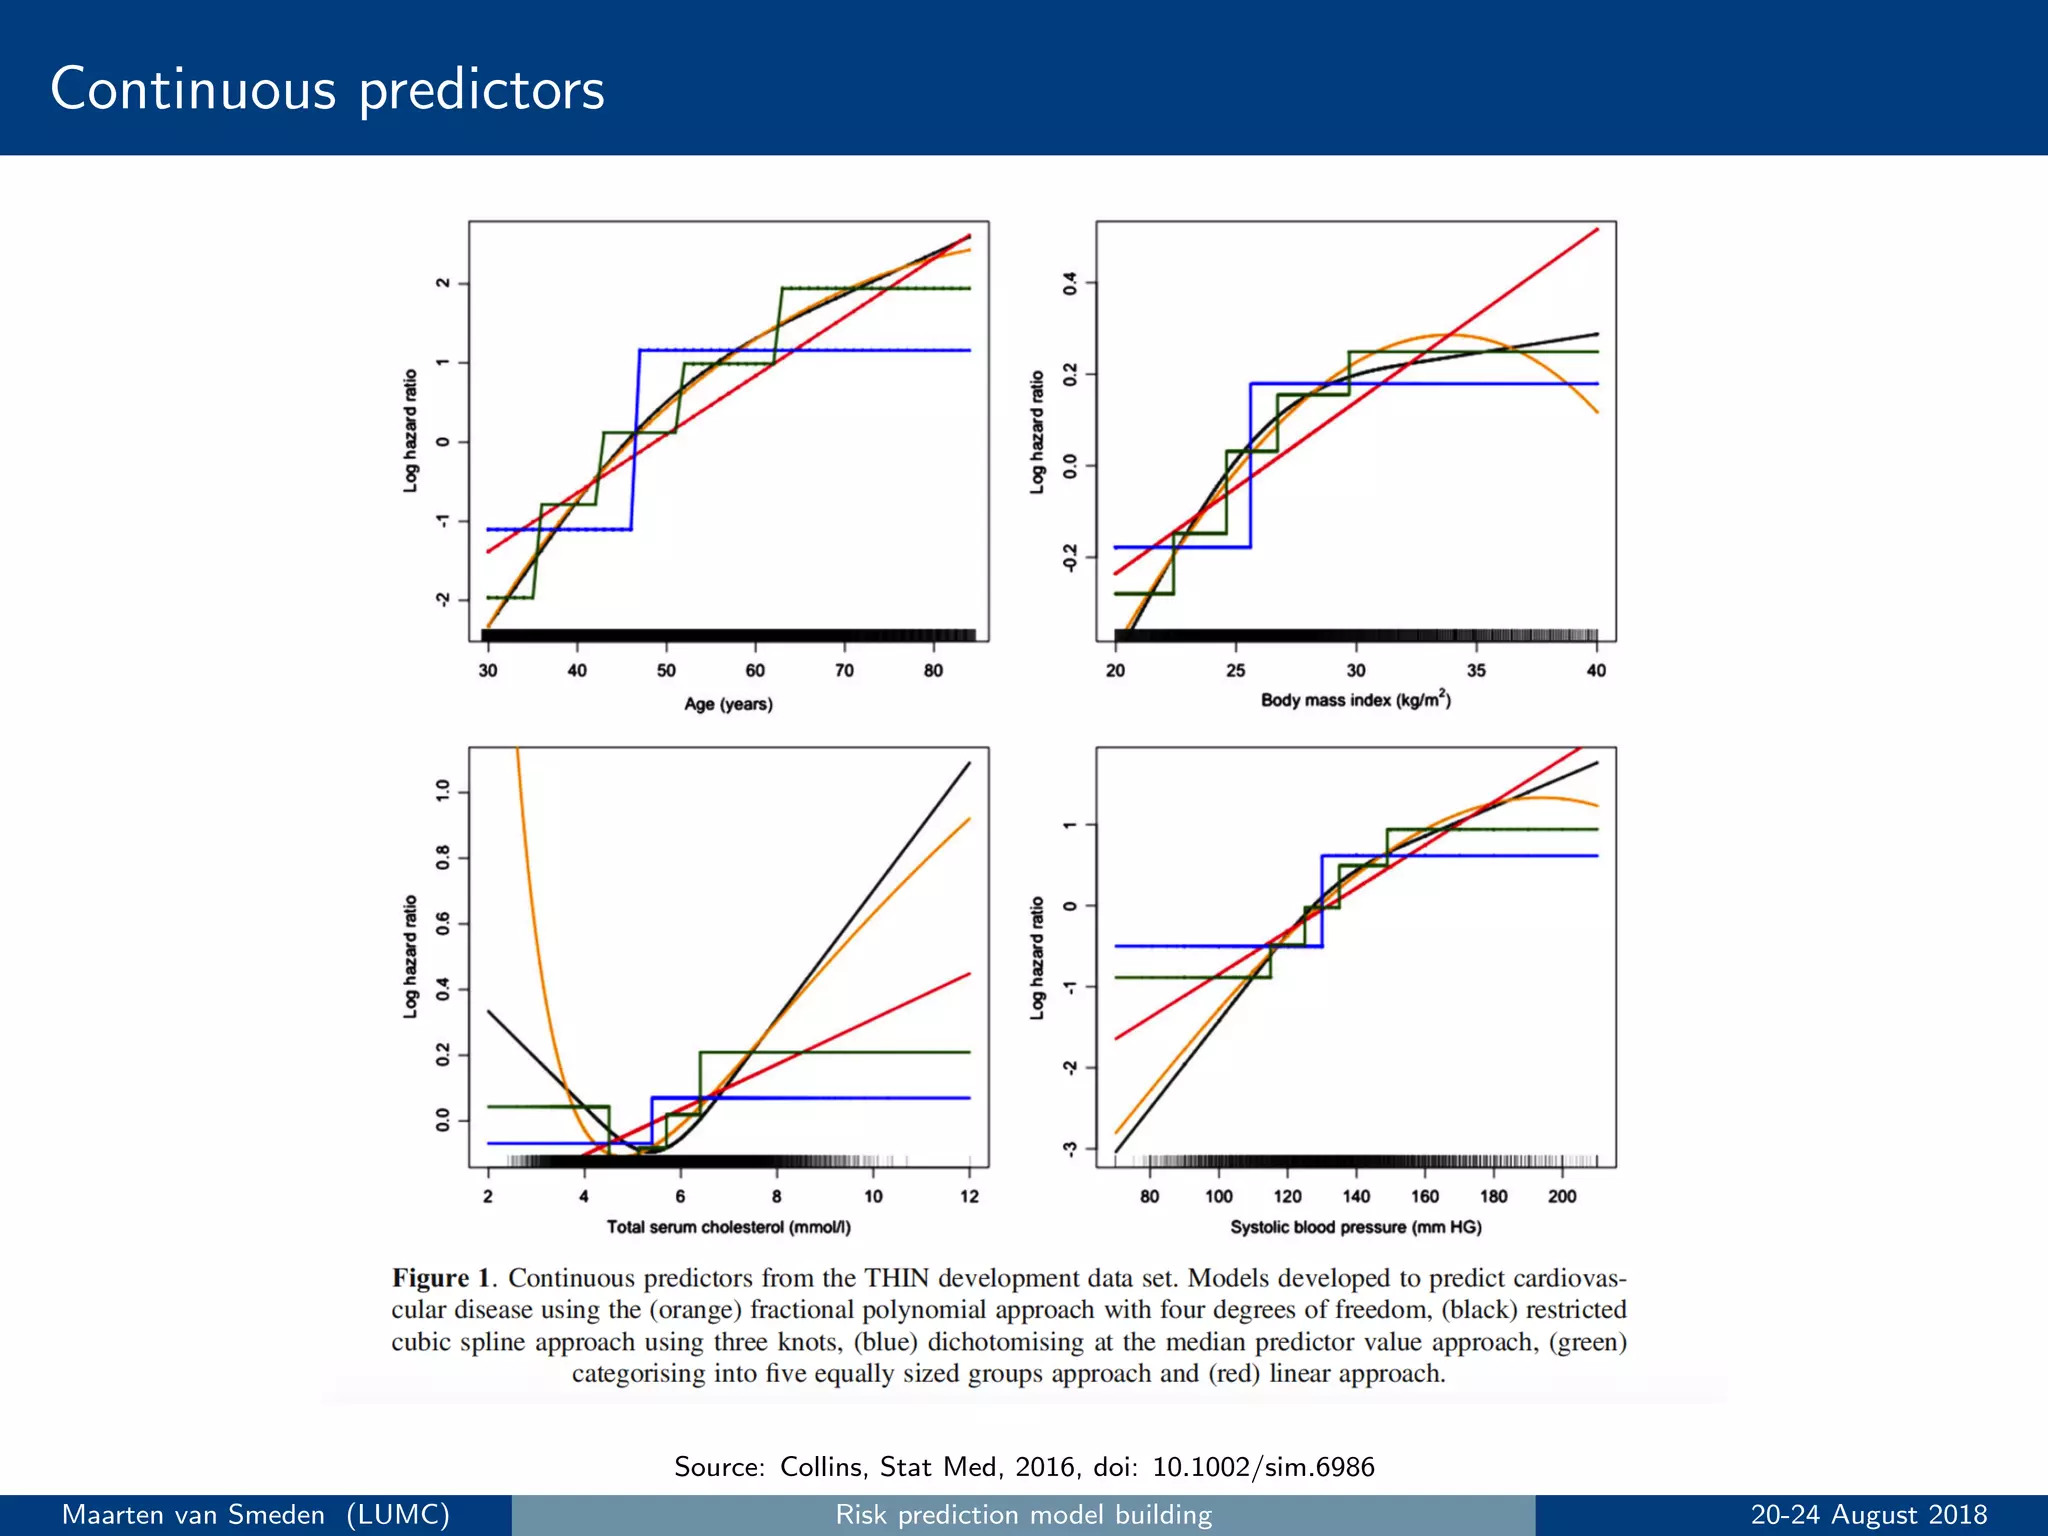
4. Specify and estimate the prediction model, addressing issues like handling continuous predictors and missing data.
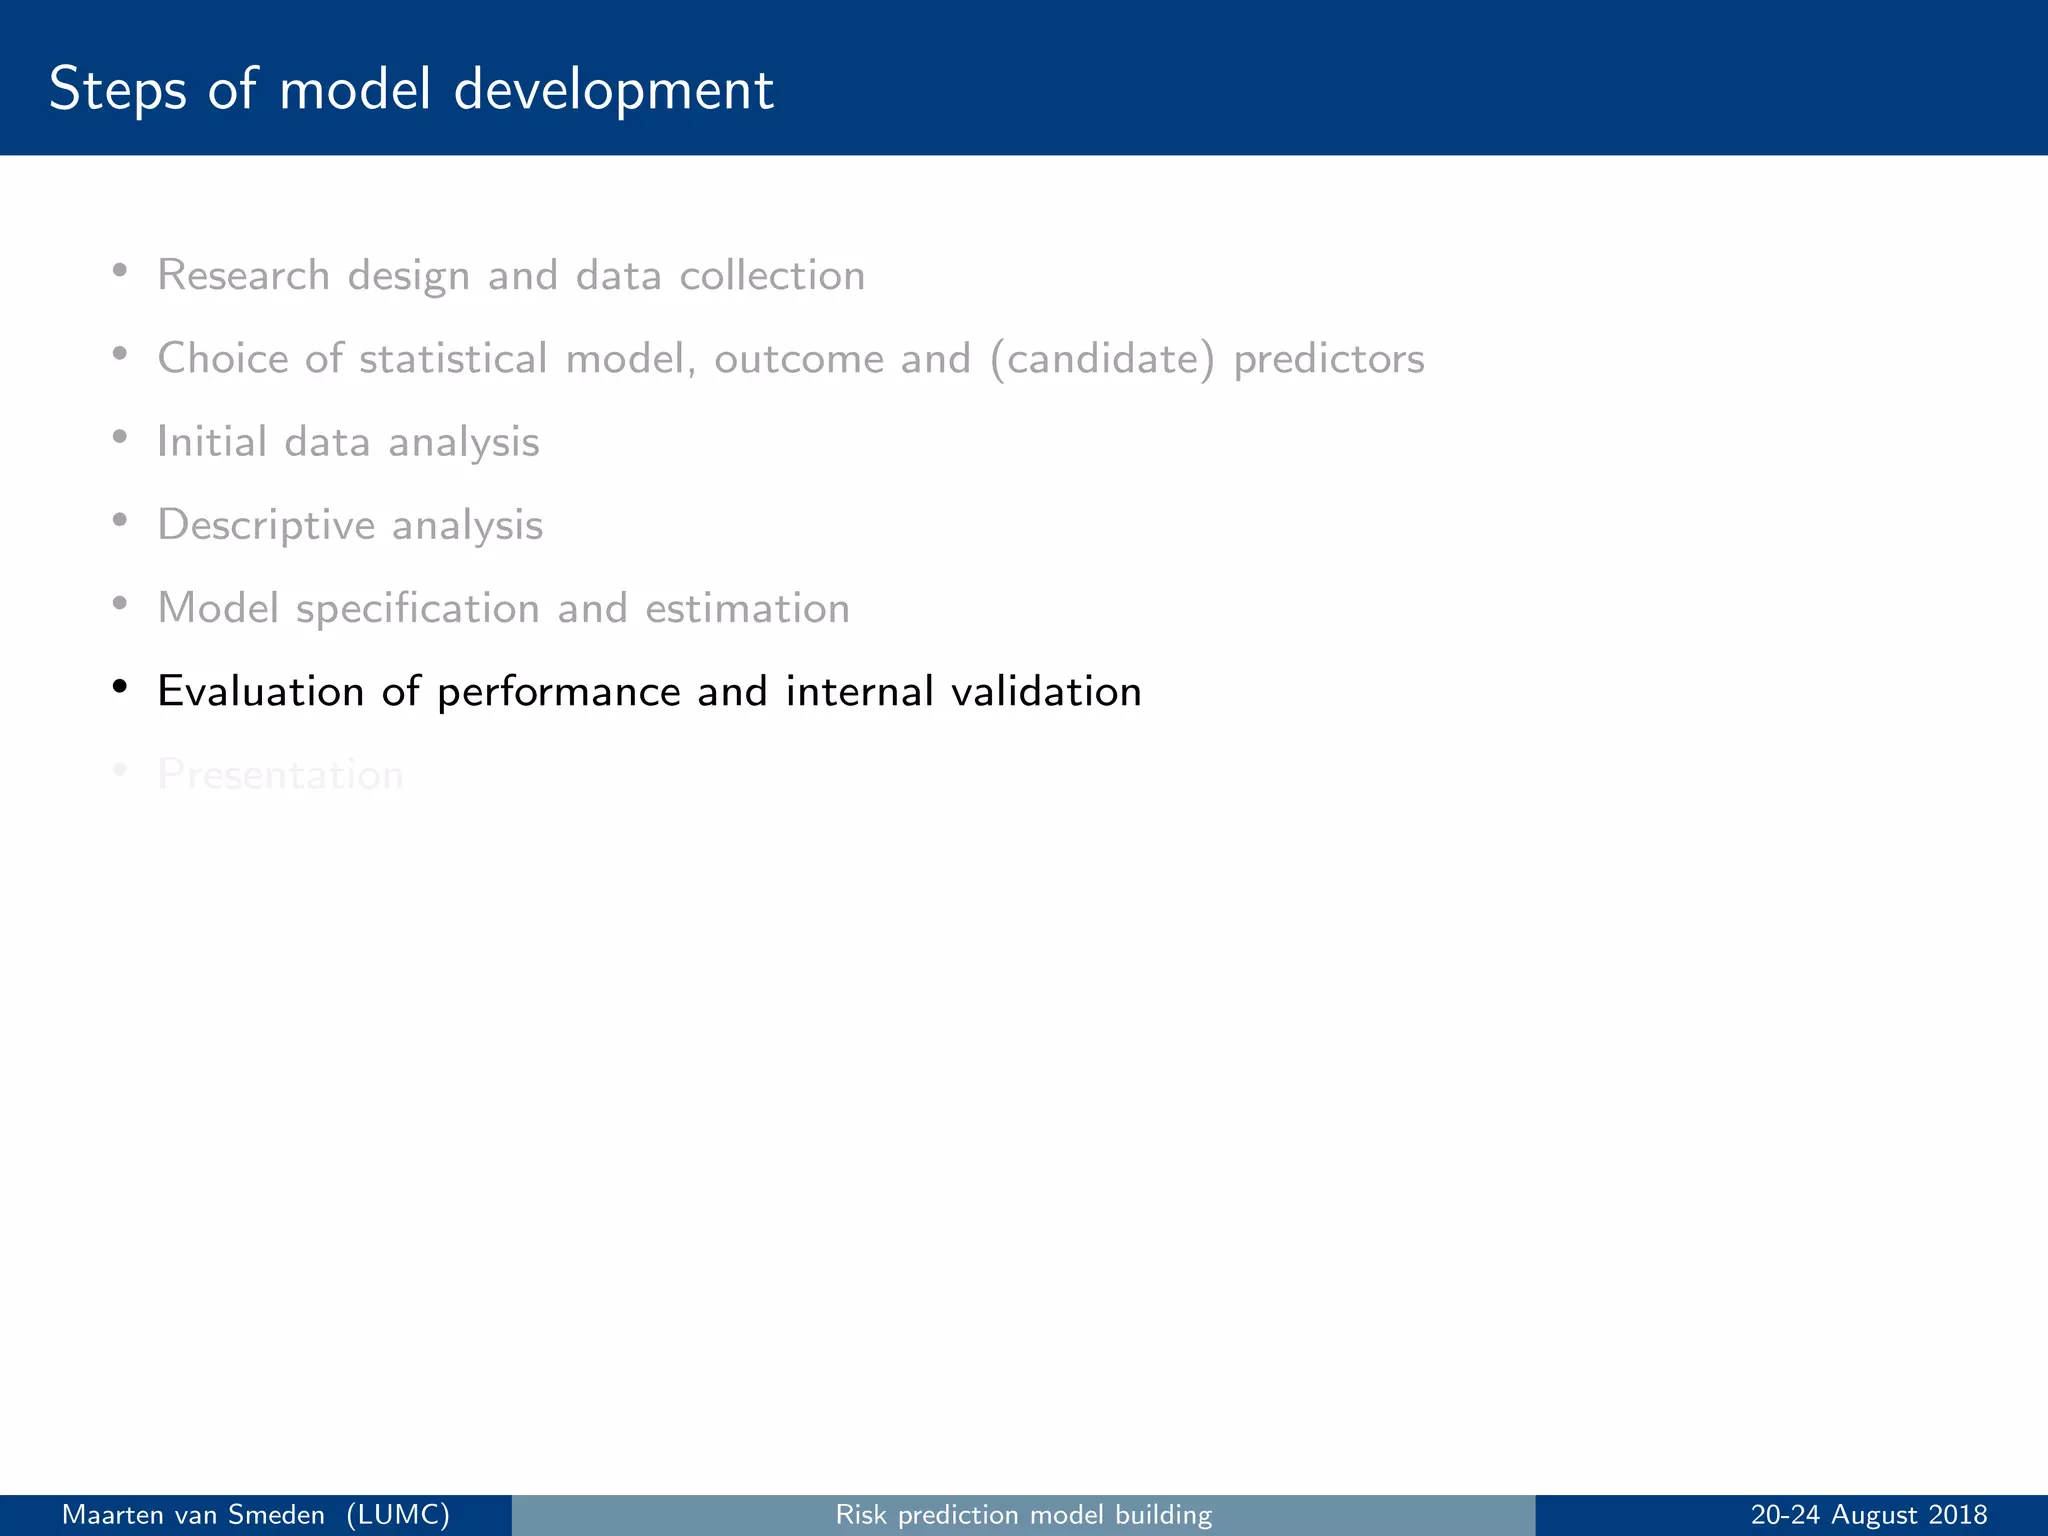
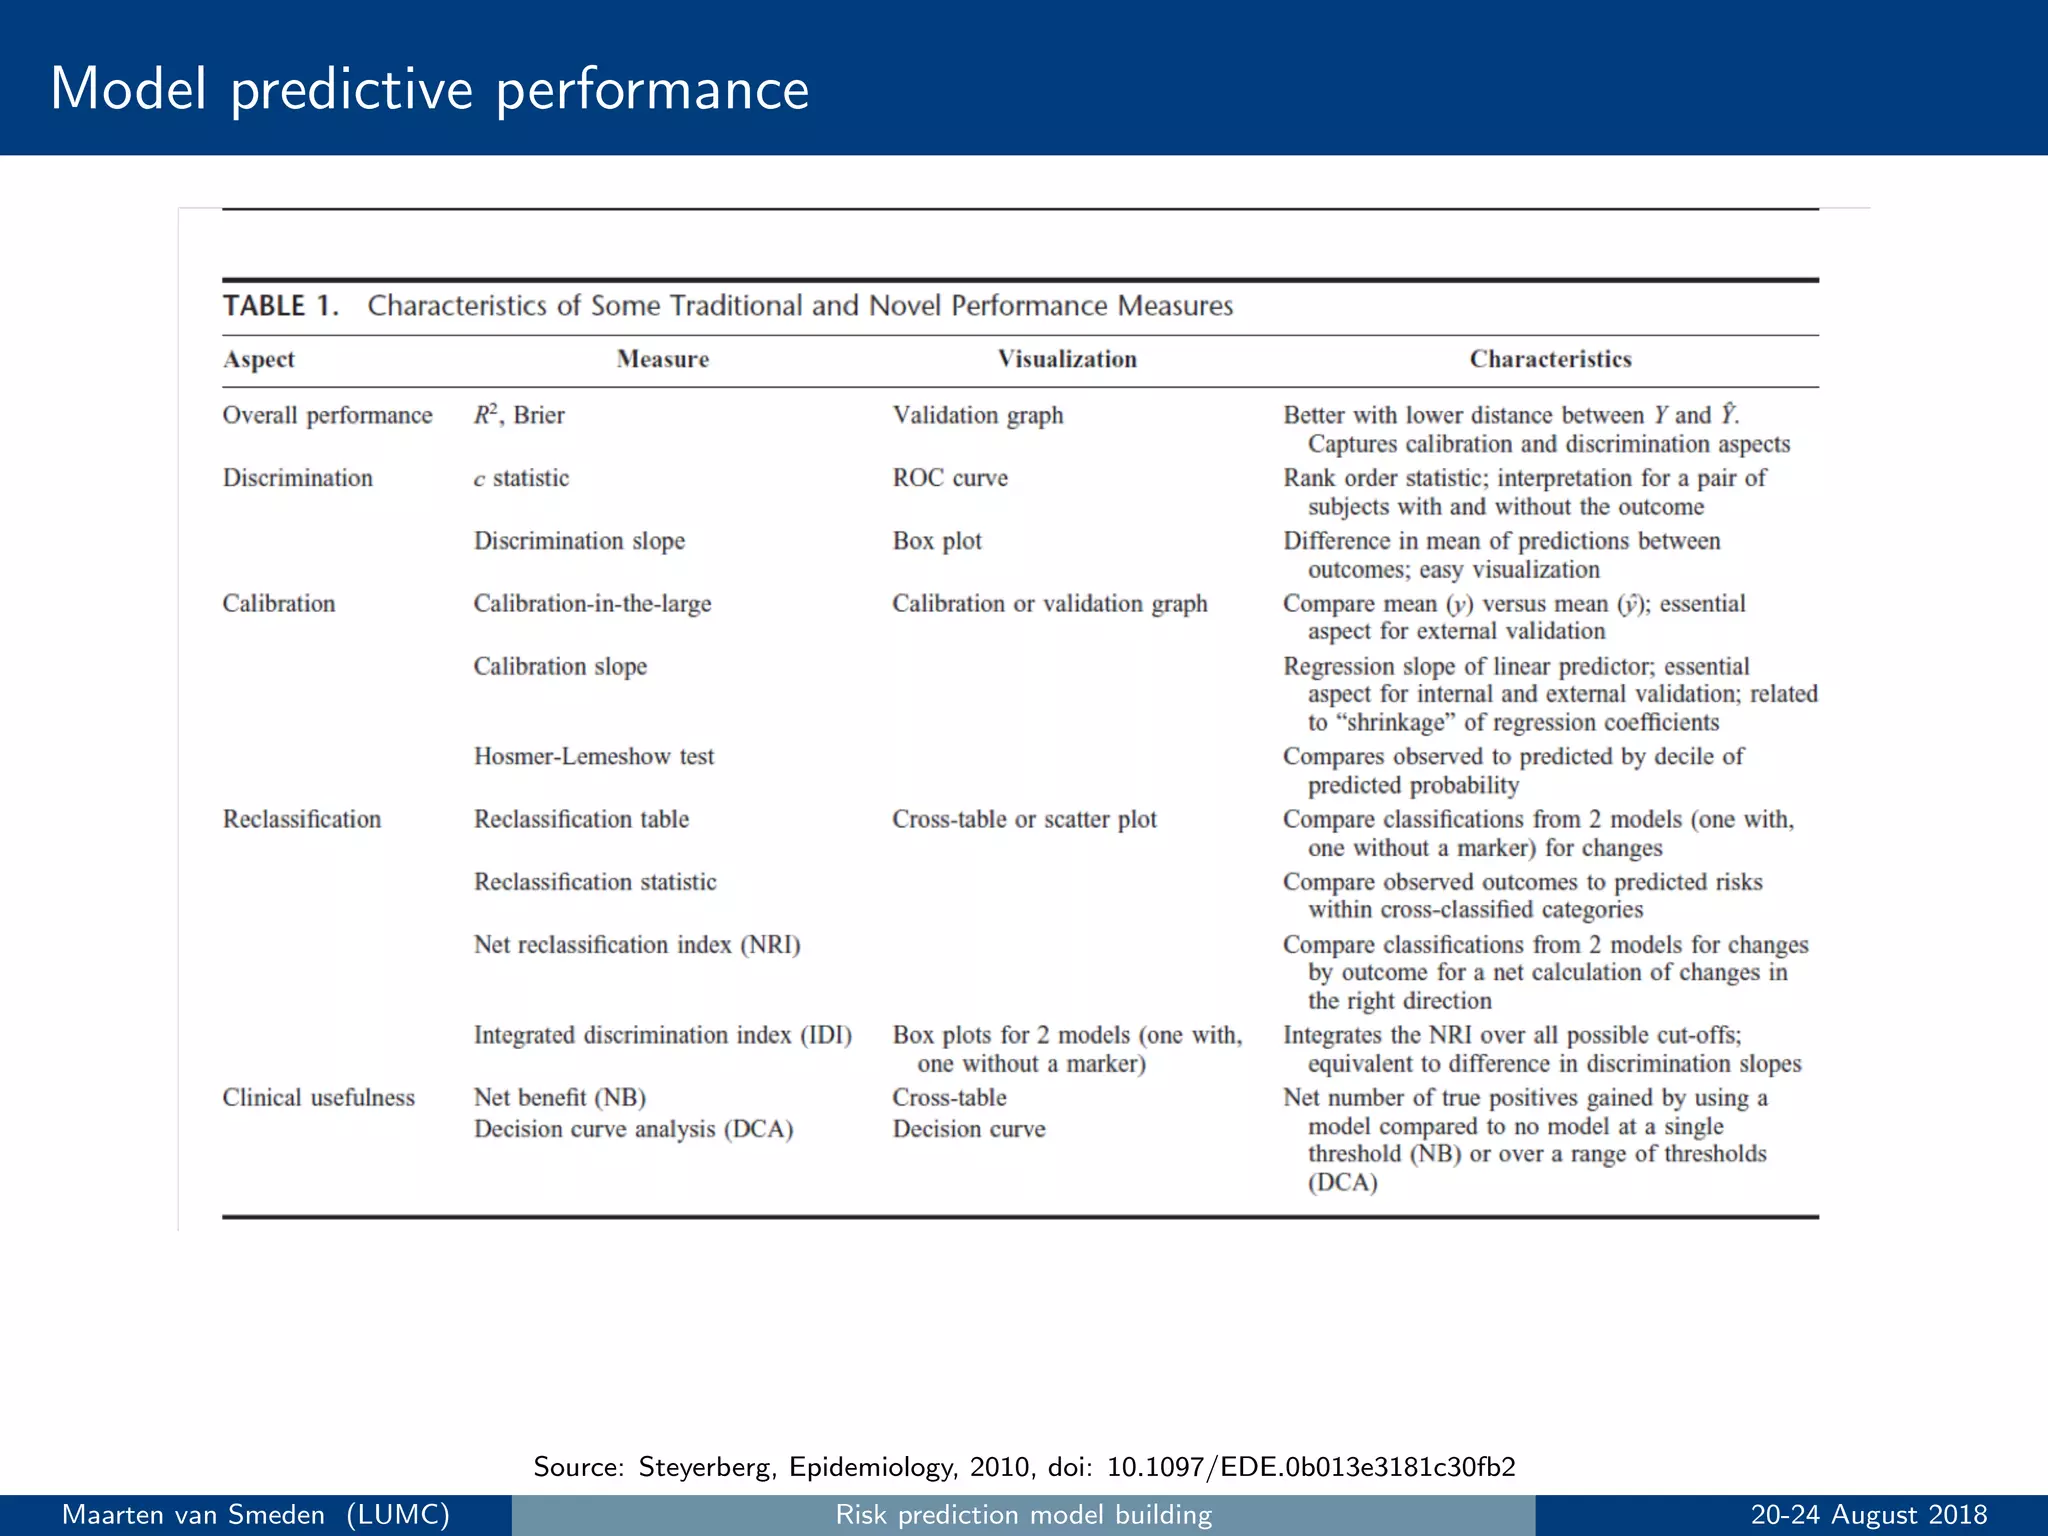
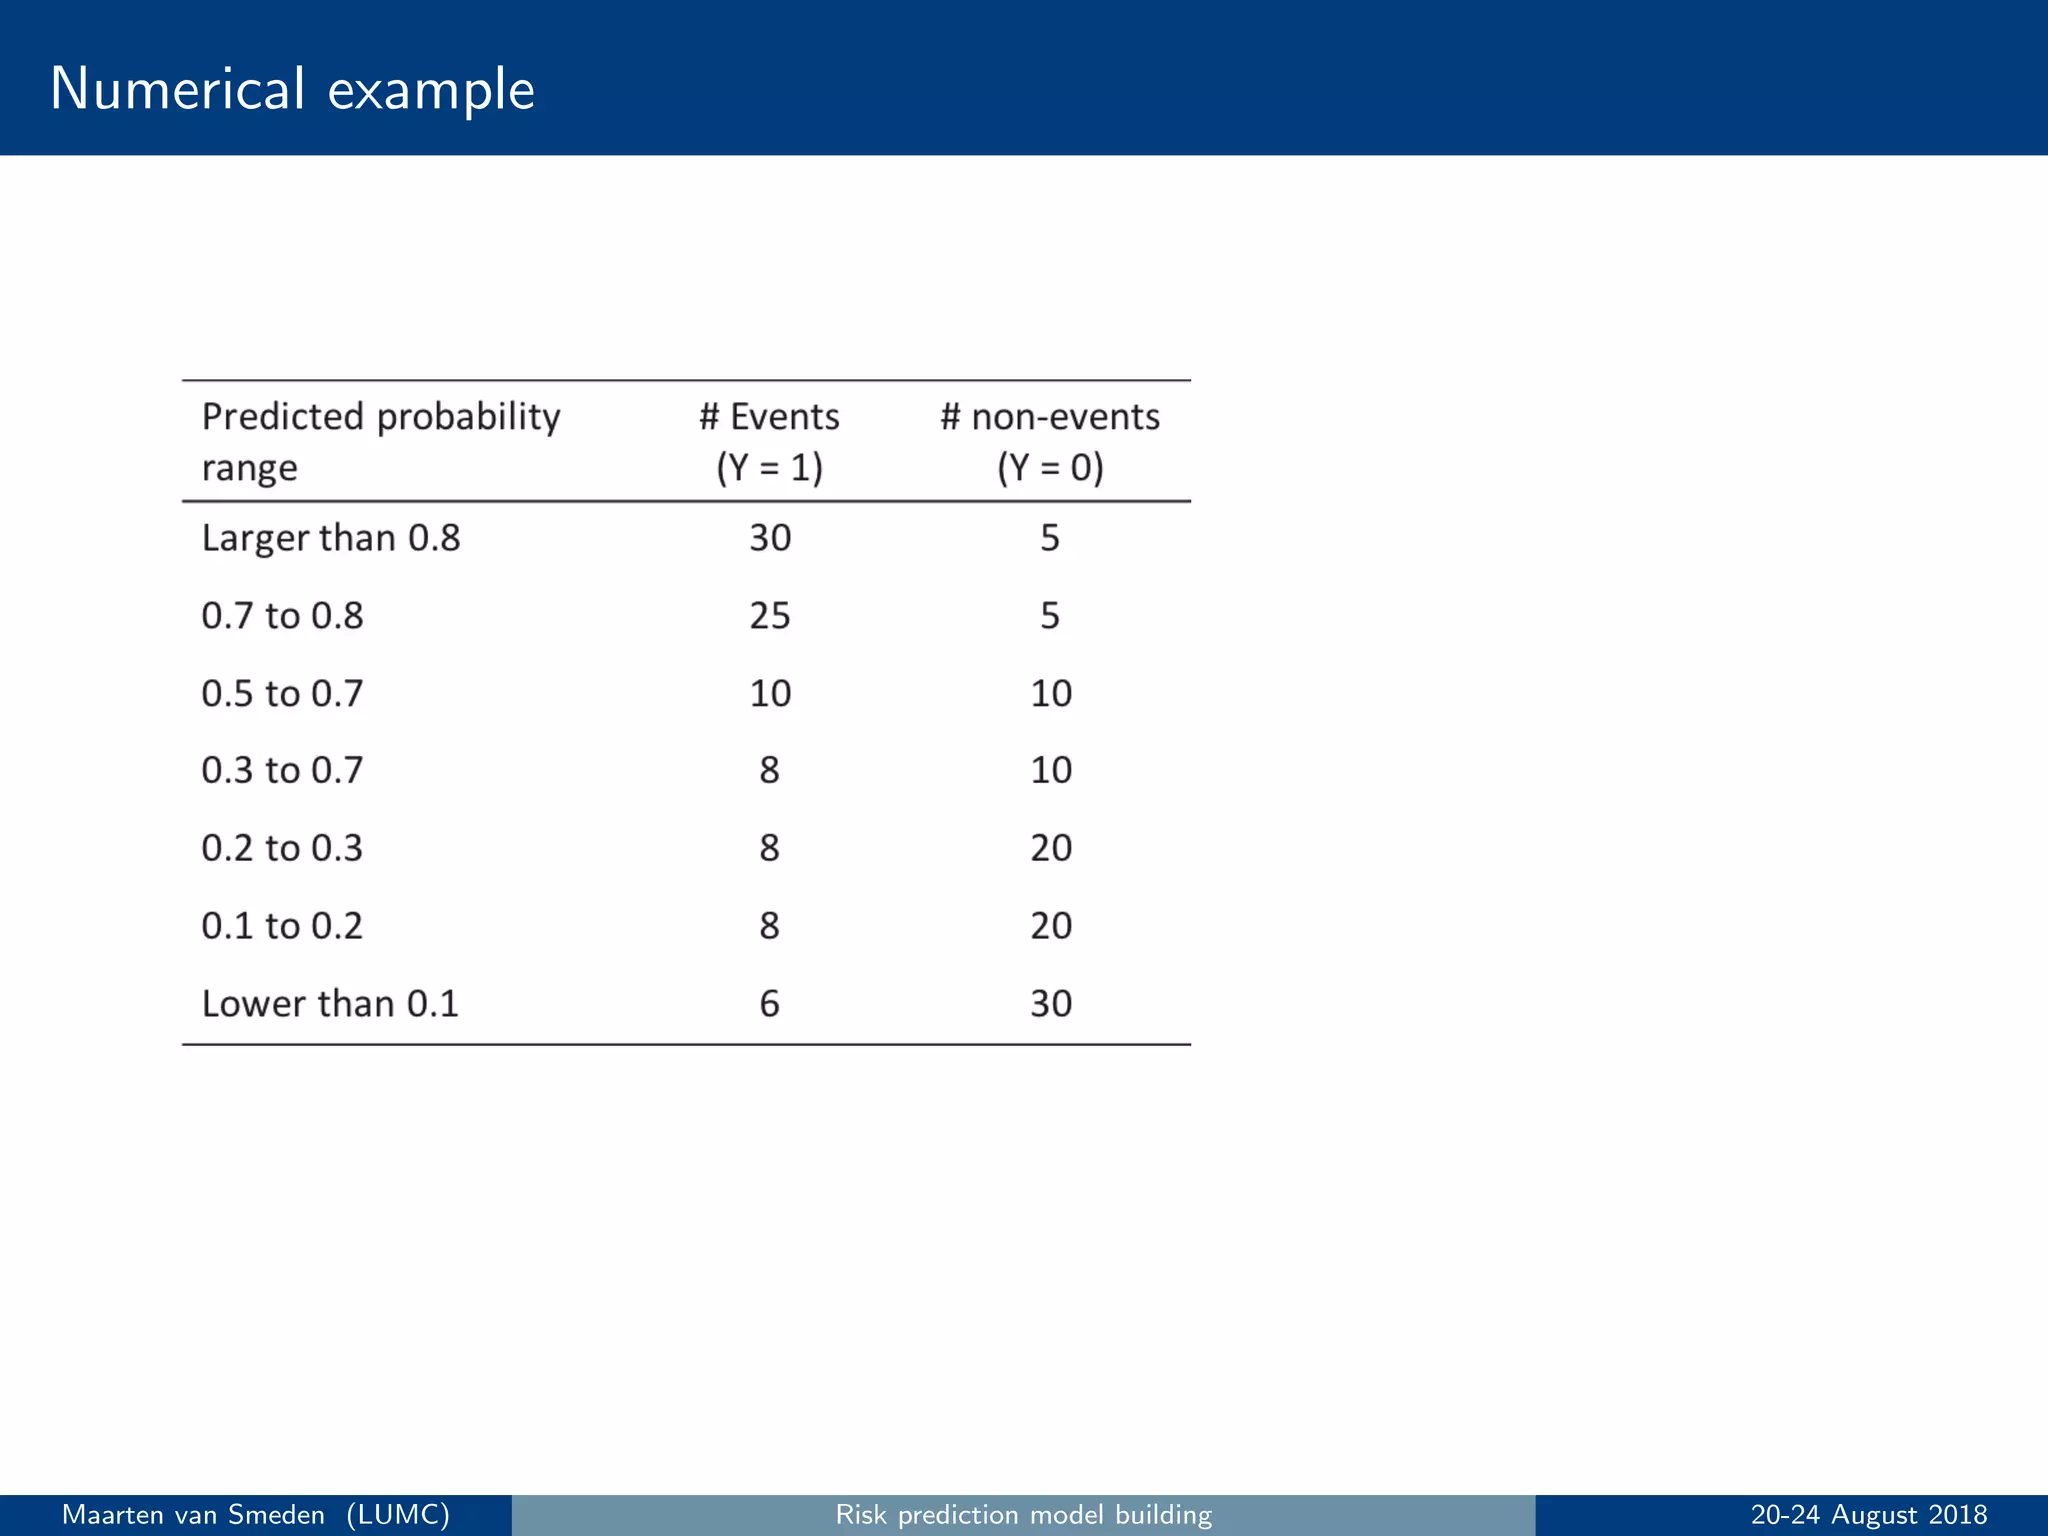
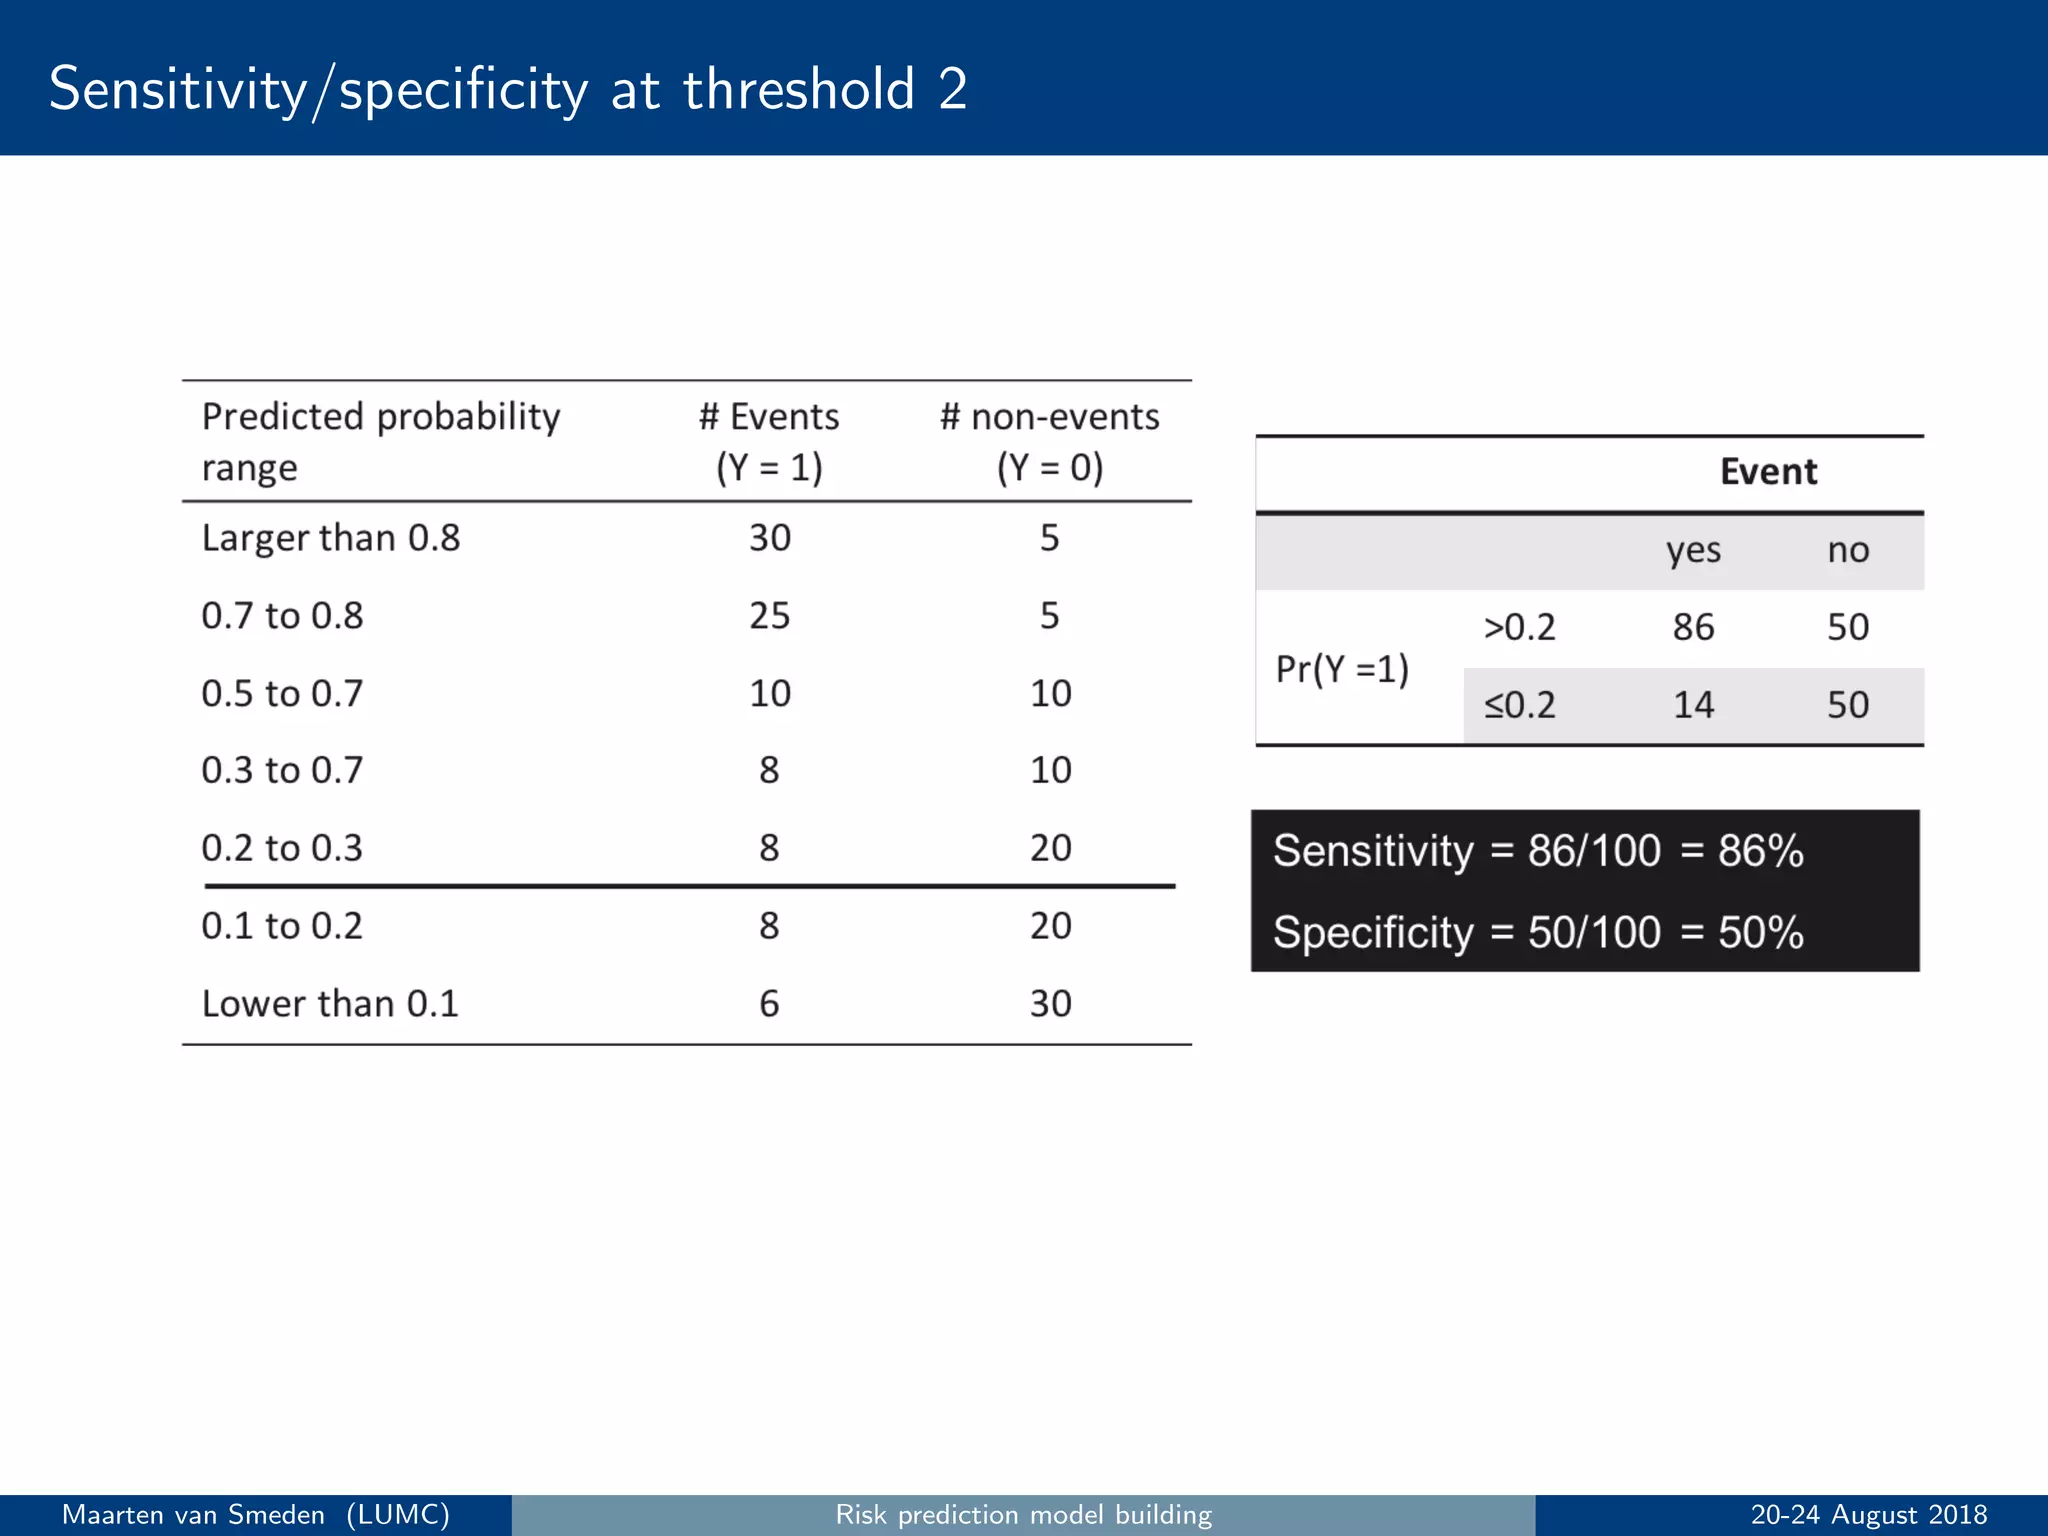
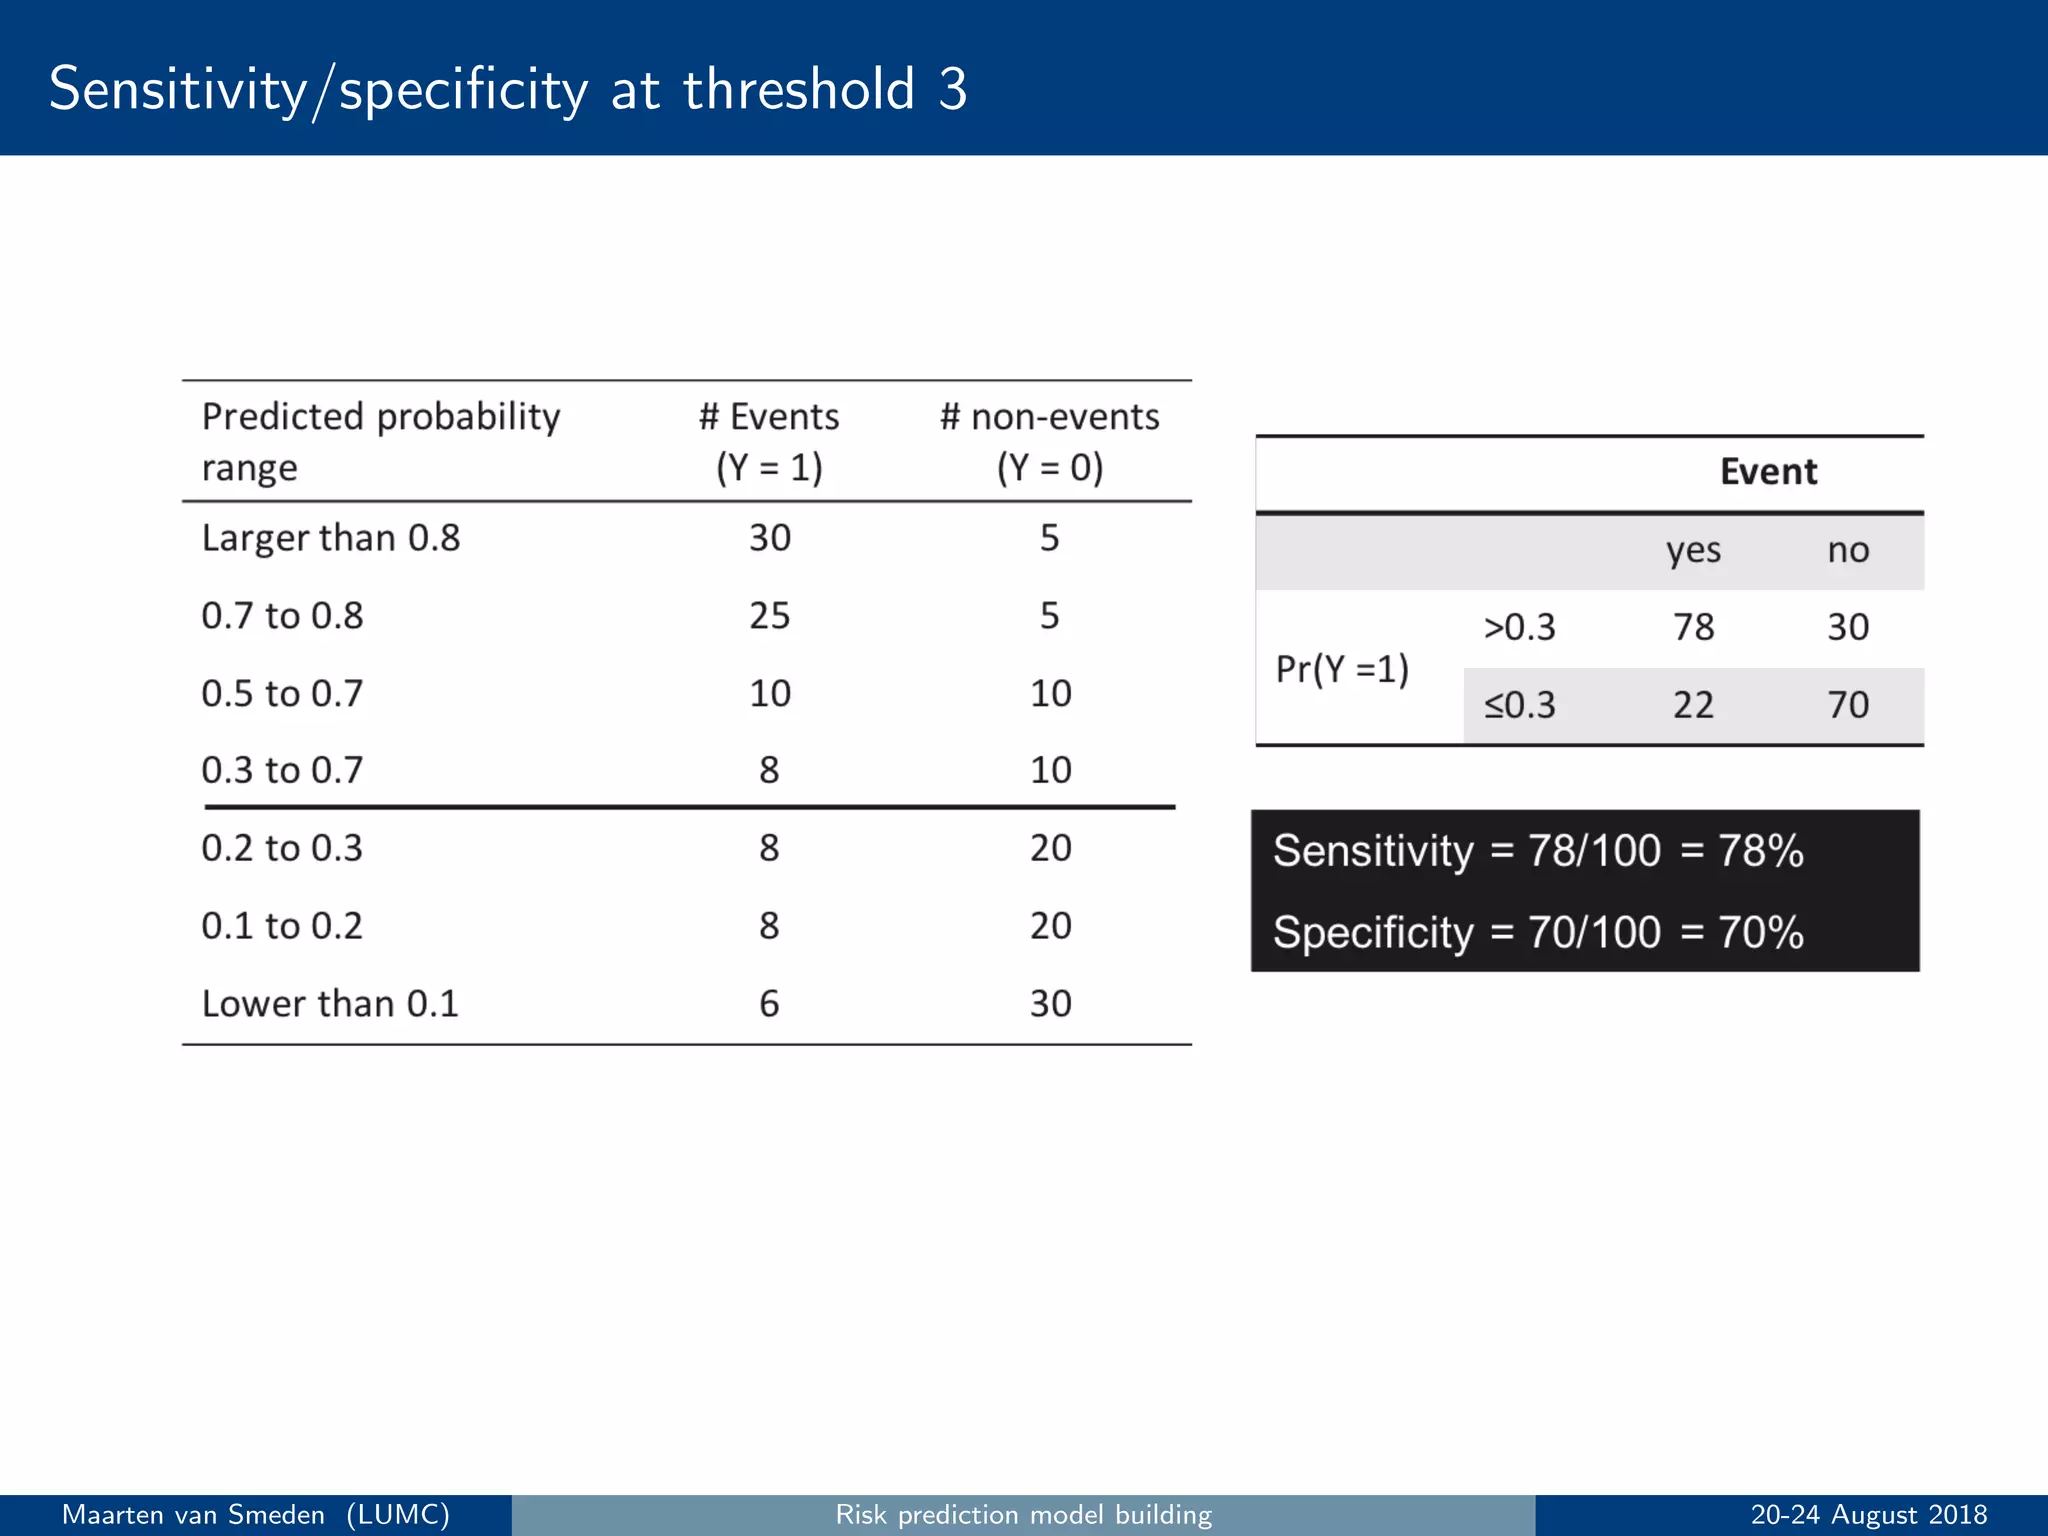
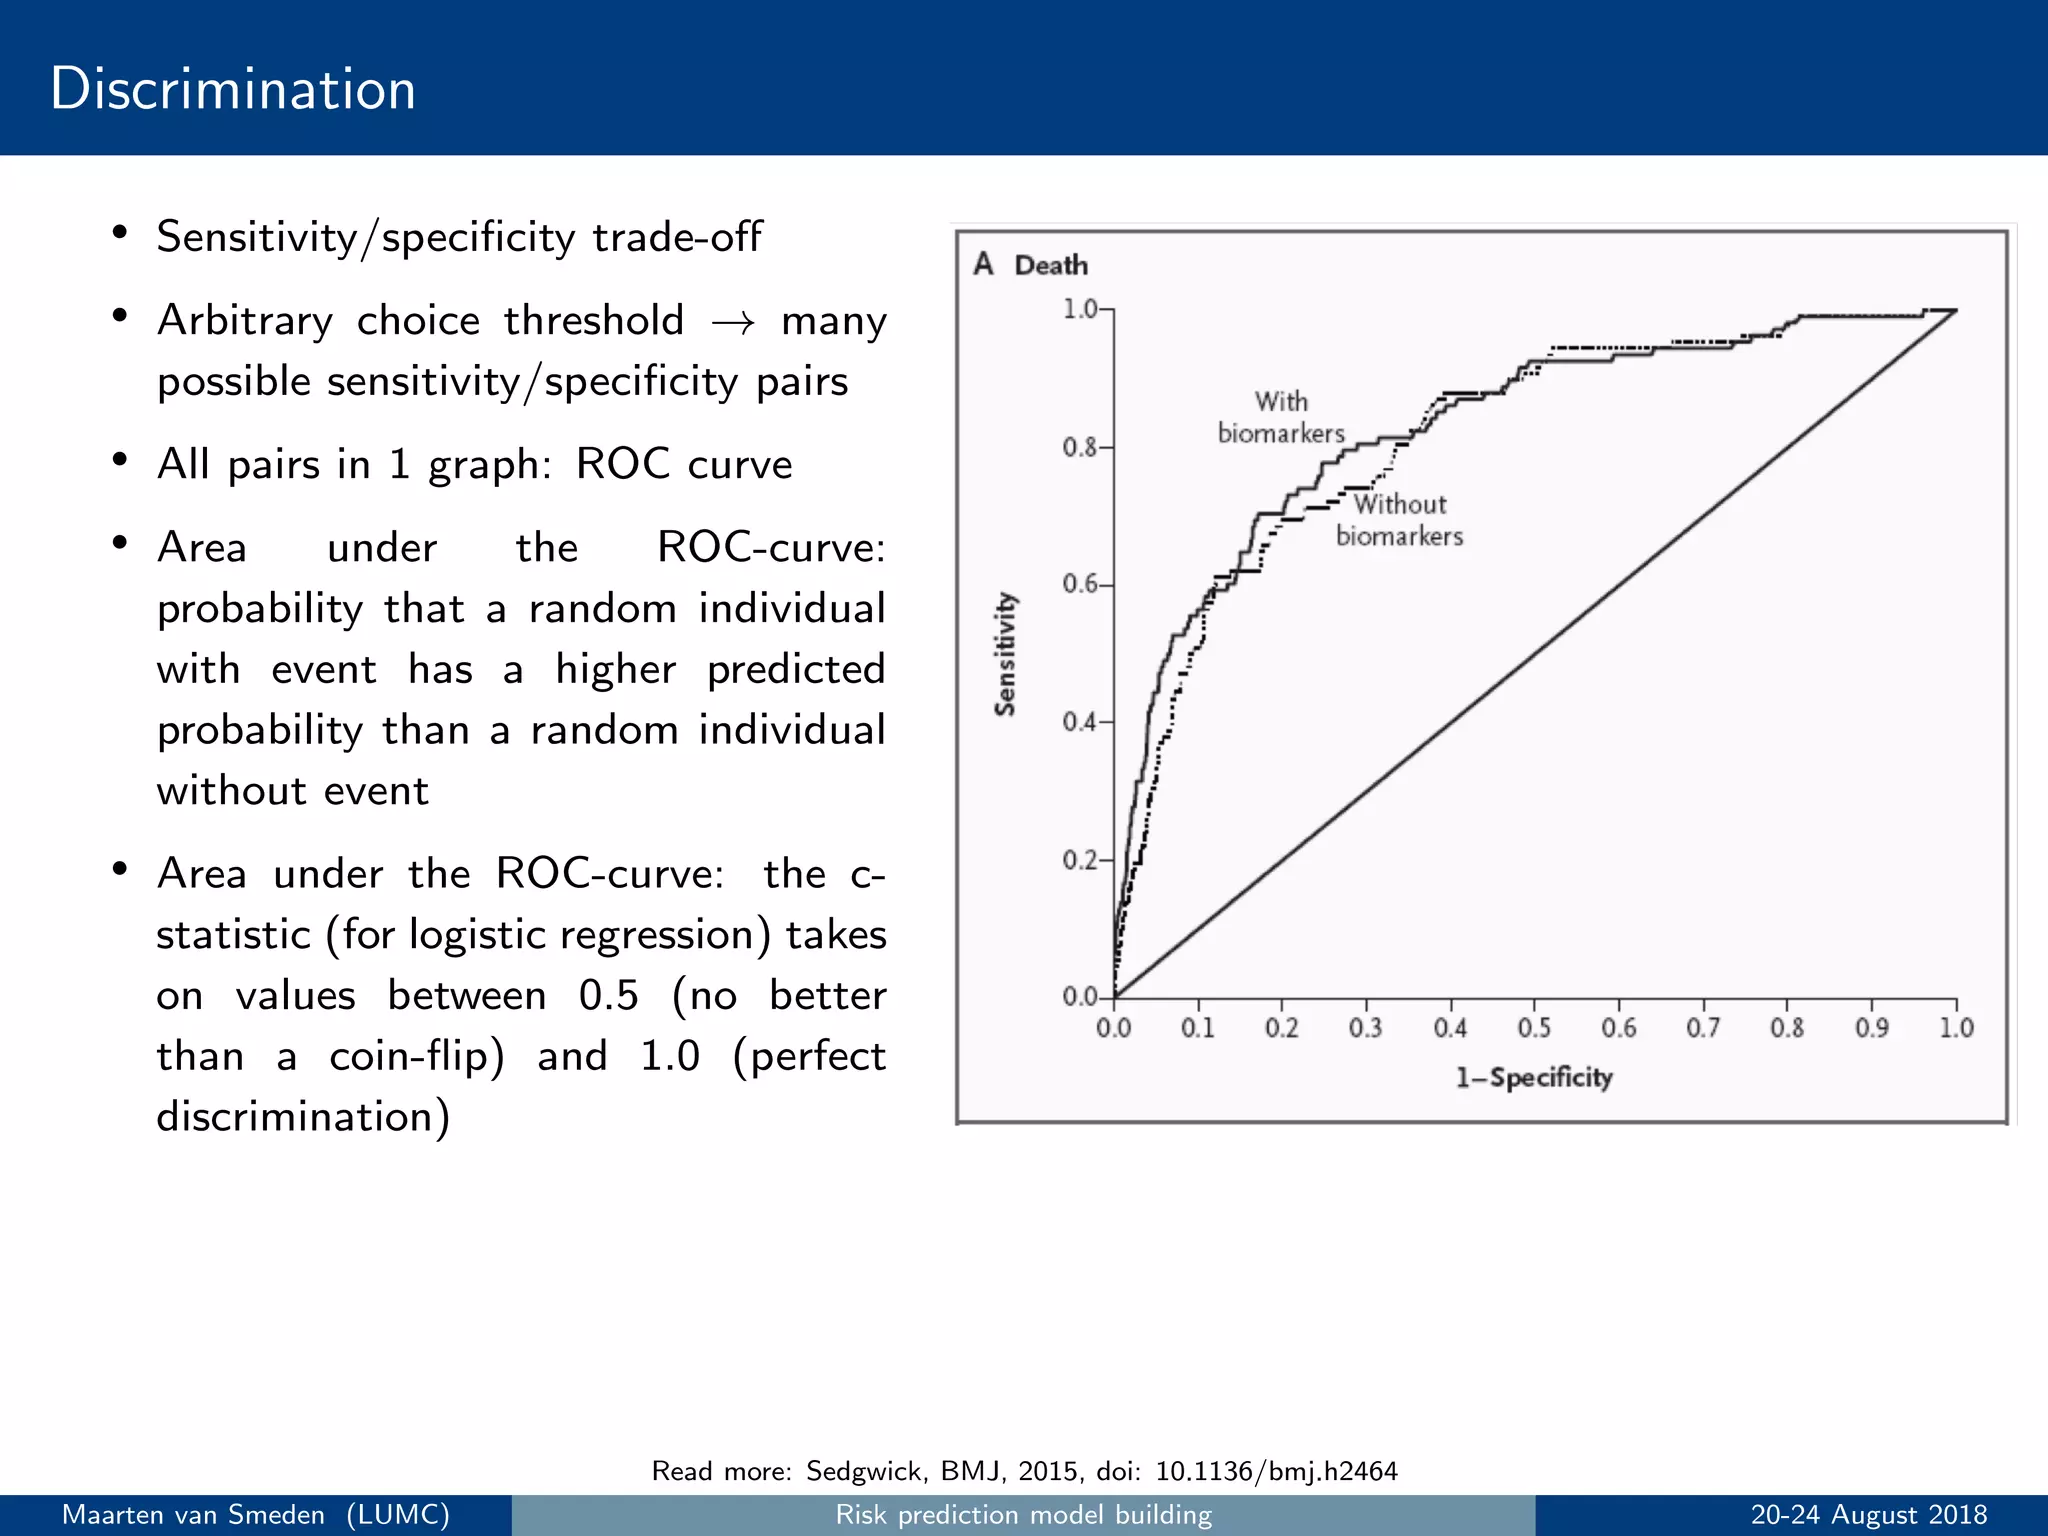
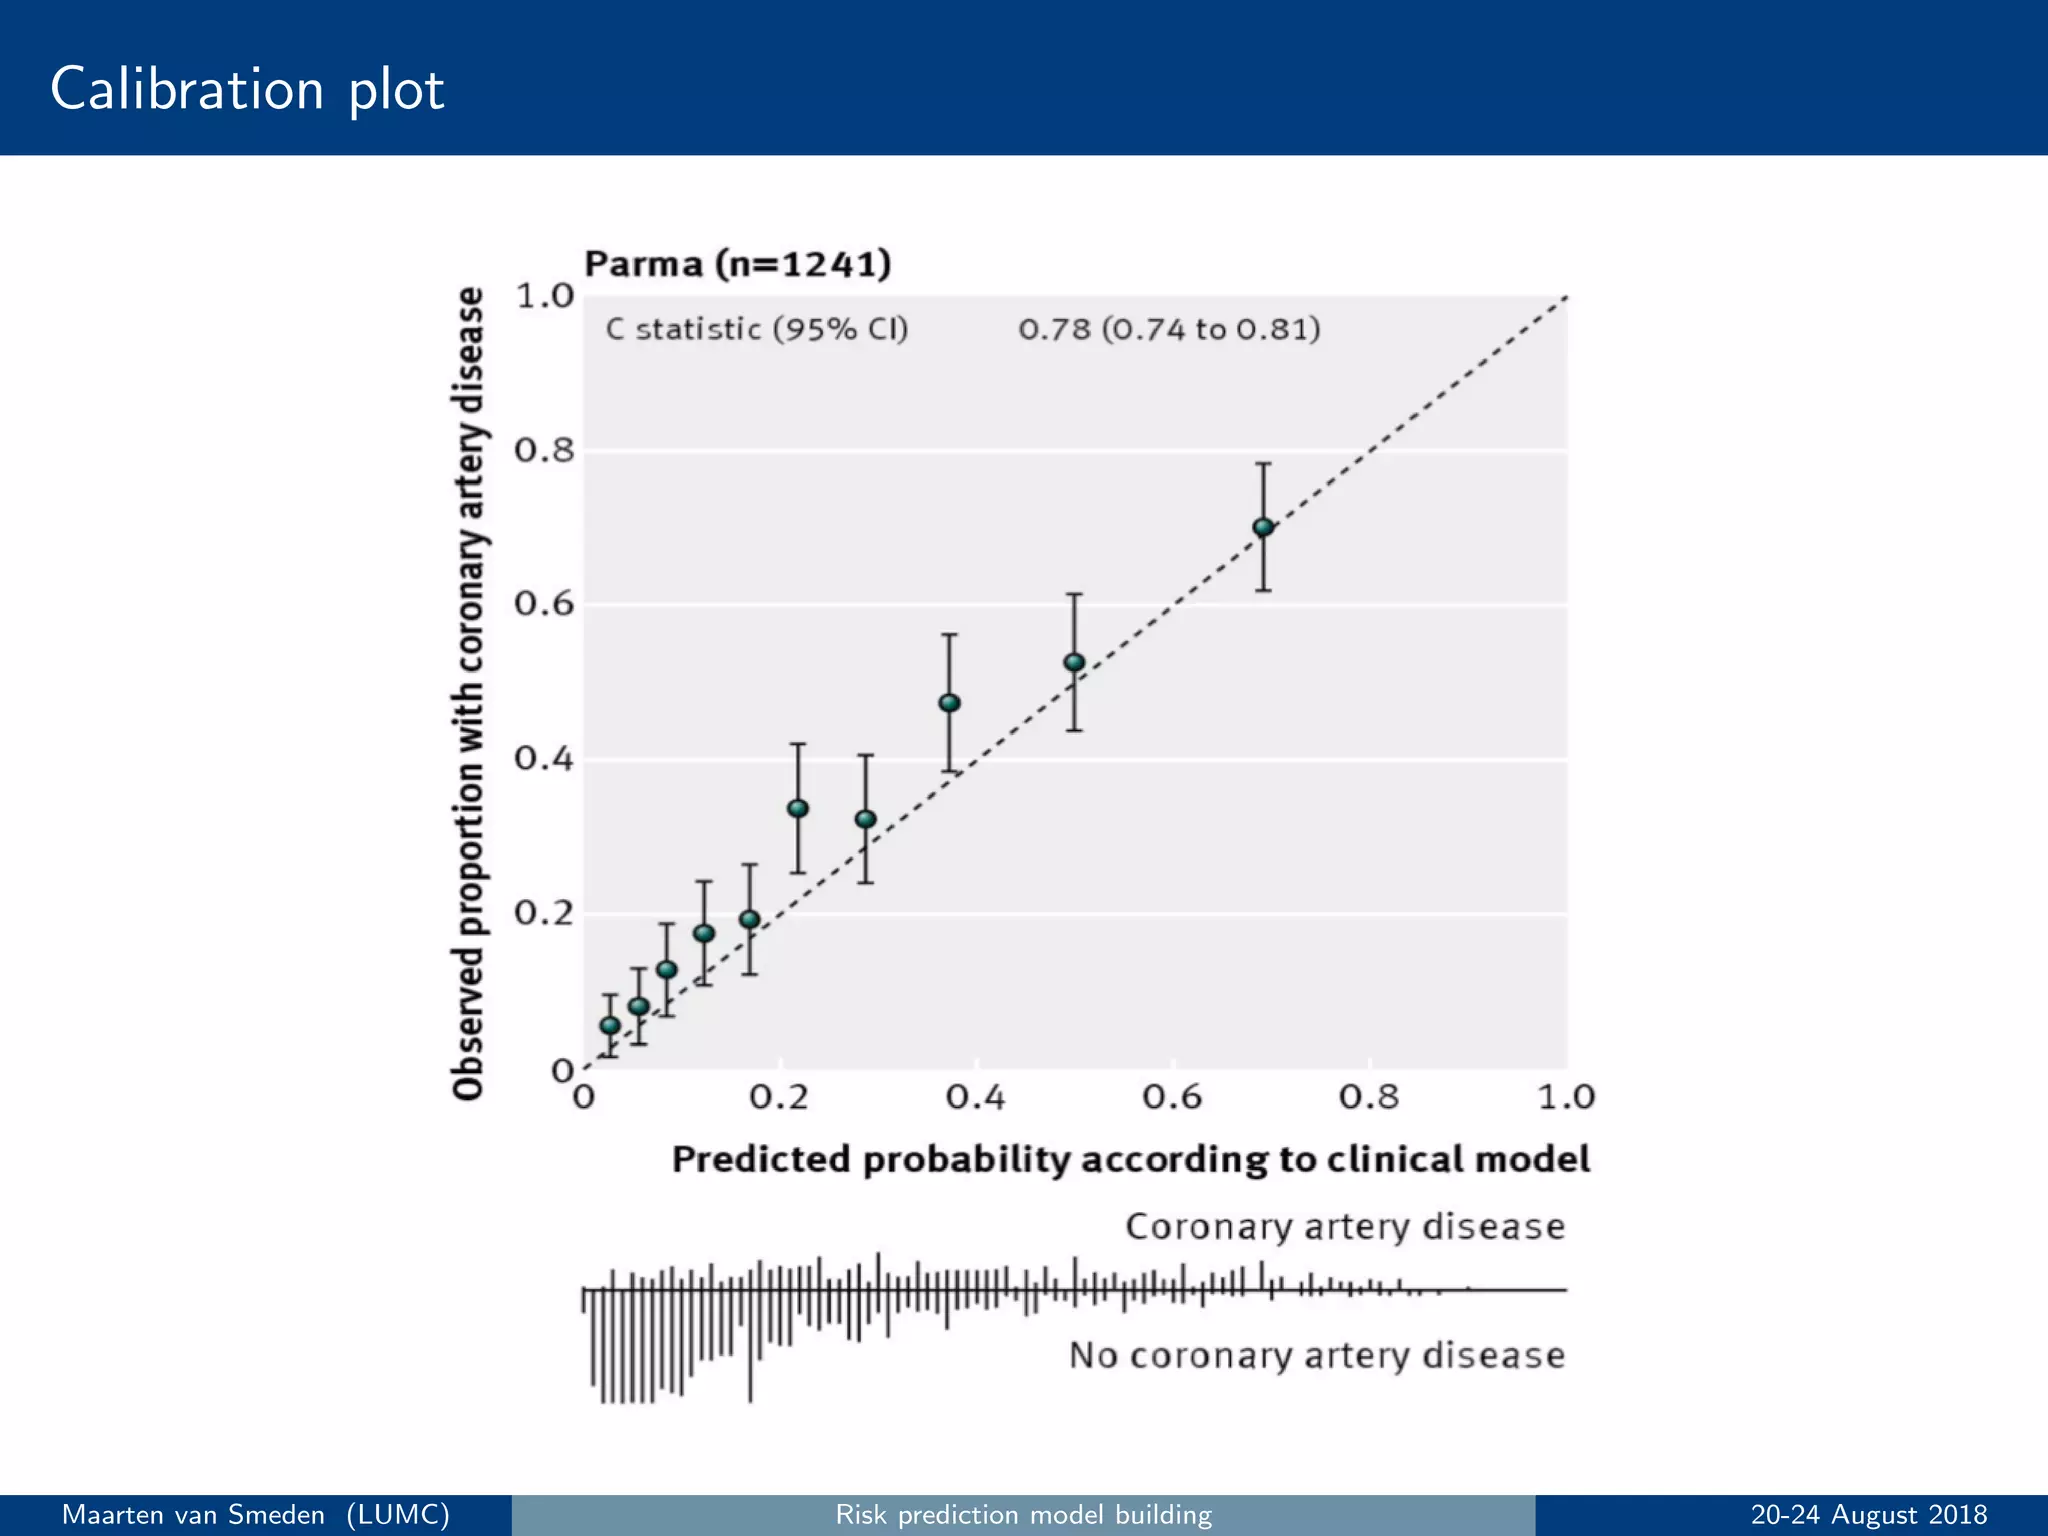
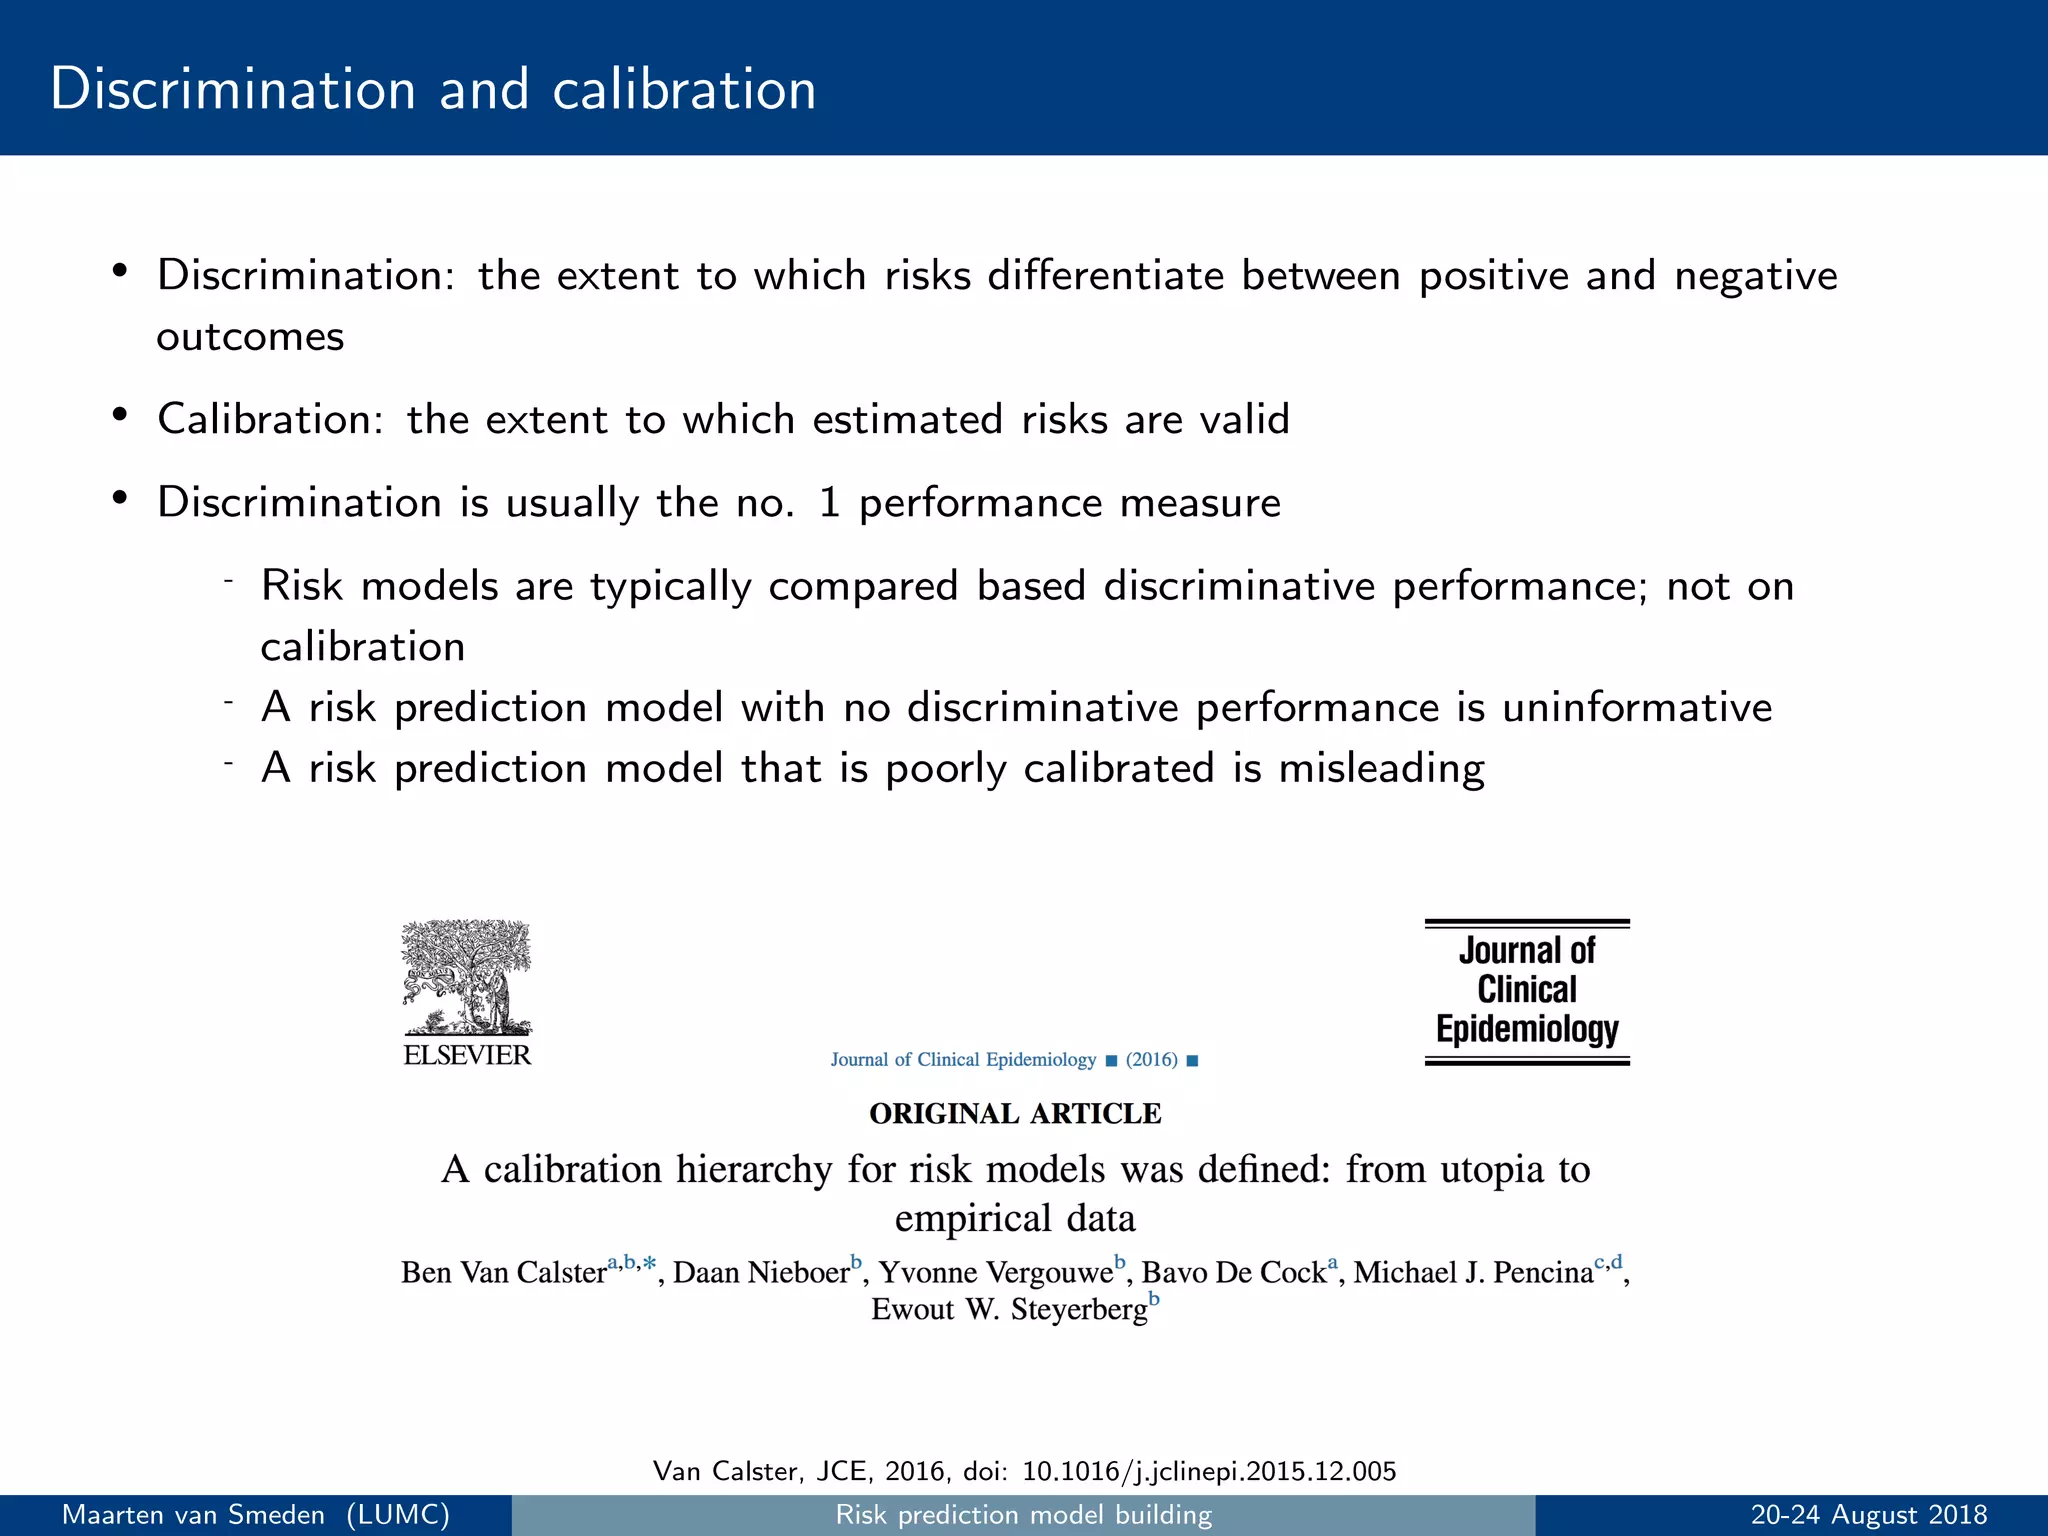
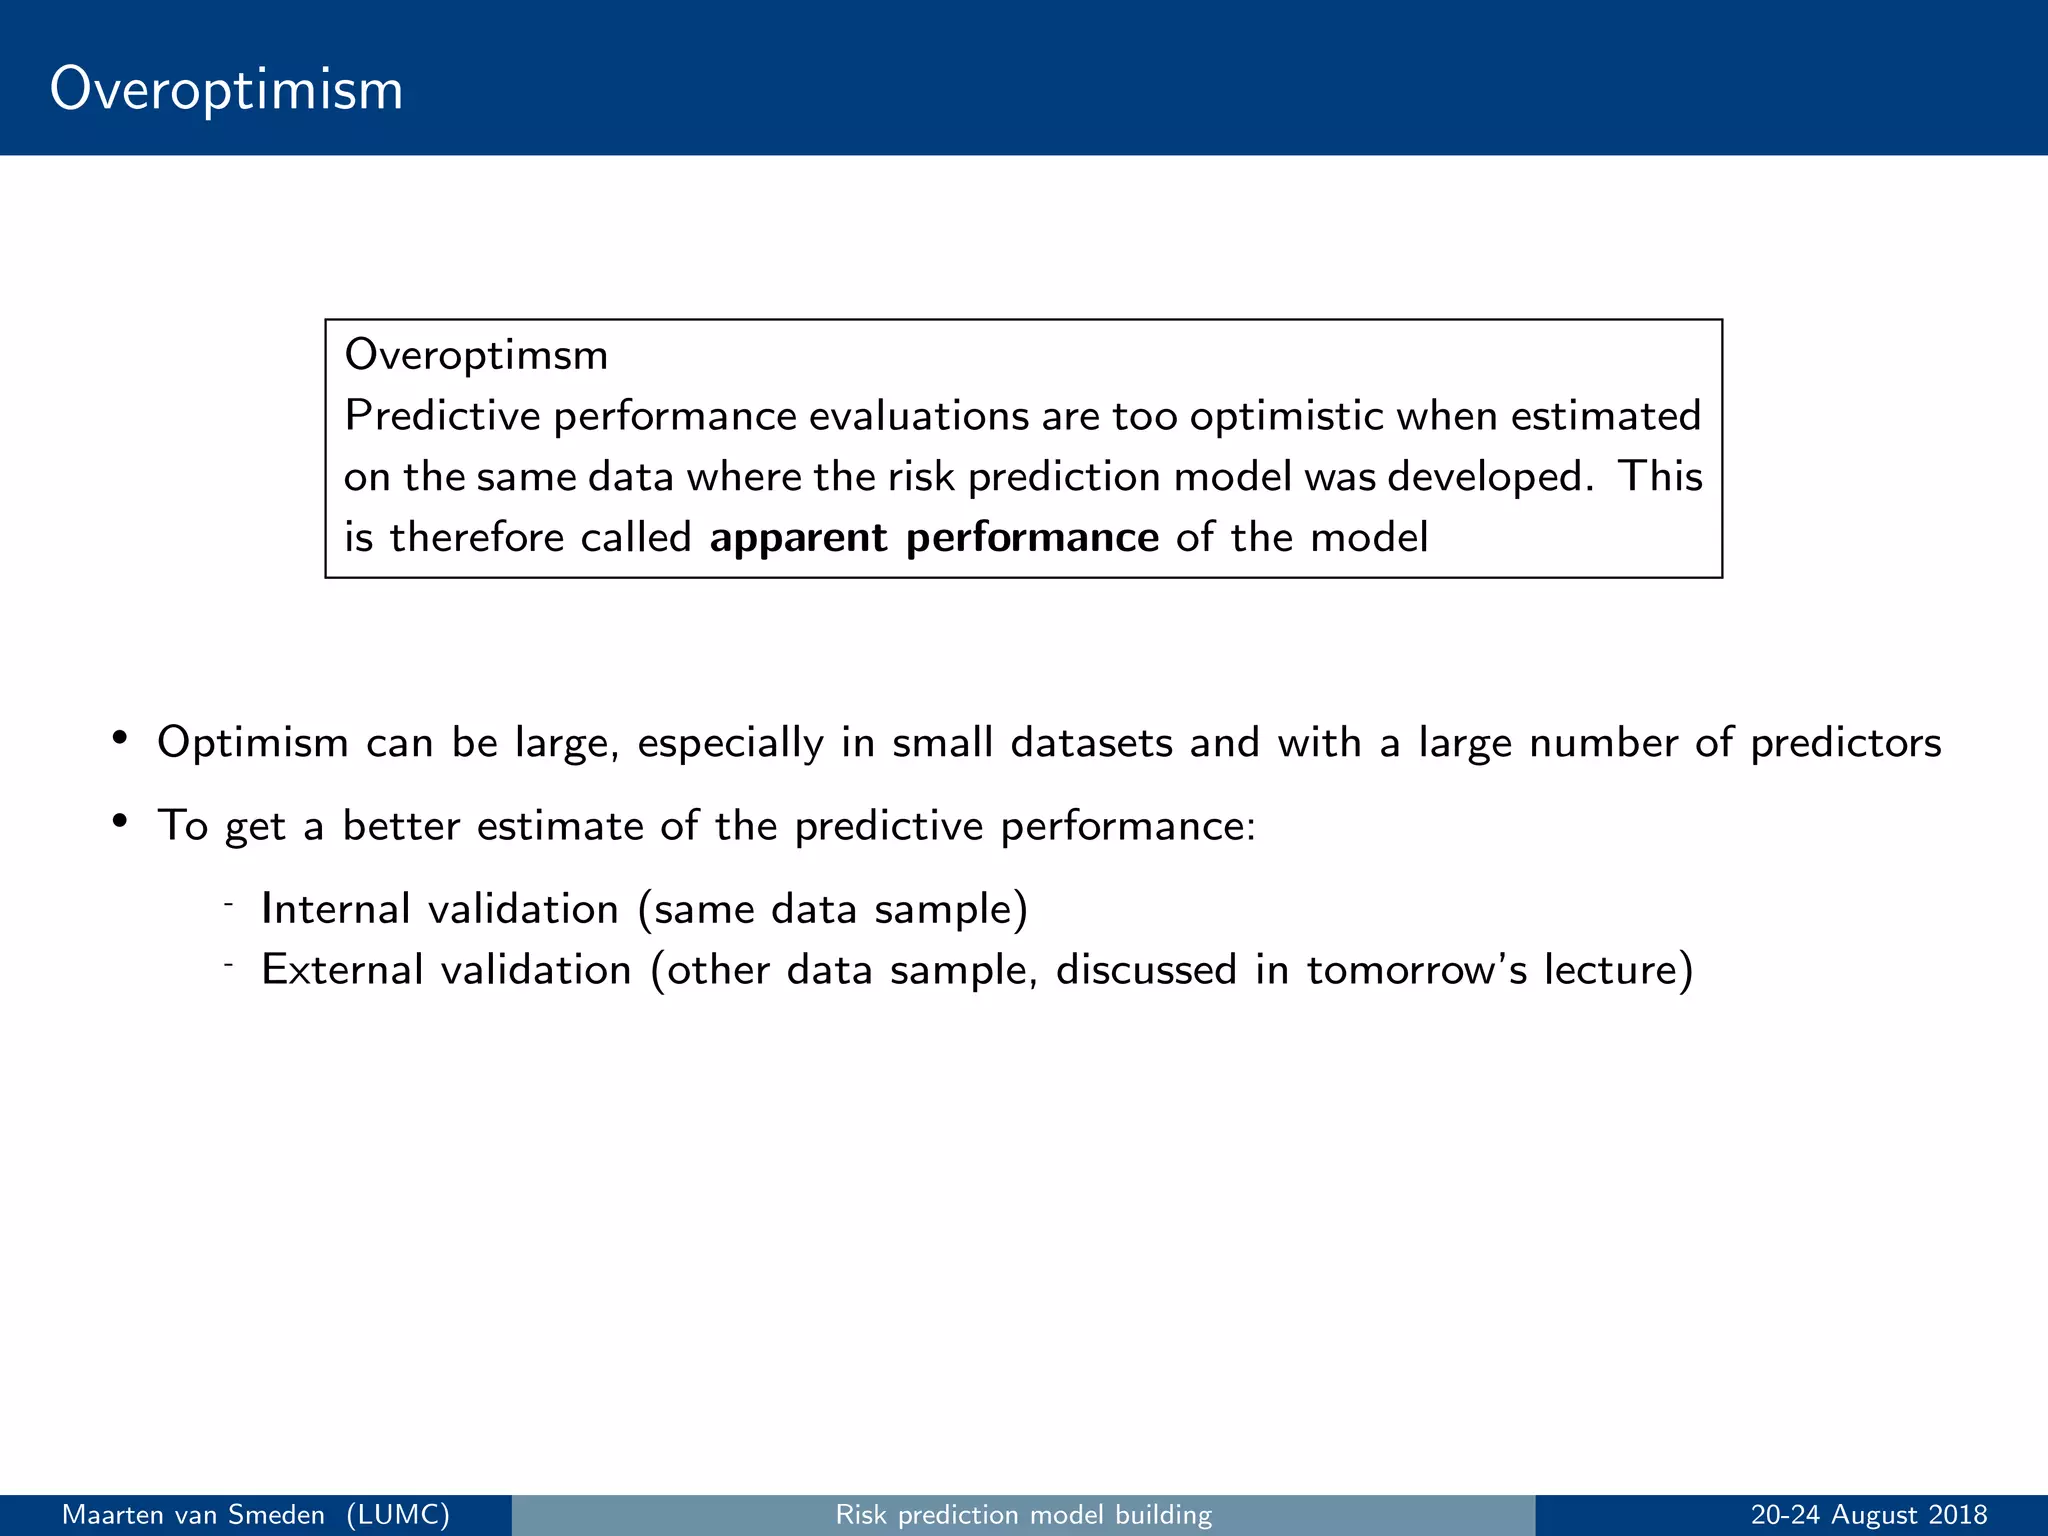
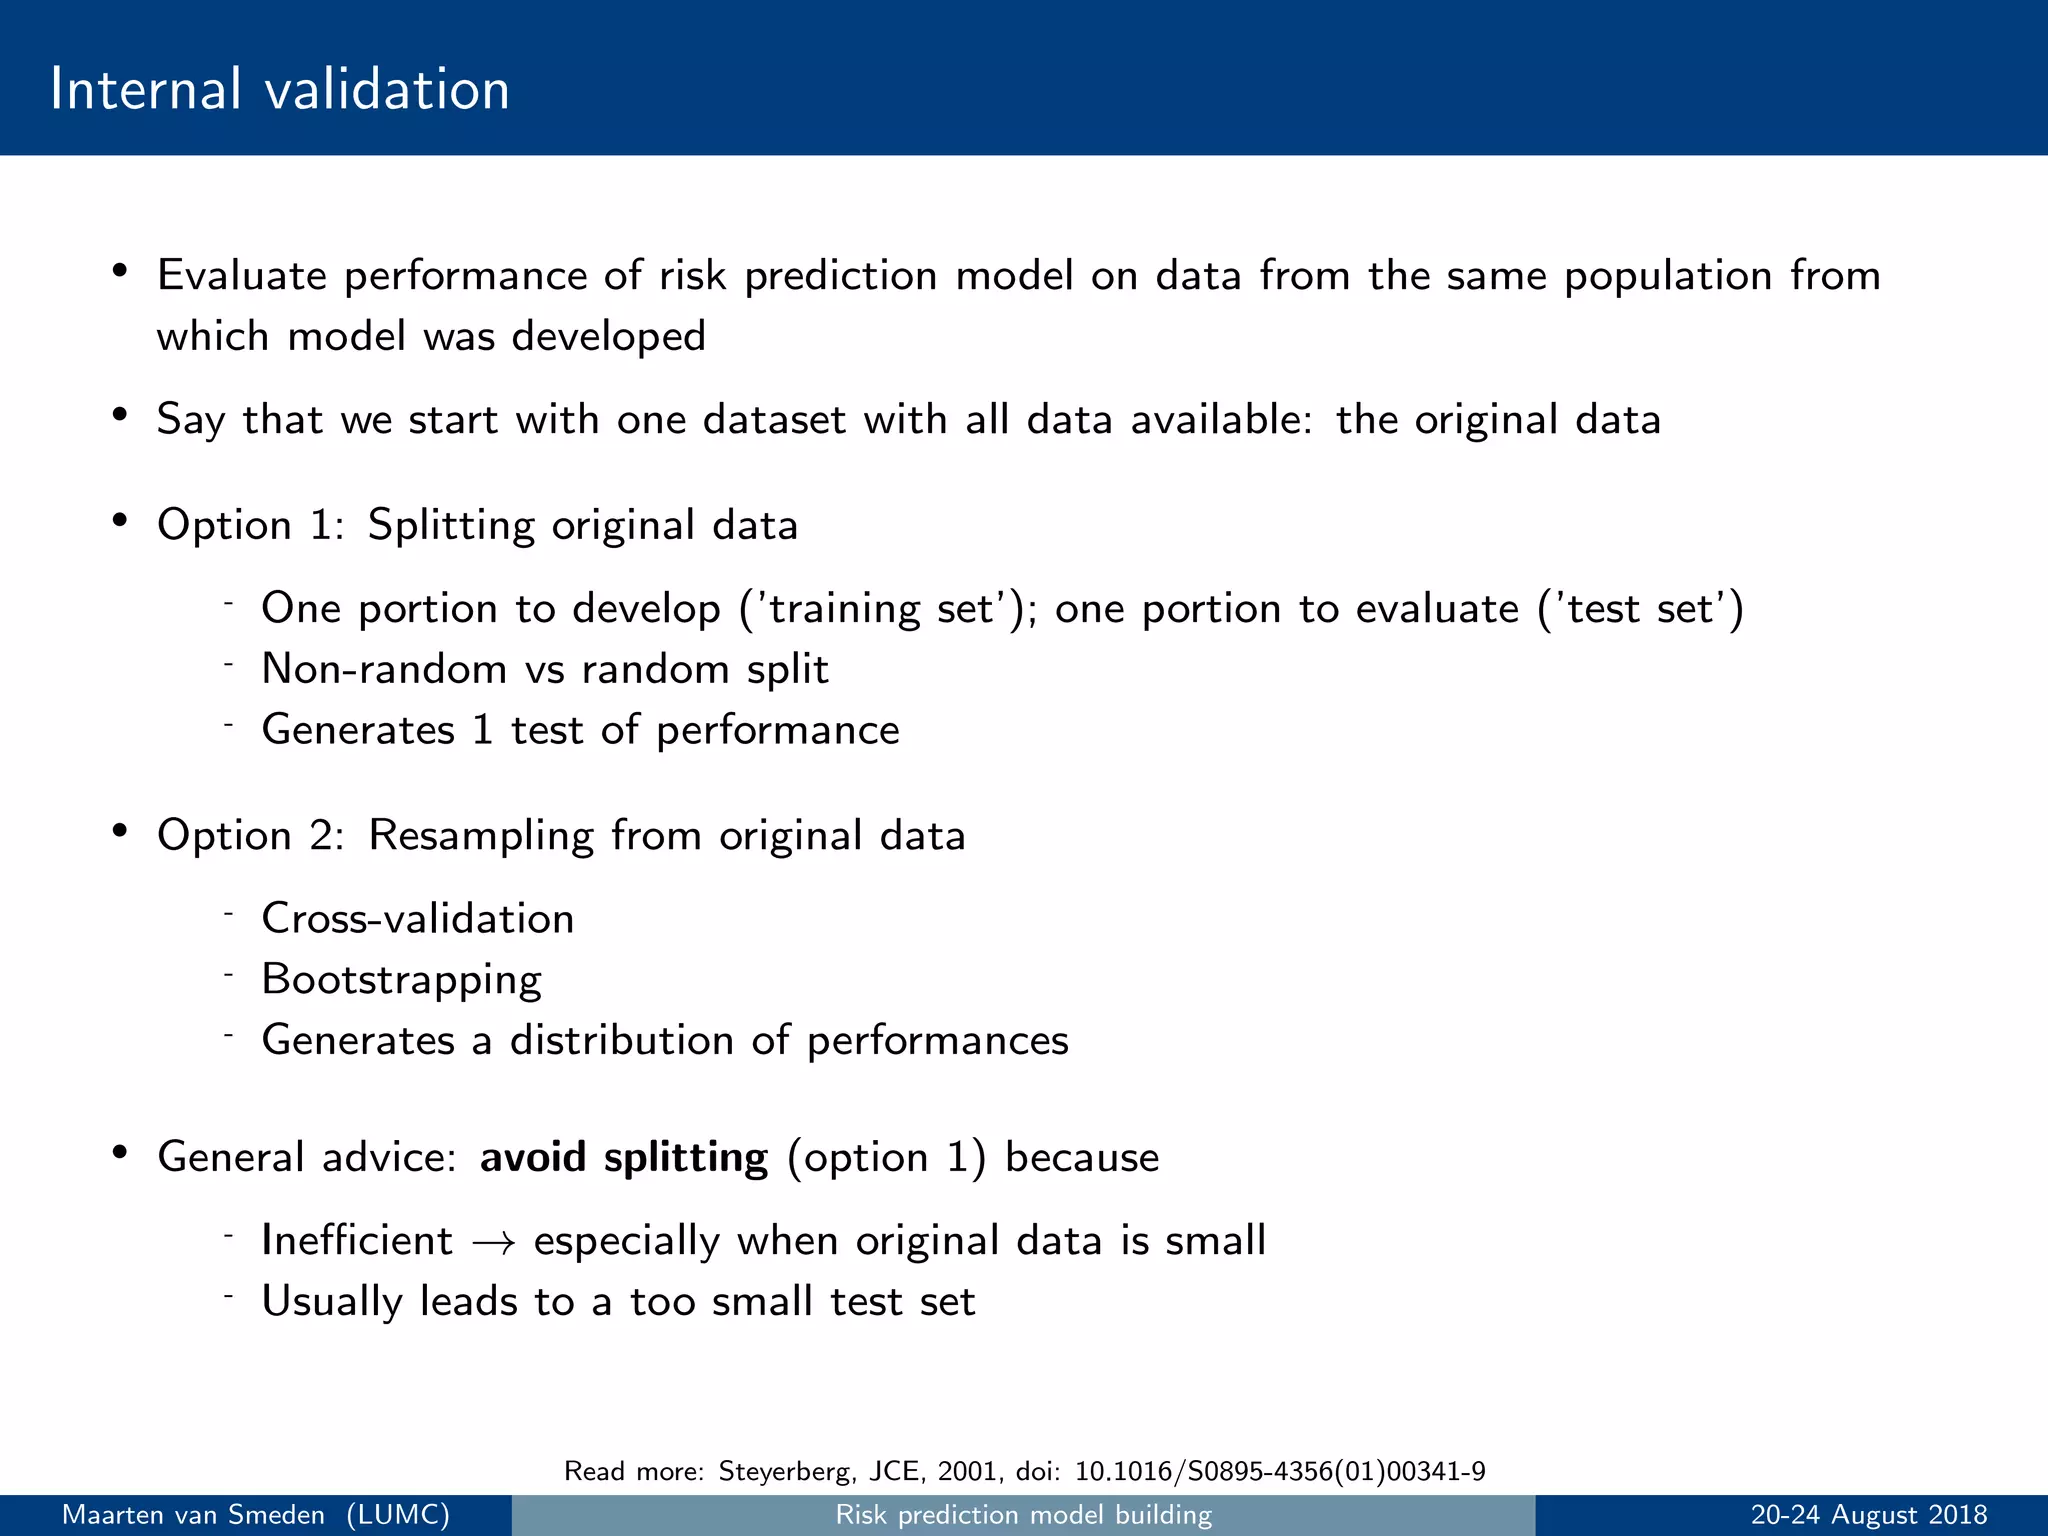
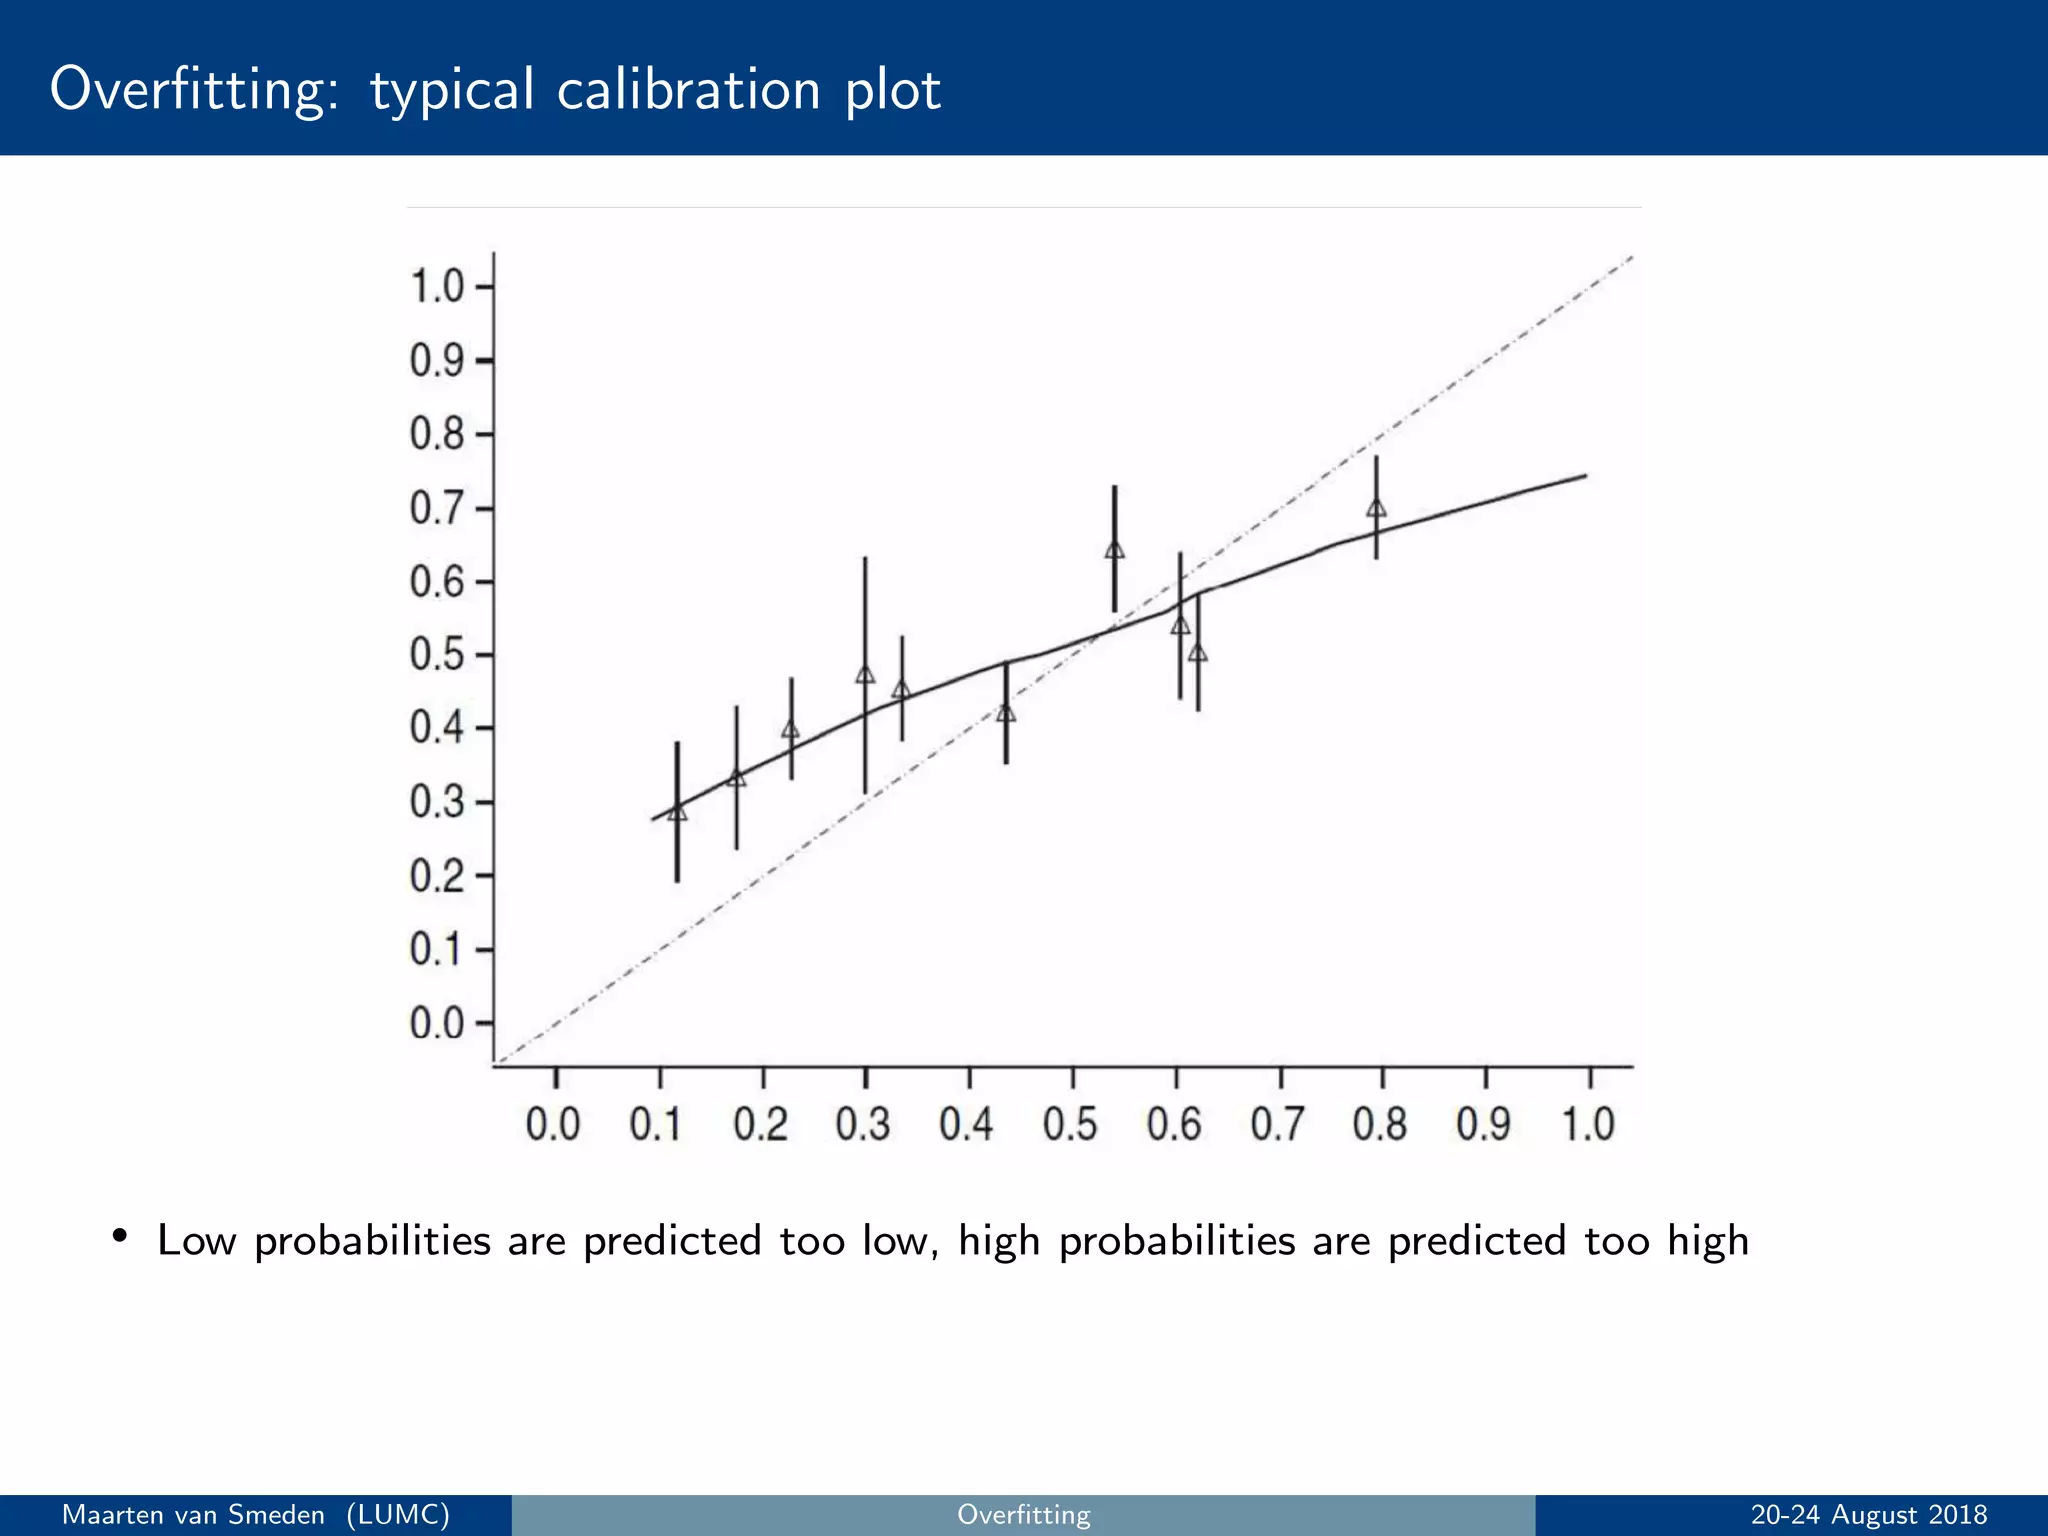
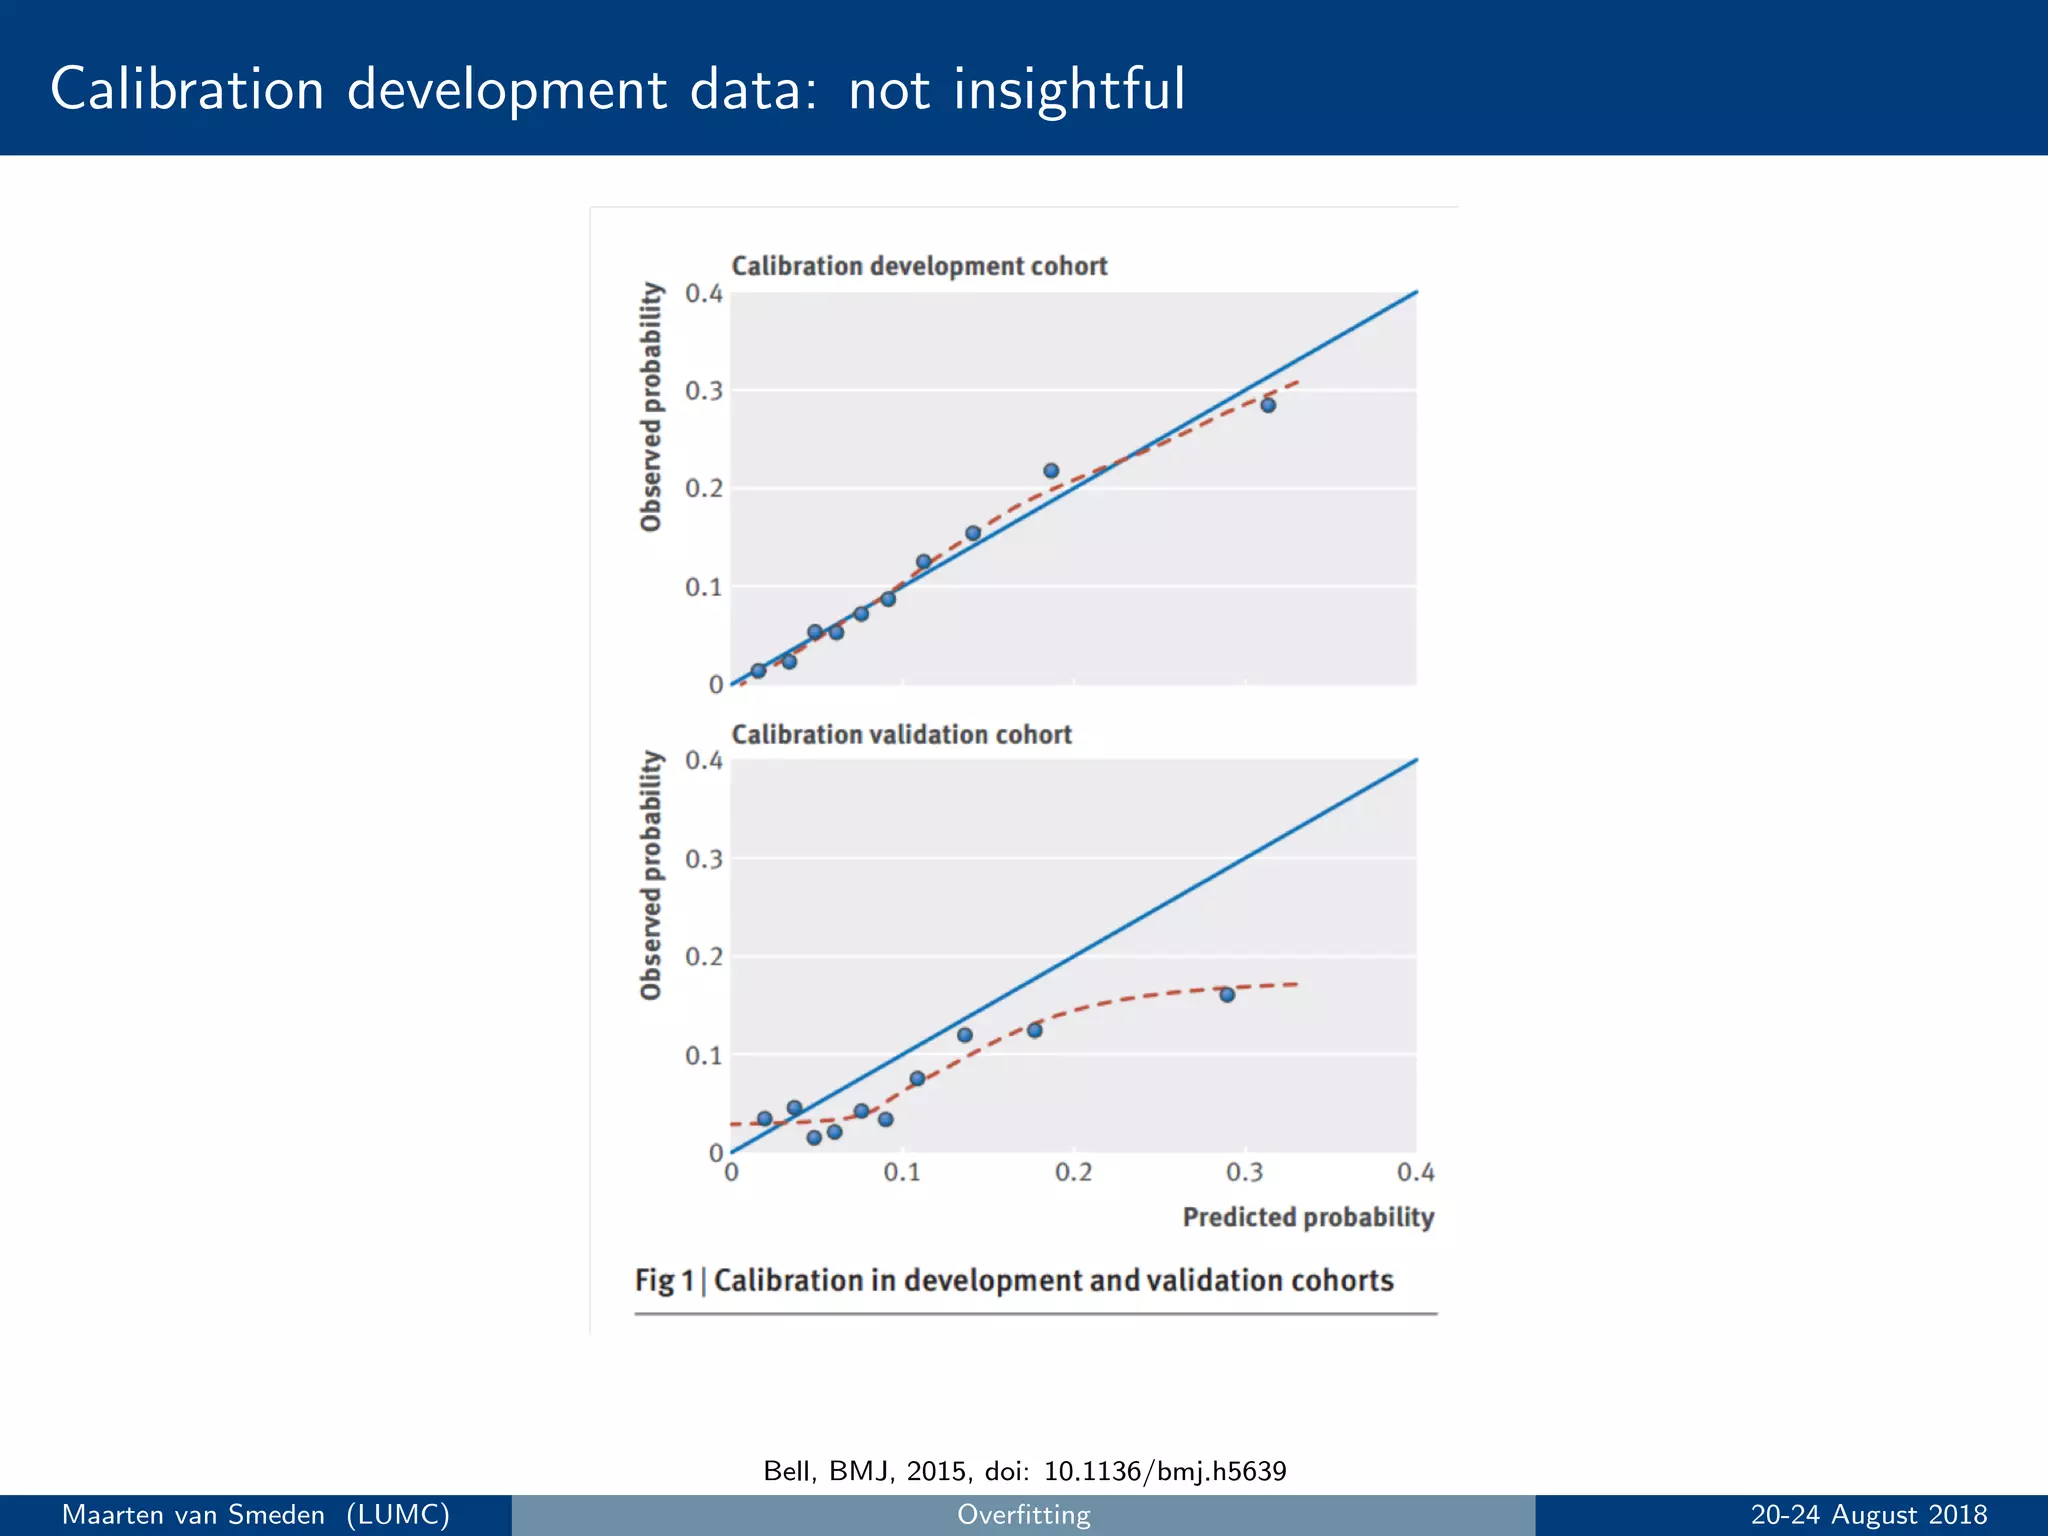
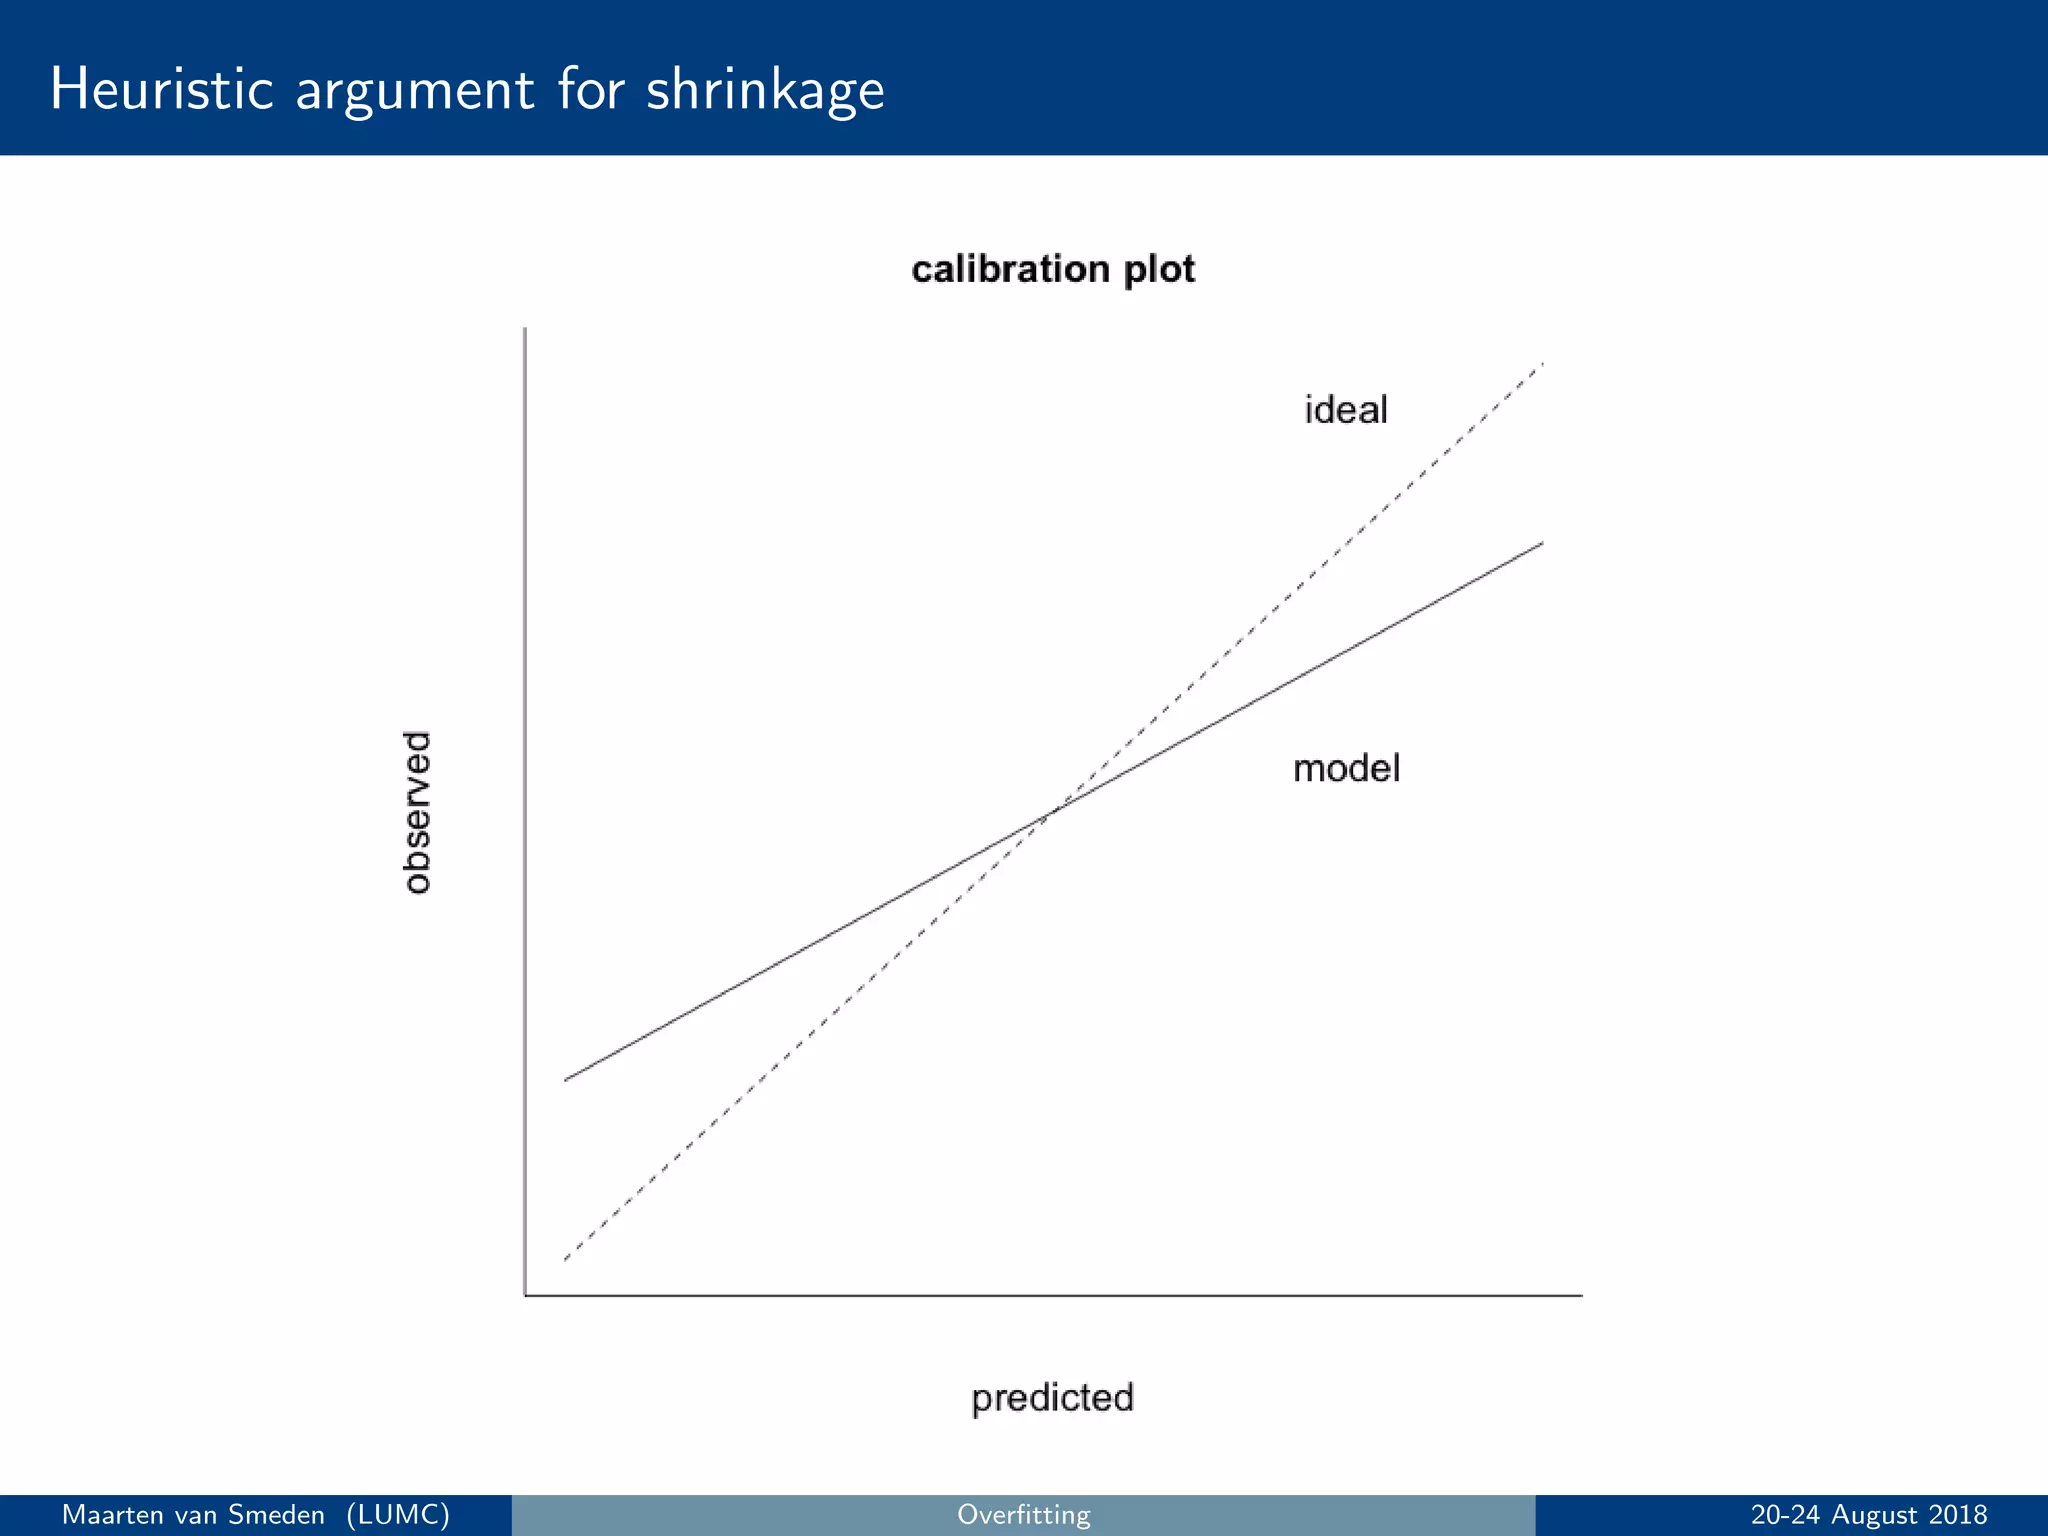
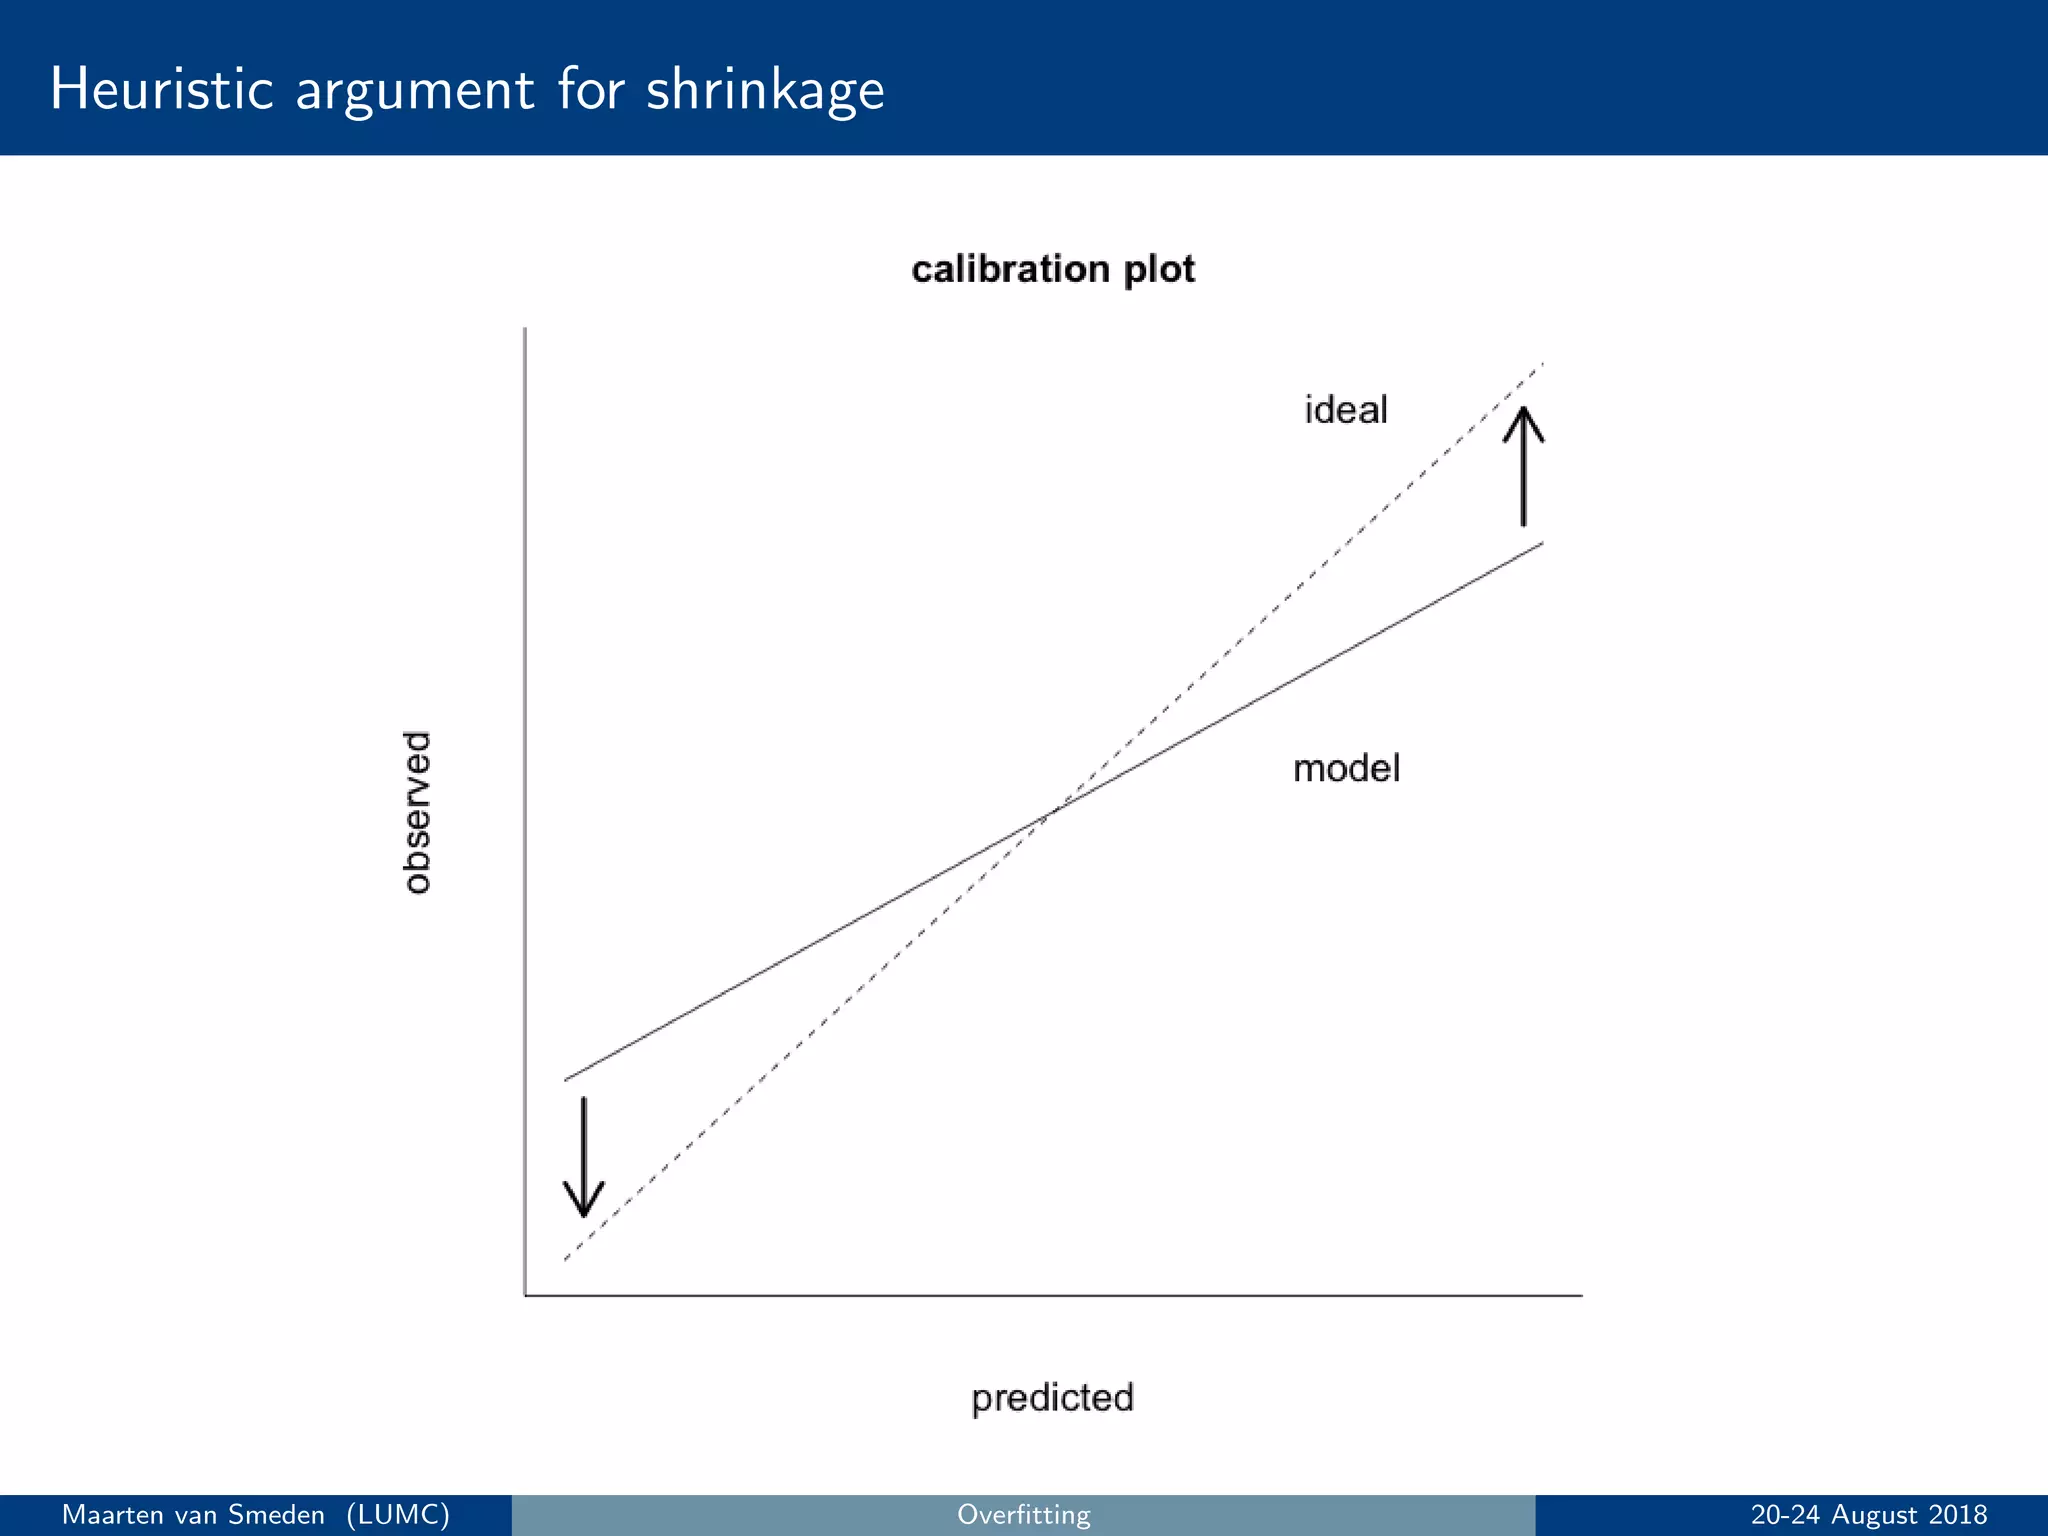
5. Evaluate the model's performance using measures like discrimination and calibration and perform internal validation to account for overoptimism.
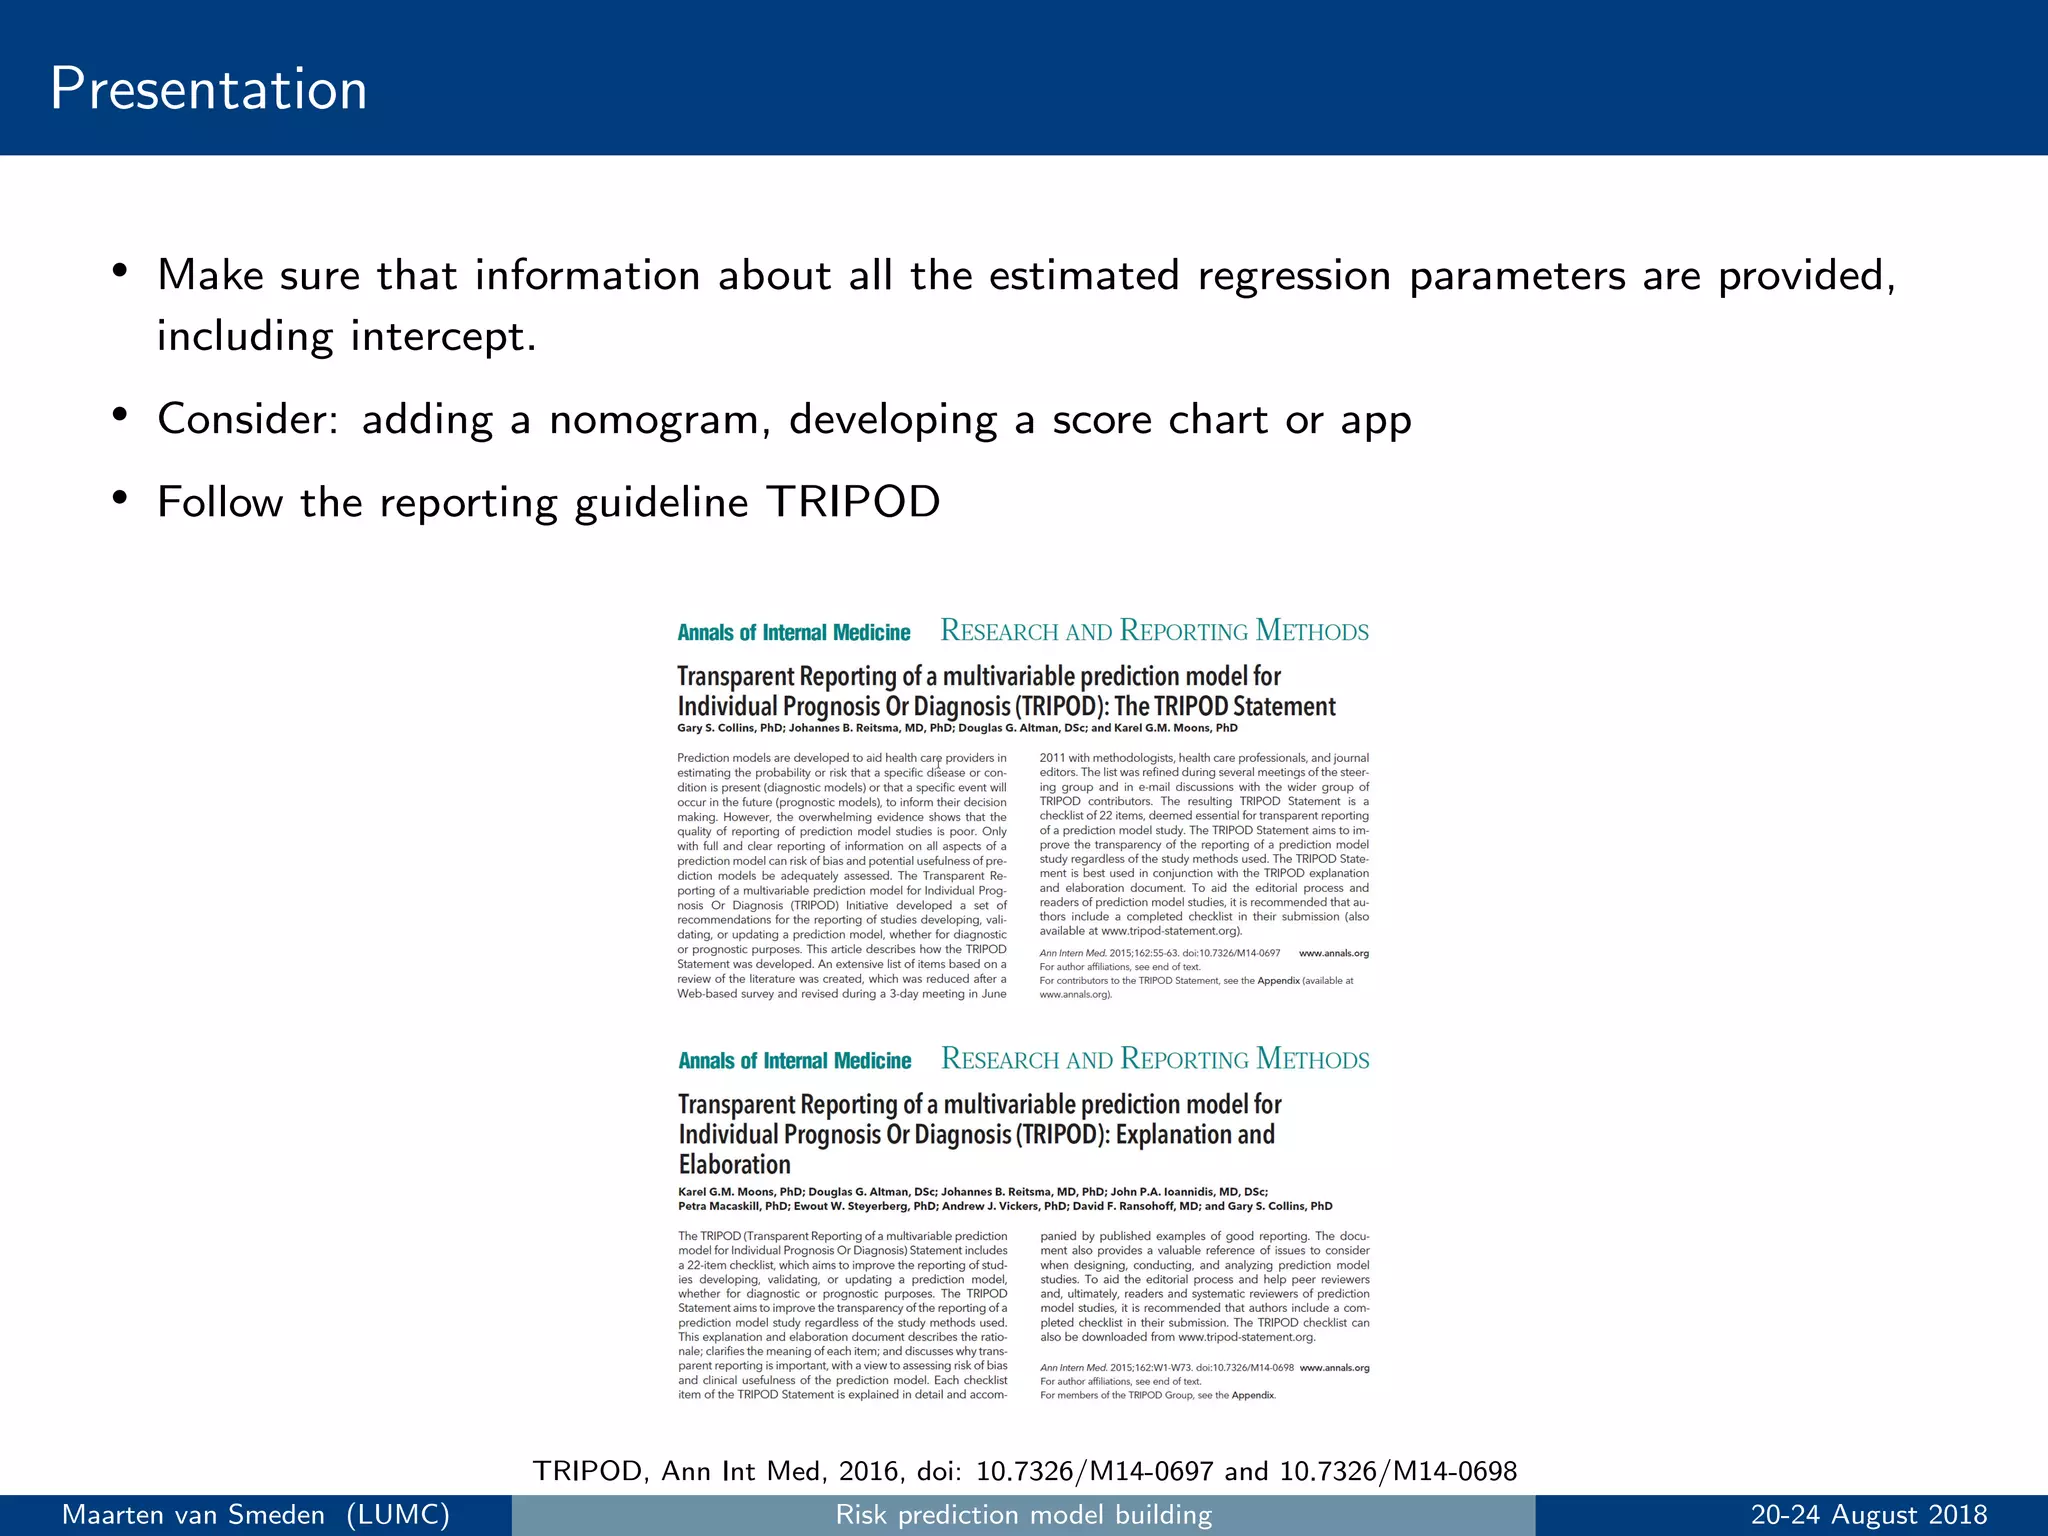
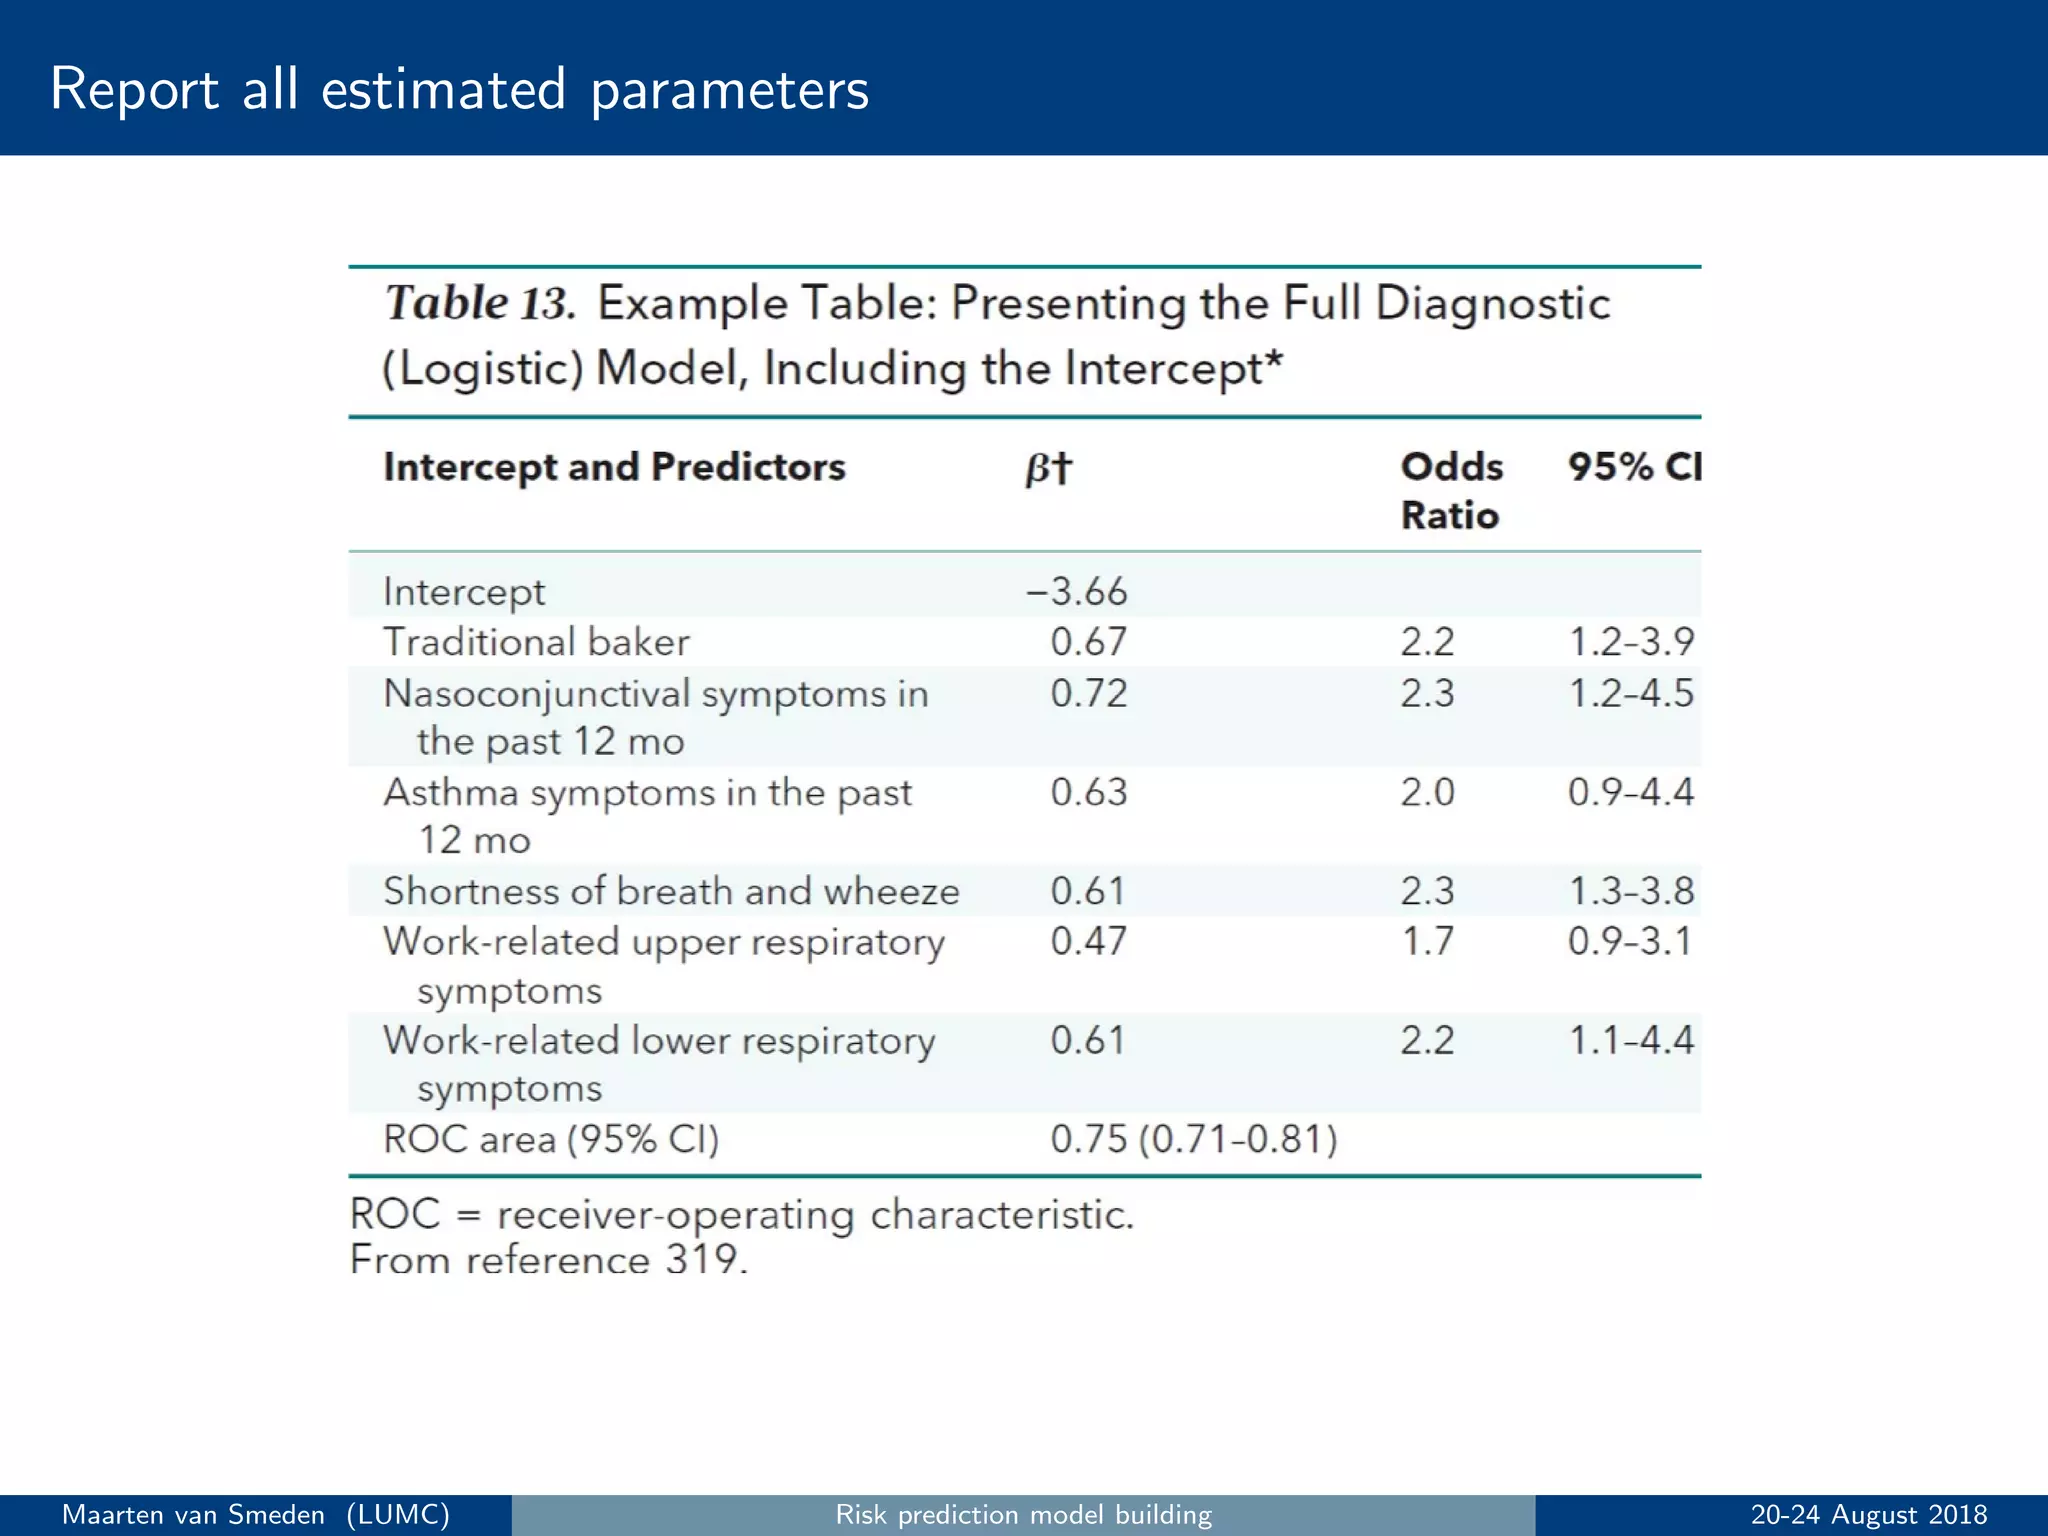
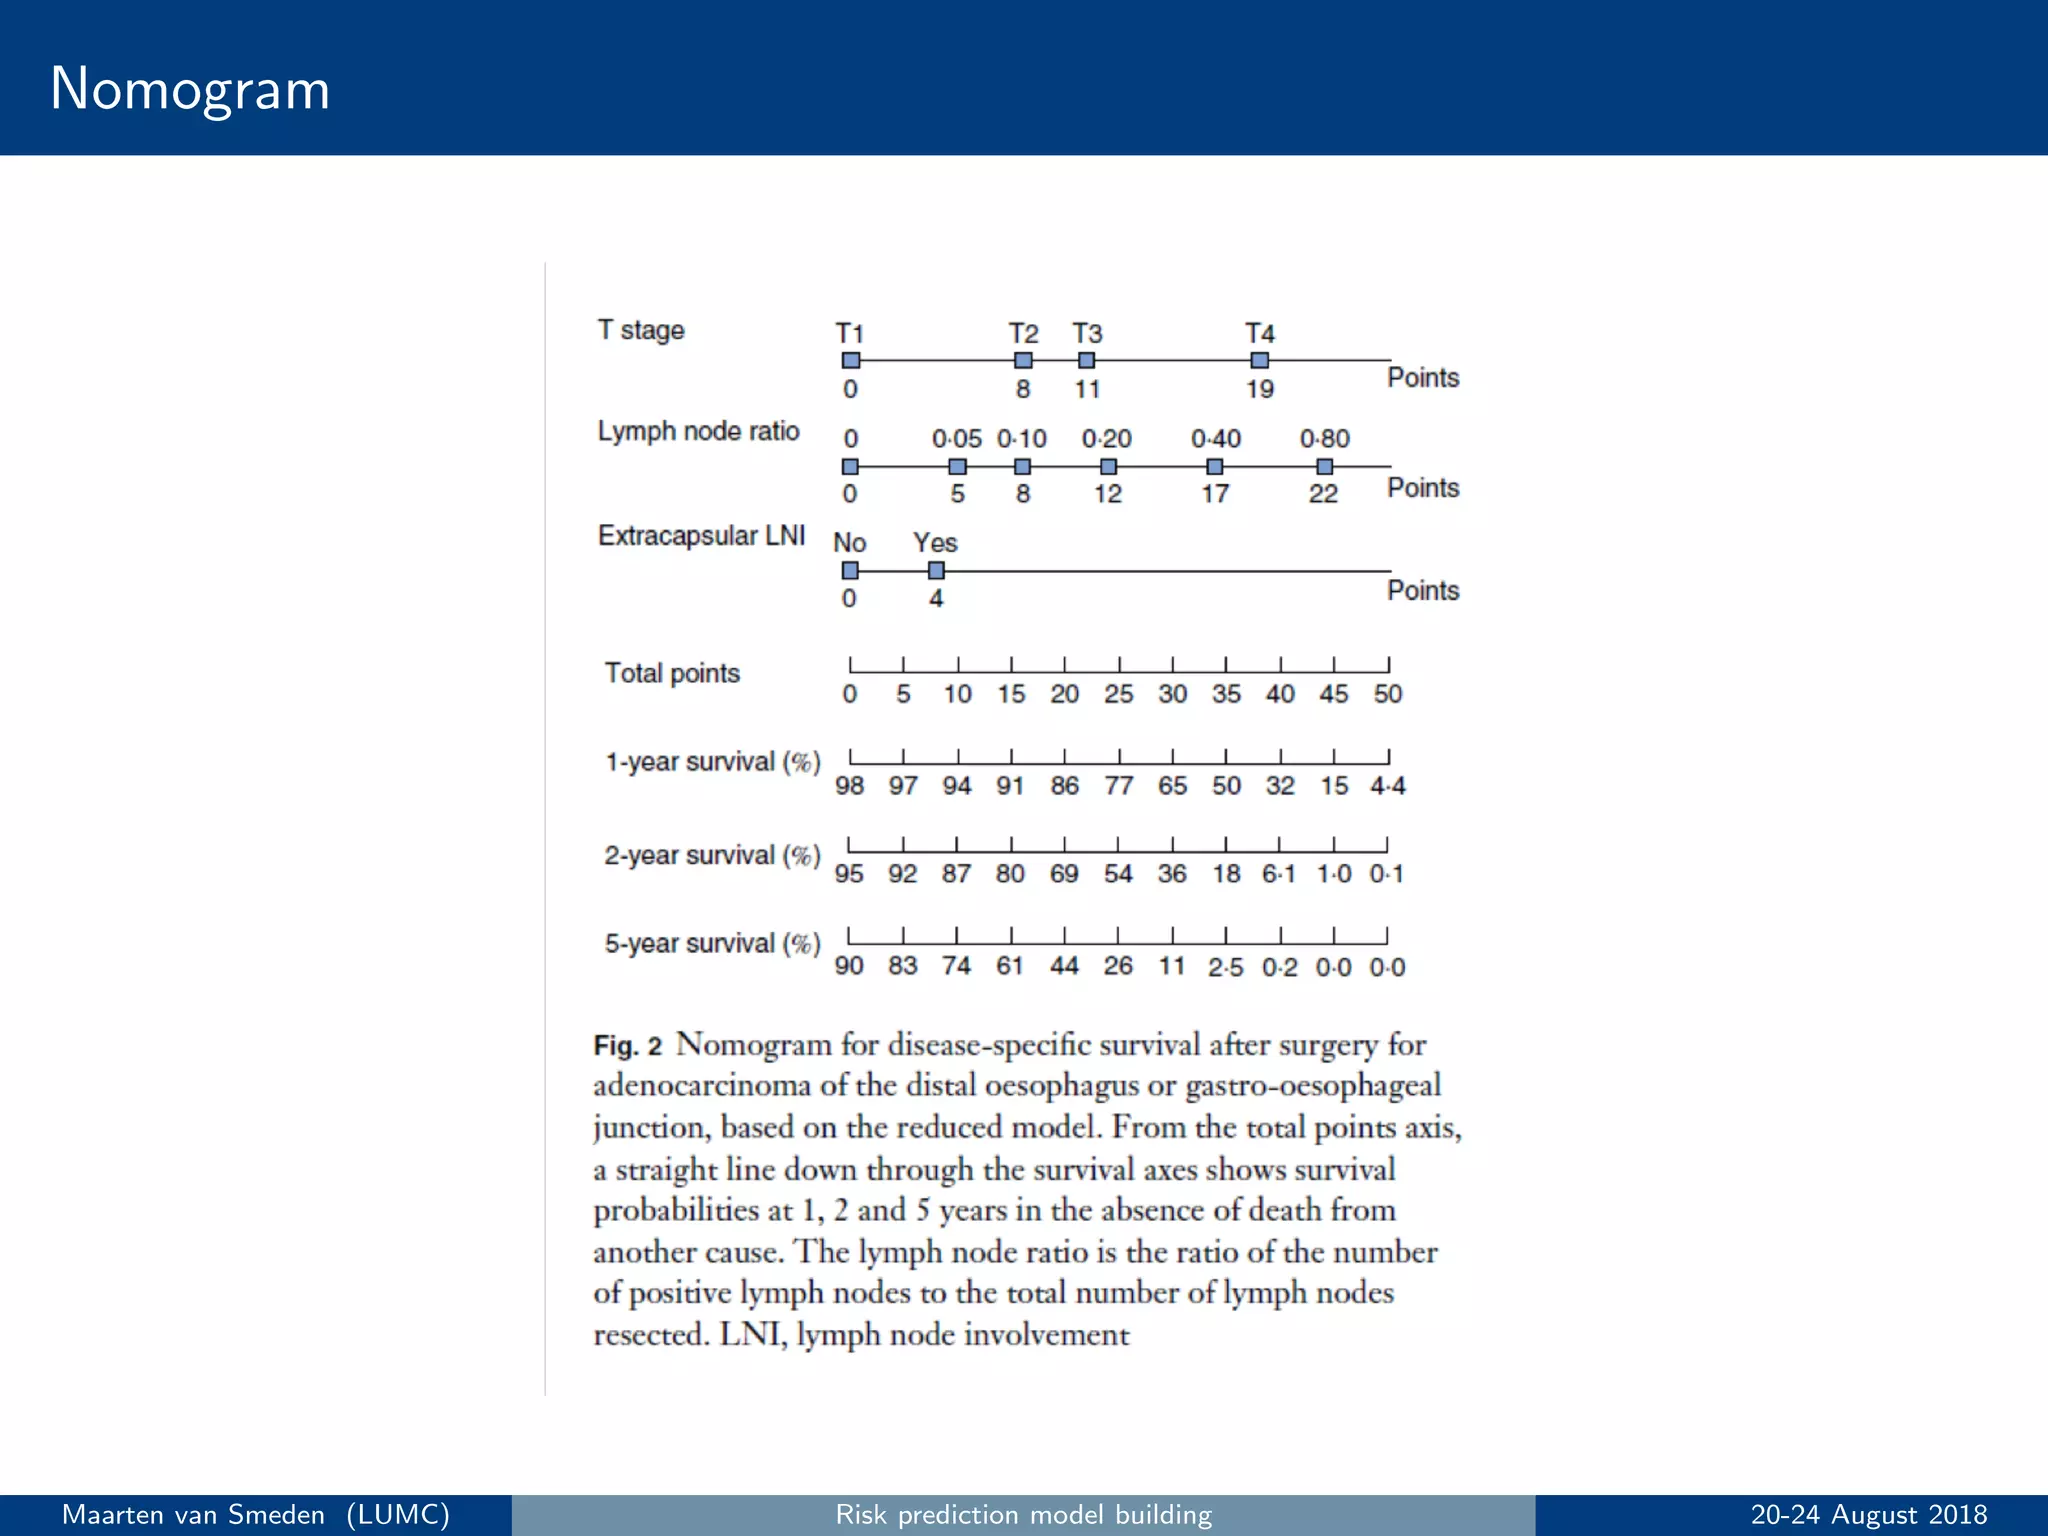
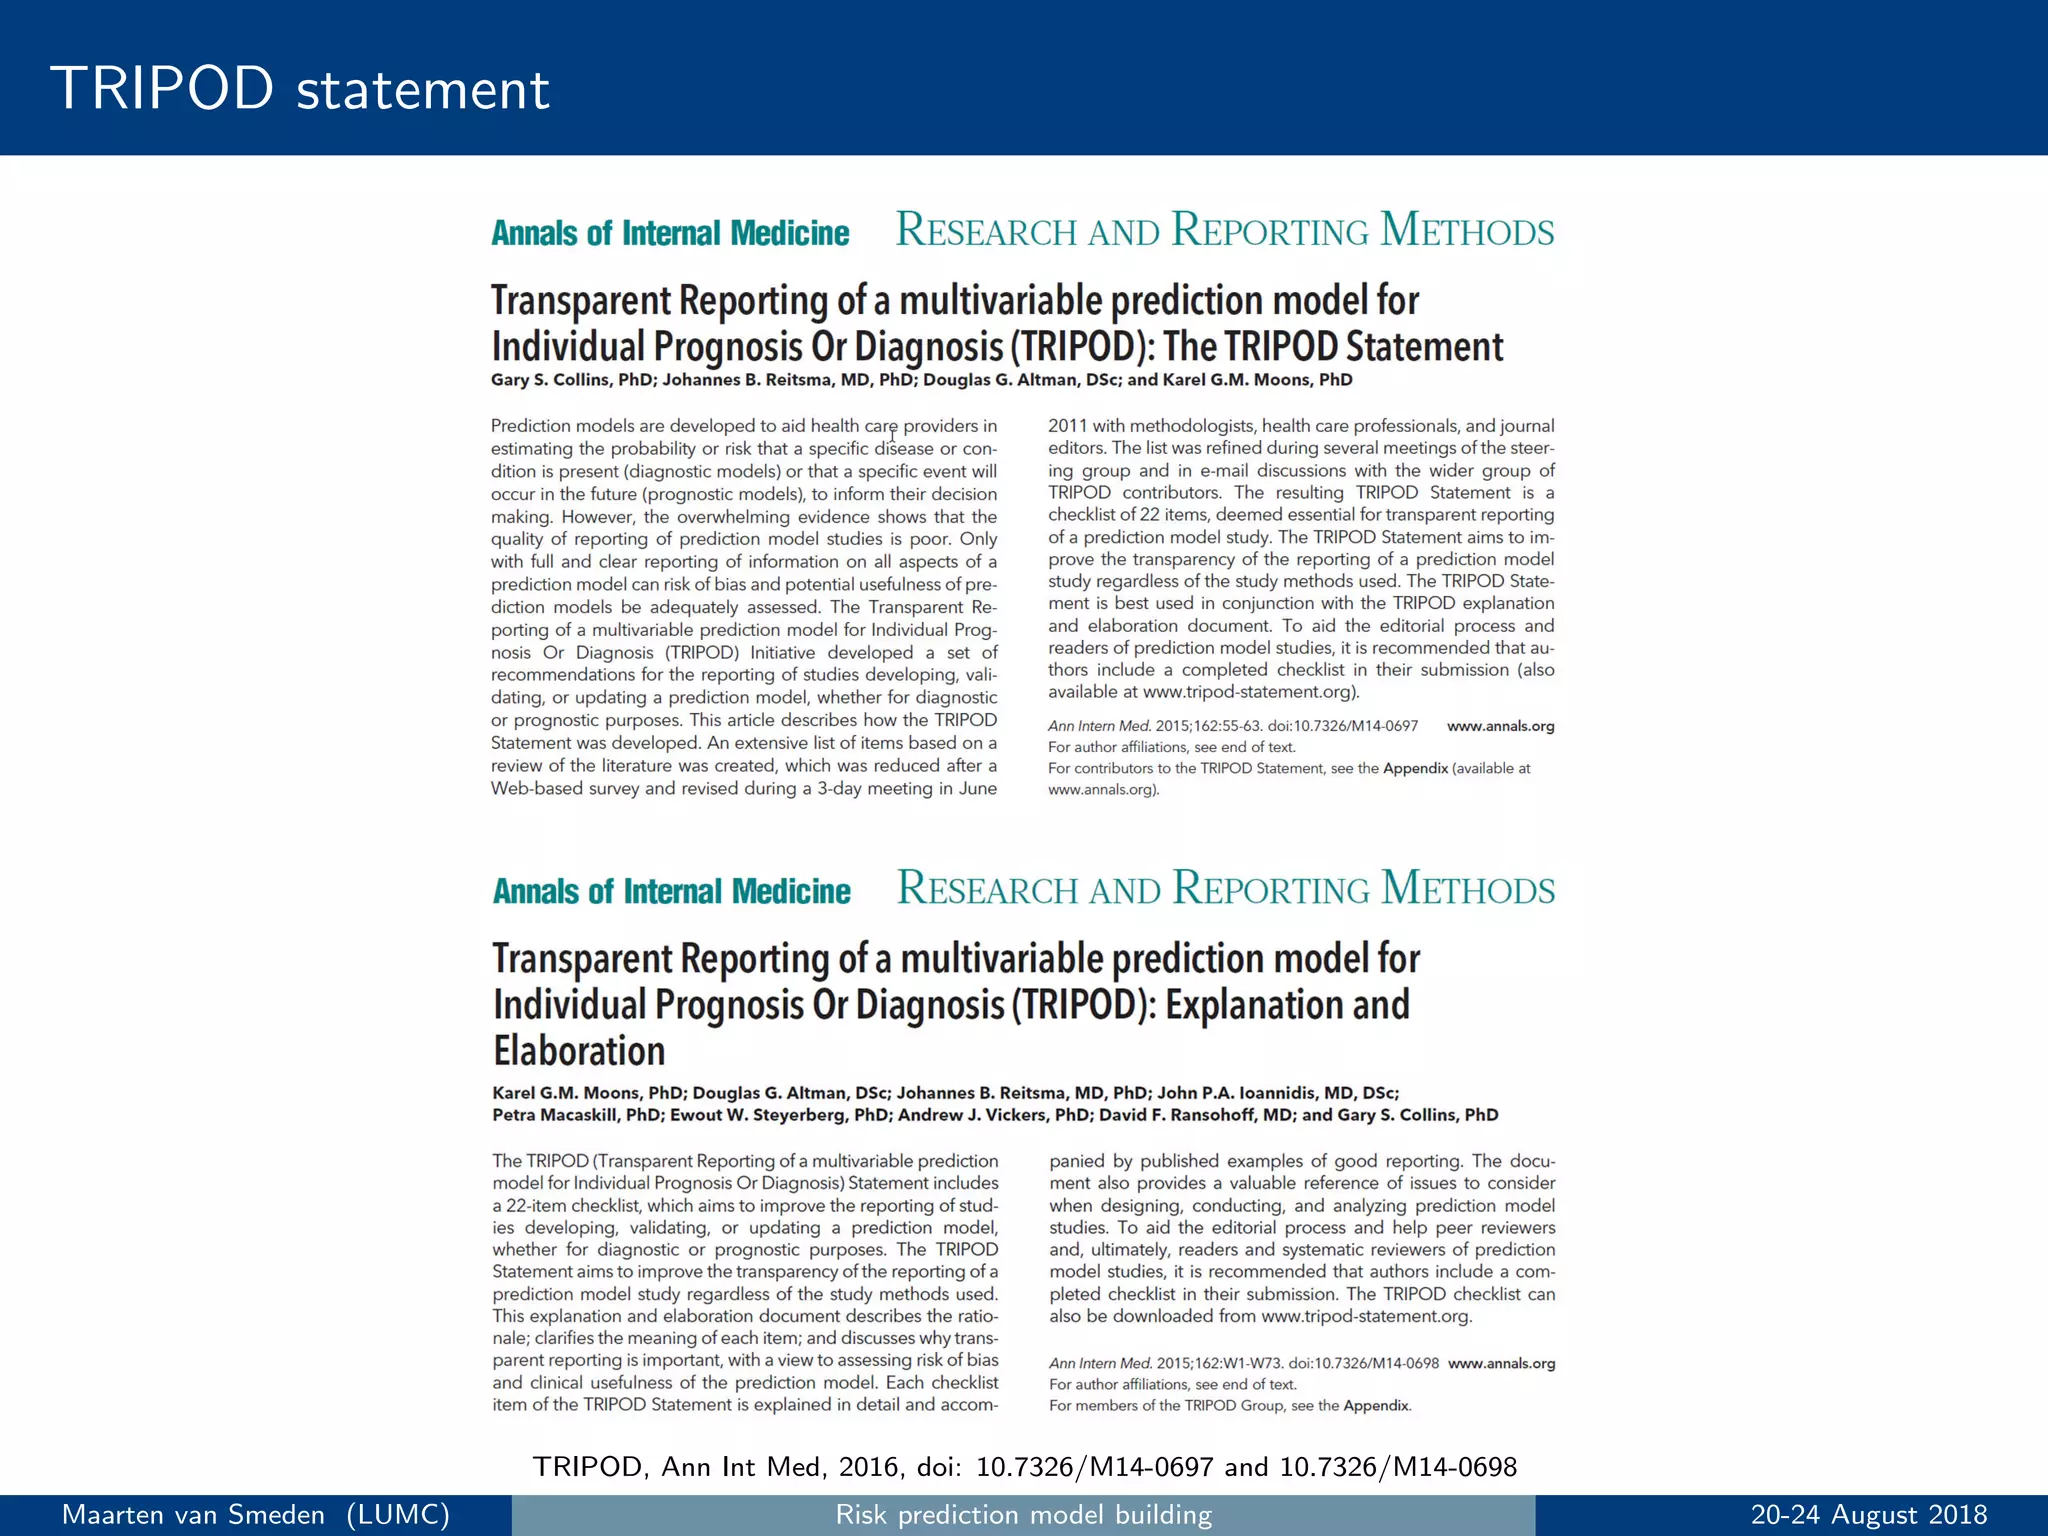
6. Present the final model following reporting guidelines like TRIPOD.
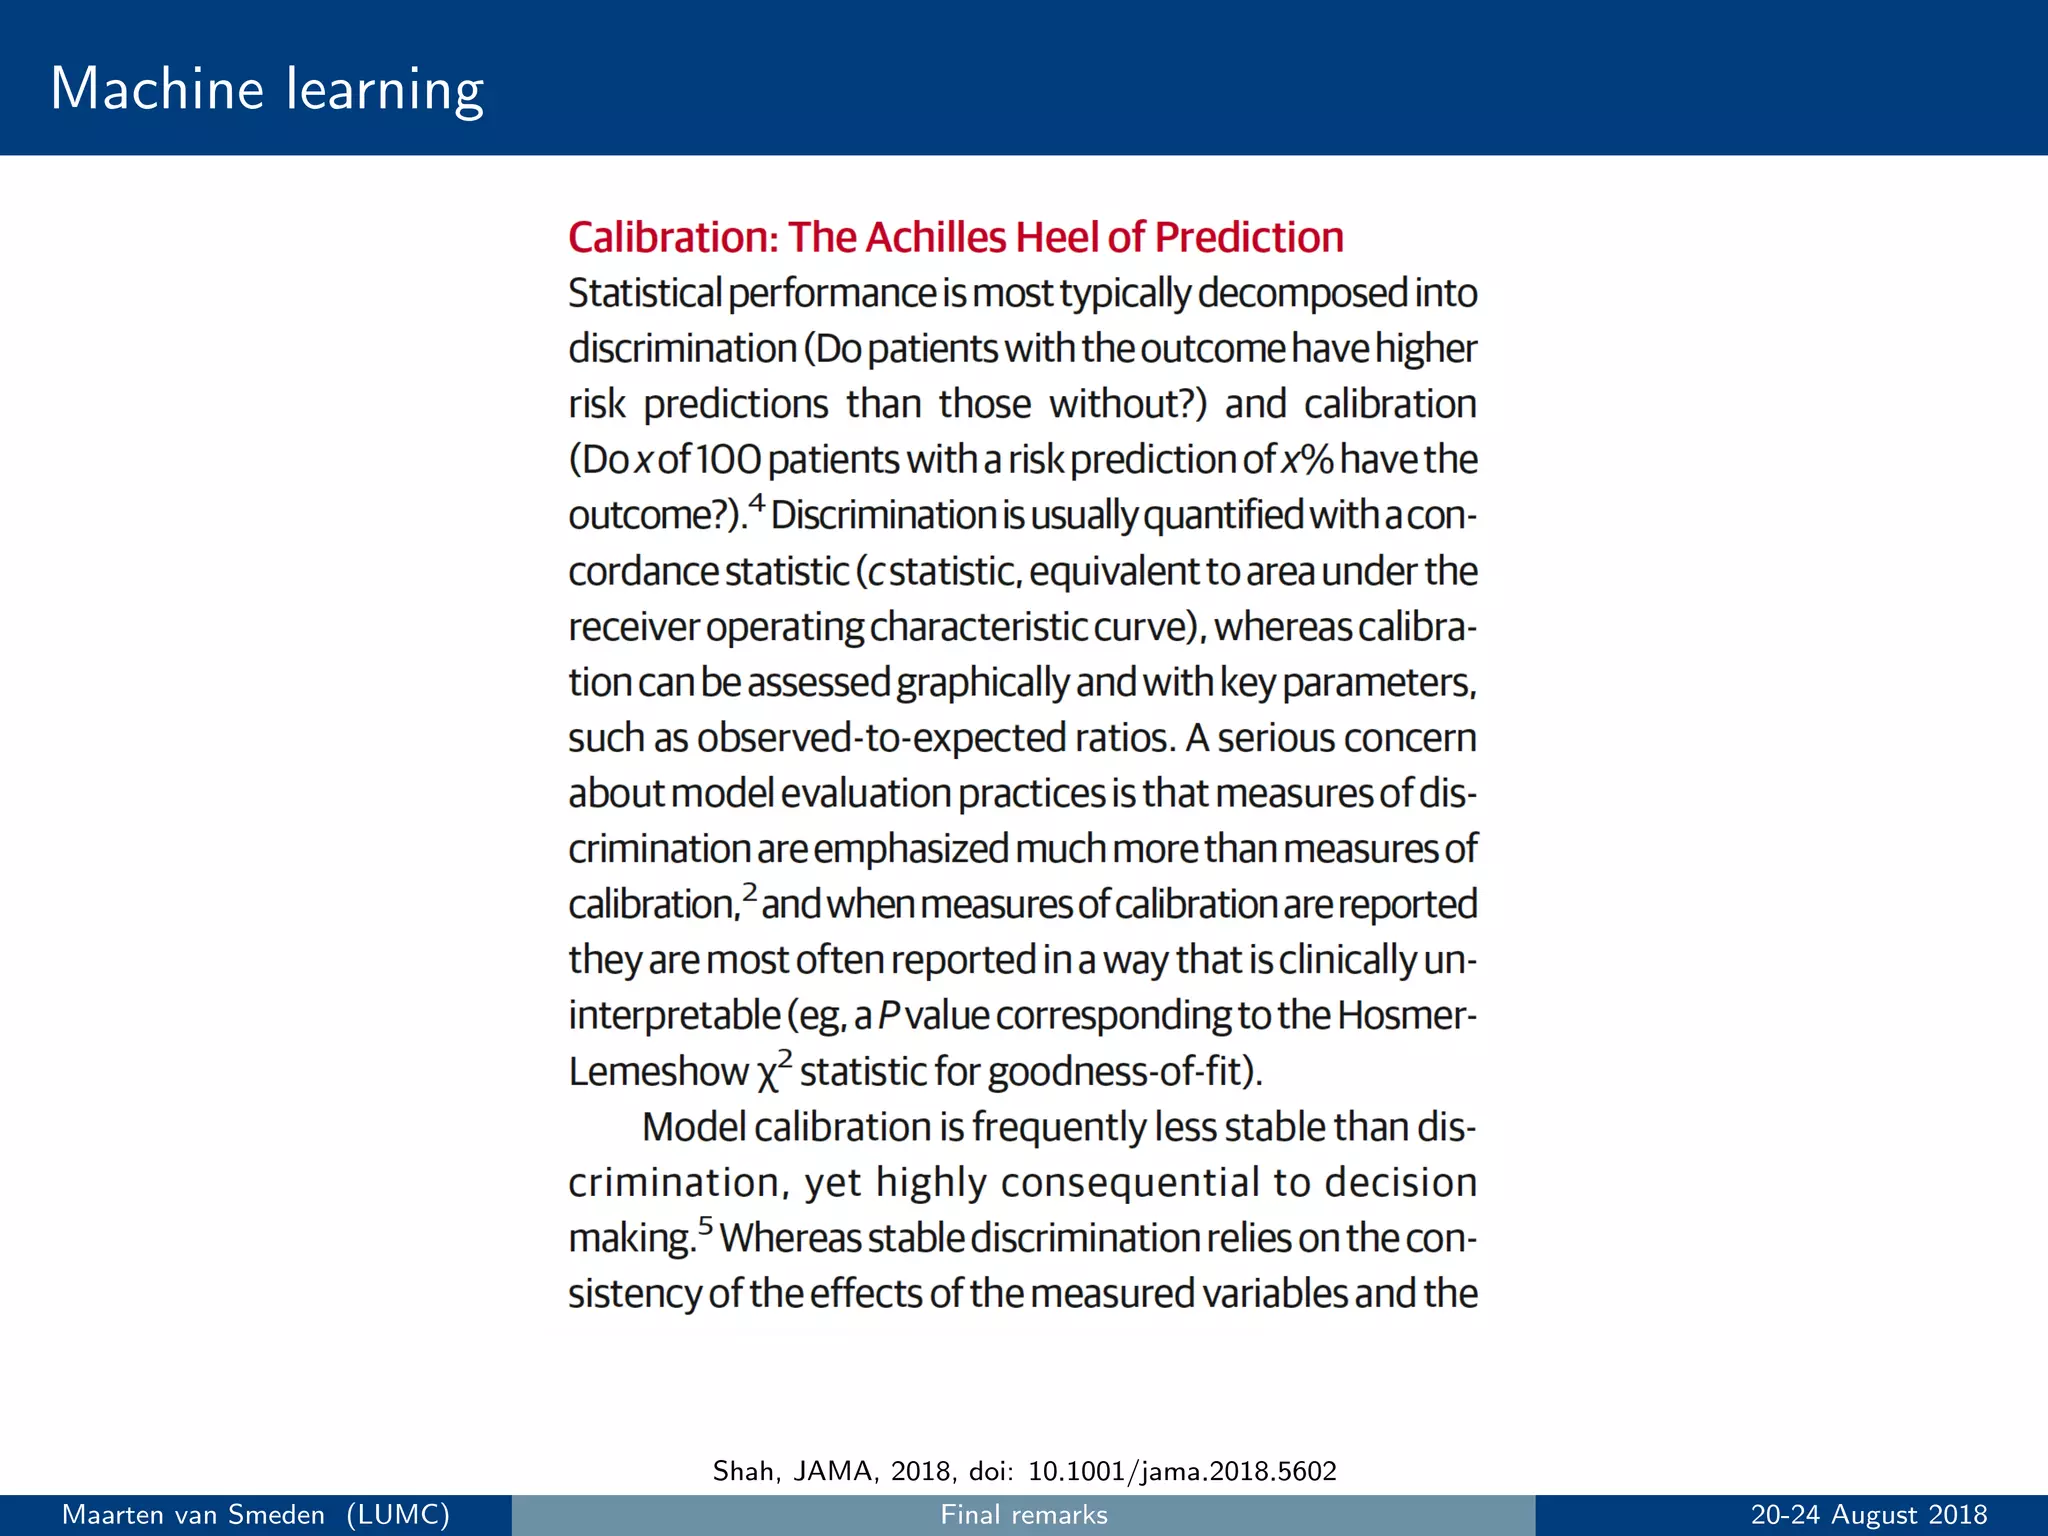
Development and evaluation of prediction models: pitfalls and solutionsMaarten van Smeden
Slides for the statistics in practice session for the Biometrisches Kolloqium (organized by the Deutsche Region der Internationalen Biometrischen Gesellschaft), 18 March 2021
Improving predictions: Lasso, Ridge and Stein's paradoxMaarten van Smeden
Slides of masterclass "Improving predictions: Lasso, Ridge and Stein's paradox" at the (Dutch) National Institute for Public Health and the Environment (RIVM)
Developing and validating statistical models for clinical prediction and prog...Evangelos Kritsotakis
Talk on clinical prediction models presented at the Joint Seminar Series in Translational and Clinical Medicine organised by the University of Crete Medical School, the Institute of Molecular Biology and Biotechnology of the Foundation for Research and Technology Hellas (IMBB-FORTH), and the University of Crete Research Center (UCRC), Heraklion [online], Greece, April 7, 2021.
Prediction, Big Data, and AI: Steyerberg, Basel Nov 1, 2019Ewout Steyerberg
Title"Clinical prediction models in the age of artificial intelligence and big data", presented at the Basel Biometrics Society seminar Nov 1, 2019, Basel, by Ewout Steyerberg, with substantial inout from Maarten van Smeden and Ben van Calster
How to combine results from randomised clinical trials on the additive scale with real world data to provide predictions on the clinically relevant scale for individual patients
Improving epidemiological research: avoiding the statistical paradoxes and fa...Maarten van Smeden
Keynote at Norwegian Epidemiological Association conference, October 26 2022. Discussing absence of evidence fallacy, Table 2 fallacy, Winner's curse and Stein's paradox.
The history of p-values is covered to try and shed light on a mystery: why did Student and Fisher agree numerically but disagree in terms of interpretation.?
Presentation on similarities and differences between statistical and machine learning research fields for the @UM_MiCHAMP Big Data & AI in Health Seminar Series; October 21, 2022
Dichotomania and other challenges for the collaborating biostatisticianLaure Wynants
Conference presentation at ISCB 41 in the session
"Biostatistical inference in practice: moving beyond false
dichotomies"
A comment in Nature, signed by over 800 researchers, called for the scientific community to “retire statistical significance”. The responses included a call to halt the use of the term „statistically significant”, and changes in journal’s author guidelines. The leading discourse among statisticians is that inadequate statistical training of clinical researchers and publishing practices are to blame for the misuse of statistical testing. In this presentation, we search our collective conscience by reviewing ethical guidelines for statisticians in light of the p-value crisis, examine what this implies for us when conducting analyses in collaborative work and teaching, and whether the ATOM (accept uncertainty; be thoughtful, open and modest) principles can guide us.
Unfortunately, some have interpreted Numbers Needed to Treat as indicating the proportion of patients on whom the treatment has had a causal effect. This interpretation is very rarely, if ever, necessarily correct. It is certainly inappropriate if based on a responder dichotomy. I shall illustrate the problem using simple causal models.
One also sometimes encounters the claim that the extent to which two distributions of outcomes overlap from a clinical trial indicates how many patients benefit. This is also false and can be traced to a similar causal confusion.
A comment in Nature, signed by over 800 researchers, called for a rise up against statistical significance. This was followed by a special issue of The American Statistician aimed at halting the use of the term "statistically significant", and new guidelines for statistical reporting in the New England Journal of Medicine. These slides discuss the broader context of the "p-value crisis" and alternatives for communicating the conclusions after statistical analyses.
Target audience: Medical researchers; Scientists involved in conducting or interpreting analyses and communicating the results of scientific research, as well as readers of scientific publications.
Learning objectives:
To understand the context of the reproducibility crisis in medical research.
To learn about problems with p-values and alternatives to report findings.
To understand how (not) to interpret significant and insignificant findings.
To learn how to communicate research findings in a modest, thoughtful, and transparent way.
How to establish and evaluate clinical prediction models - StatsworkStats Statswork
A clinical prediction model can be used in various clinical contexts, including screening for asymptomatic illness, forecasting future events such as disease, and assisting doctors in their decision-making and health education. Despite the positive effects of clinical prediction models on practice, prediction modelling is a difficult process that necessitates meticulous statistical analysis and sound clinical judgments. Statswork offers statistical services as per the requirements of the customers. When you Order statistical Services at Statswork, we promise you the following always on Time, outstanding customer support, and High-quality Subject Matter Experts.
Read More With Us: https://bit.ly/3dxn32c
Why Statswork?
Plagiarism Free | Unlimited Support | Prompt Turnaround Times | Subject Matter Expertise | Experienced Bio-statisticians & Statisticians | Statistics across Methodologies | Wide Range of Tools & Technologies Supports | Tutoring Services | 24/7 Email Support | Recommended by Universities
Contact Us:
Website: www.statswork.com
Email: info@statswork.com
United Kingdom: 44-1143520021
India: 91-4448137070
WhatsApp: 91-8754446690
Nursing research is research that provides evidence used to support nursing practices. Nursing, as an evidence-based area of practice, has been developing since the time of Florence Nightingale to the present day, where many nurses now work as researchers based in universities as well as in the health care setting.
An excellent article that uses predictive and optimization methods to reduce hospital readmissions.
Another great article, "Reducing hospital readmissions by integrating empirical prediction with resource optimization" (Helm, Alaeddini, Stauffer, Bretthaur, and Skolarus, 2016) describes how Machine Learning modeling tools were used to determine the root-causes and individualized estimation of readmissions. The post-discharge monitoring schedule and workplans were then optimized to patient changes in health states.
How to establish and evaluate clinical prediction models - StatsworkStats Statswork
A clinical prediction model can be used in various clinical contexts, including screening for asymptomatic illness, forecasting future events such as disease, and assisting doctors in their decision-making and health education. Despite the positive effects of clinical prediction models on practice, prediction modeling is a difficult process that necessitates meticulous statistical analysis and sound clinical judgments. Statswork offers statistical services as per the requirements of the customers. When you Order statistical Services at Statswork, we promise you the following always on Time, outstanding customer support, and High-quality Subject Matter Experts.
Read More With Us: https://bit.ly/3dxn32c
Why Statswork?
Plagiarism Free | Unlimited Support | Prompt Turnaround Times | Subject Matter Expertise | Experienced Bio-statisticians & Statisticians | Statistics across Methodologies | Wide Range of Tools & Technologies Supports | Tutoring Services | 24/7 Email Support | Recommended by Universities
Contact Us:
Website: www.statswork.com
Email: info@statswork.com
United Kingdom: 44-1143520021
India: 91-4448137070
WhatsApp: 91-8754446690
Due to the advancements in various data acquisition and storage technologies, different disciplines have attained the ability to not only accumulate a wide variety of data but also to monitor observations over longer time periods. In many real-world applications, the primary objective of monitoring these observations is to estimate when a particular event of interest will occur in the future. One of the major difficulties in handling such problem is the presence of censoring, i.e., the event of interests is unobservable in some instance which is either because of time limitation or losing track. Due to censoring, standard statistical and machine learning based predictive models cannot readily be applied to analyze the data. An important subfield of statistics called survival analysis provides different mechanisms to handle such censored data problems. In addition to the presence of censoring, such time-to-event data also encounters several other research challenges such as instance/feature correlations, high-dimensionality, temporal dependencies, and difficulty in acquiring sufficient event data in a reasonable amount of time. To tackle such practical concerns, the data mining and machine learning communities have started to develop more sophisticated and effective algorithms that either complement or compete with the traditional statistical methods in survival analysis. In spite of the importance of this problem and relevance to real-world applications, this research topic is scattered across various disciplines. In this tutorial, we will provide a comprehensive and structured overview of both statistical and machine learning based survival analysis methods along with different applications. We will also discuss the commonly used evaluation metrics and other related topics. The material will be coherently organized and presented to help the audience get a clear picture of both the fundamentals and the state-of-the-art techniques.
38 www.e-enm.org
Endocrinol Metab 2016;31:38-44
http://dx.doi.org/10.3803/EnM.2016.31.1.38
pISSN 2093-596X · eISSN 2093-5978
Review
Article
How to Establish Clinical Prediction Models
Yong-ho Lee1, Heejung Bang2, Dae Jung Kim3
1Department of Internal Medicine, Yonsei University College of Medicine, Seoul, Korea; 2Division of Biostatistics, Department
of Public Health Sciences, University of California Davis School of Medicine, Davis, CA, USA; 3Department of Endocrinology
and Metabolism, Ajou University School of Medicine, Suwon, Korea
A clinical prediction model can be applied to several challenging clinical scenarios: screening high-risk individuals for asymp-
tomatic disease, predicting future events such as disease or death, and assisting medical decision-making and health education.
Despite the impact of clinical prediction models on practice, prediction modeling is a complex process requiring careful statisti-
cal analyses and sound clinical judgement. Although there is no definite consensus on the best methodology for model develop-
ment and validation, a few recommendations and checklists have been proposed. In this review, we summarize five steps for de-
veloping and validating a clinical prediction model: preparation for establishing clinical prediction models; dataset selection;
handling variables; model generation; and model evaluation and validation. We also review several studies that detail methods
for developing clinical prediction models with comparable examples from real practice. After model development and vigorous
validation in relevant settings, possibly with evaluation of utility/usability and fine-tuning, good models can be ready for the use
in practice. We anticipate that this framework will revitalize the use of predictive or prognostic research in endocrinology, leading
to active applications in real clinical practice.
Keywords: Clinical prediction model; Development; Validation; Clinical usefulness
INTRODUCTION
Hippocrates emphasized prognosis as a principal component of
medicine [1]. Nevertheless, current medical investigation
mostly focuses on etiological and therapeutic research, rather
than prognostic methods such as the development of clinical
prediction models. Numerous studies have investigated wheth-
er a single variable (e.g., biomarkers or novel clinicobiochemi-
cal parameters) can predict or is associated with certain out-
comes, whereas establishing clinical prediction models by in-
corporating multiple variables is rather complicated, as it re-
quires a multi-step and multivariable/multifactorial approach to
design and analysis [1].
Clinical prediction models can inform patients and their
physicians or other healthcare providers of the patient’s proba-
bility of having or developing a certain disease and help them
with associated decision-making (e.g., facilitating patient-doc-
tor communication based on more objective information). Ap-
Received: 9 January 2016, Revised: 14 ...
Theory and Practice of Integrating Machine Learning and Conventional Statisti...University of Malaya
The practice of medical decision making is changing rapidly with the development of innovative
computing technologies. The growing interest of data analysis in line with the advancement in data
science raises the question of whether machine learning can be integrated with conventional statistics
in health research. To help address this knowledge gap, this talk focuses on the conceptual
integration between conventional statistics and machine learning, with a direction towards health
research. The similarities and differences between the two are compared using mathematical
concepts and algorithms. The comparison between conventional statistics and machine learning
methods indicates that conventional statistics are the fundamental basis of machine learning, where
the black box algorithms are derived from basic mathematics, but are advanced in terms of
automated analysis, handling big data and providing interactive visualizations. While the nature of
both these methods are different, they are conceptually similar. The evidence produced here
concludes that conventional statistics and machine learning are best to be integrated to develop
automated data analysis tools. Health researchers may explore machine learning as a potential tool to
enhance conventional statistics in data analytics for added reliable validation measures.
Department of Health InformaticsHealth Information ManagemenLinaCovington707
Department of Health Informatics
Health Information Management Program
BINF 5520 Health Analytics
Agenda
Understanding the Need for Preoperative Risk Assessment
Applying a “Bedside” Model of Open Heart Risk Assessment
Implementing the “Bedside” Model in a Second Hospital
Open Heart Risk Assessment Today: The Society for Thoracic Surgery (STS) Model
Implications for Health Analytics
Understanding the Need for Preoperative
Risk Assessment and Stratification: The New York Experience
NYS Among First to Implement Cardiac Risk Model
Model Based on Earlier Work in New Jersey
Model Applied to All non-Federal Hospitals in NYS
Model Compared Both Hospitals and Providers
Model Calculates a Risk Adjusted Mortality Rate (RAMR)
Model Equalizes Results Based on a Hypothetical Statewide Case Mix
Health.ny.gov/statistics/diseases/cardiovascular/heart_disease/docs/2011-2013_adult_cardiac_surgery.pdf
Understanding the Need for Preoperative
Risk Assessment and Stratification: The New York Experience
NYS Department of Health Report Summarizes:
Creation of RAMR Model
Data Collection Methods
Case Mix Assumptions
Description of Patient Population
Discussion of Critical Metrics
Impact on Quality Improvement
Health.ny.gov/statistics/diseases/cardiovascular/heart_disease/docs/2011-2013_adult_cardiac_surgery.pdf
Understanding the Need for Preoperative
Risk Assessment and Stratification: The New York Experience
Table 1 compares both Observed and Risk-Adjusted Mortality Rates for Isolated CABG Surgery in NYS for 2013 discharges.
RAMR=Risk Adjusted Mortality Rate: the Provider’s Mortality Rate if the Provider’s case mix was identical to a hypothetical statewide case mix.
Health.ny.gov/statistics/diseases/cardiovascular/heart_disease/docs/2011-2013_adult_cardiac_surgery.pdf
Understanding the Need for Preoperative
Risk Assessment and Stratification: The New York Experience
Table 6 presents the data by both Hospital and Provider.
Care was taken to collapse data when insufficient individual performance metrics were available.
This report was publically available via the NYS Department of Health website, and it can be found at the link below.
How did Cardiac Surgeons begin considering these issues?
These efforts actually started in the mid-1980s at a hospital in New Jersey.
Health.ny.gov/statistics/diseases/cardiovascular/heart_disease/docs/2011-2013_adult_cardiac_surgery.pdf
Developing and Implementing a “Bedside Estimation of Risk”
Model of Open Heart Risk Stratification
This work, which was begun in the mid-1980s, discussed the need for the development of a clinical model which helps surgeons when discussing Open Heart Risk with patients.
The authors conclusively demonstrate the need for a “bedside scoring system” which facilitates provider-patient dialogue.
Many of the subsequent risk models were, in some part, based on this work.
Implementing the “Bedside” Model in a Second Hospital
The Canadian authors implement the model ...
A comprehensive study on disease risk predictions in machine learning IJECEIAES
Over recent years, multiple disease risk prediction models have been developed. These models use various patient characteristics to estimate the probability of outcomes over a certain period of time and hold the potential to improve decision making and individualize care. Discovering hidden patterns and interactions from medical databases with growing evaluation of the disease prediction model has become crucial. It needs many trials in traditional clinical findings that could complicate disease prediction. A Comprehensive study on different strategies used to predict disease is conferred in this paper. Applying these techniques to healthcare data, has improvement of risk prediction models to find out the patients who would get benefit from disease management programs to reduce hospital readmission and healthcare cost, but the results of these endeavors have been shifted.
Prediction of the risk of developing heart disease using logistic regressionIJECEIAES
Heart disease (HD) accounts for more deaths every year than other illnesses. World Health Organization (WHO) assessed 17.9 million life losses caused by heart disease in 2016, demonstrating 31% of all international life losses. Three-quarters of these life losses occur in low and middle-income nations. Machine learning (ML), due to advanced precision in pattern recognition and classification, demonstrates to be in effect in complementing decisionmaking and threat prediction from the huge number of HD data created by the healthcare sector. Thus, this study aims to develop a logistic regression model (LRM) for predicting the risk of getting HD in ten years. The study explores the different methodologies for improving the performance of base LRM for predicting whether a person gets HD after ten years or not. The result demonstrates the capability of LRM in predicting the risks of getting HD after ten years. The LRM achieves 97.35% accuracy with the recursive feature elimination and random under-sampling. This implies that the LRM can play an important role in precautionary methods to avoid the risk of HD.
The ASA president Task Force Statement on Statistical Significance and Replic...jemille6
Yoav Benjamini's slides "The ASA president Task Force Statement on Statistical Significance and Replicability” for Special Session of the (remote) Phil Stat Forum: “Statistical Significance Test Anxiety” on 11 January 2022
Because everyone matters.
IBM Health and Social Programs Summit, October 2014
Stephen Morgan
Senior Vice President and Chief Medical Officer
Carilion Clinic
Jianying Hu
Research Staff Member and Manager of Healthcare Analytics Research
IBM
Paul Grundy
Global Director of Healthcare Transformation
IBM
Similar to Introduction to prediction modelling - Berlin 2018 - Part II (20)
The absence of a gold standard: a measurement error problemMaarten van Smeden
Talk about gold standard problems and solutions in medicine and epidemiology. Invited by the department of infectious disease epidemiology, University Medical Center Utrecht
Deep Behavioral Phenotyping in Systems Neuroscience for Functional Atlasing a...Ana Luísa Pinho
Functional Magnetic Resonance Imaging (fMRI) provides means to characterize brain activations in response to behavior. However, cognitive neuroscience has been limited to group-level effects referring to the performance of specific tasks. To obtain the functional profile of elementary cognitive mechanisms, the combination of brain responses to many tasks is required. Yet, to date, both structural atlases and parcellation-based activations do not fully account for cognitive function and still present several limitations. Further, they do not adapt overall to individual characteristics. In this talk, I will give an account of deep-behavioral phenotyping strategies, namely data-driven methods in large task-fMRI datasets, to optimize functional brain-data collection and improve inference of effects-of-interest related to mental processes. Key to this approach is the employment of fast multi-functional paradigms rich on features that can be well parametrized and, consequently, facilitate the creation of psycho-physiological constructs to be modelled with imaging data. Particular emphasis will be given to music stimuli when studying high-order cognitive mechanisms, due to their ecological nature and quality to enable complex behavior compounded by discrete entities. I will also discuss how deep-behavioral phenotyping and individualized models applied to neuroimaging data can better account for the subject-specific organization of domain-general cognitive systems in the human brain. Finally, the accumulation of functional brain signatures brings the possibility to clarify relationships among tasks and create a univocal link between brain systems and mental functions through: (1) the development of ontologies proposing an organization of cognitive processes; and (2) brain-network taxonomies describing functional specialization. To this end, tools to improve commensurability in cognitive science are necessary, such as public repositories, ontology-based platforms and automated meta-analysis tools. I will thus discuss some brain-atlasing resources currently under development, and their applicability in cognitive as well as clinical neuroscience.
Seminar of U.V. Spectroscopy by SAMIR PANDASAMIR PANDA
Spectroscopy is a branch of science dealing the study of interaction of electromagnetic radiation with matter.
Ultraviolet-visible spectroscopy refers to absorption spectroscopy or reflect spectroscopy in the UV-VIS spectral region.
Ultraviolet-visible spectroscopy is an analytical method that can measure the amount of light received by the analyte.
This presentation explores a brief idea about the structural and functional attributes of nucleotides, the structure and function of genetic materials along with the impact of UV rays and pH upon them.
What is greenhouse gasses and how many gasses are there to affect the Earth.moosaasad1975
What are greenhouse gasses how they affect the earth and its environment what is the future of the environment and earth how the weather and the climate effects.
THE IMPORTANCE OF MARTIAN ATMOSPHERE SAMPLE RETURN.Sérgio Sacani
The return of a sample of near-surface atmosphere from Mars would facilitate answers to several first-order science questions surrounding the formation and evolution of the planet. One of the important aspects of terrestrial planet formation in general is the role that primary atmospheres played in influencing the chemistry and structure of the planets and their antecedents. Studies of the martian atmosphere can be used to investigate the role of a primary atmosphere in its history. Atmosphere samples would also inform our understanding of the near-surface chemistry of the planet, and ultimately the prospects for life. High-precision isotopic analyses of constituent gases are needed to address these questions, requiring that the analyses are made on returned samples rather than in situ.
Cancer cell metabolism: special Reference to Lactate PathwayAADYARAJPANDEY1
Normal Cell Metabolism:
Cellular respiration describes the series of steps that cells use to break down sugar and other chemicals to get the energy we need to function.
Energy is stored in the bonds of glucose and when glucose is broken down, much of that energy is released.
Cell utilize energy in the form of ATP.
The first step of respiration is called glycolysis. In a series of steps, glycolysis breaks glucose into two smaller molecules - a chemical called pyruvate. A small amount of ATP is formed during this process.
Most healthy cells continue the breakdown in a second process, called the Kreb's cycle. The Kreb's cycle allows cells to “burn” the pyruvates made in glycolysis to get more ATP.
The last step in the breakdown of glucose is called oxidative phosphorylation (Ox-Phos).
It takes place in specialized cell structures called mitochondria. This process produces a large amount of ATP. Importantly, cells need oxygen to complete oxidative phosphorylation.
If a cell completes only glycolysis, only 2 molecules of ATP are made per glucose. However, if the cell completes the entire respiration process (glycolysis - Kreb's - oxidative phosphorylation), about 36 molecules of ATP are created, giving it much more energy to use.
IN CANCER CELL:
Unlike healthy cells that "burn" the entire molecule of sugar to capture a large amount of energy as ATP, cancer cells are wasteful.
Cancer cells only partially break down sugar molecules. They overuse the first step of respiration, glycolysis. They frequently do not complete the second step, oxidative phosphorylation.
This results in only 2 molecules of ATP per each glucose molecule instead of the 36 or so ATPs healthy cells gain. As a result, cancer cells need to use a lot more sugar molecules to get enough energy to survive.
introduction to WARBERG PHENOMENA:
WARBURG EFFECT Usually, cancer cells are highly glycolytic (glucose addiction) and take up more glucose than do normal cells from outside.
Otto Heinrich Warburg (; 8 October 1883 – 1 August 1970) In 1931 was awarded the Nobel Prize in Physiology for his "discovery of the nature and mode of action of the respiratory enzyme.
WARNBURG EFFECT : cancer cells under aerobic (well-oxygenated) conditions to metabolize glucose to lactate (aerobic glycolysis) is known as the Warburg effect. Warburg made the observation that tumor slices consume glucose and secrete lactate at a higher rate than normal tissues.
insect taxonomy importance systematics and classification
Introduction to prediction modelling - Berlin 2018 - Part II
1. Advanced Epidemiologic Methods
causal research and prediction modelling
Prediction modelling topics 5 - 7
Maarten van Smeden
LUMC, Department of Clinical Epidemiology
20-24 August 2018
Maarten van Smeden (LUMC) Risk prediction model building 20-24 August 2018
2. Outline
1 Introduction to prediction modelling
2 Example: predicting systolic blood pressure
3 Risk and probability
4 Risk prediction modelling: rationale and context
5 Risk prediction model building
6 Overfitting
7 External validation and updating
Maarten van Smeden (LUMC) Risk prediction model building 20-24 August 2018
4. TRIPOD statement
TRIPOD, Ann Int Med, 2016, doi: 10.7326/M14-0697 and 10.7326/M14-0698
Maarten van Smeden (LUMC) Risk prediction model building 20-24 August 2018
5. Steps of model development
• Research design and data collection
• Choice of statistical model, outcome and (candidate) predictors
• Initial data analysis
• Descriptive analysis
• Model specification and estimation
• Evaluation of performance and internal validation
• Presentation
Maarten van Smeden (LUMC) Risk prediction model building 20-24 August 2018
6. Steps of model development
• Research design and data collection
• Choice of statistical model, outcome and (candidate) predictors
• Initial data analysis
• Descriptive analysis
• Model specification and estimation
• Evaluation of performance and internal validation
• Presentation
Maarten van Smeden (LUMC) Risk prediction model building 20-24 August 2018
7. Research design: aims
• Point of intended use of the risk model
- Primary care (paper/computer/app)?
- Secondary care (beside)?
- Low resource setting?
• Complexity
- Number of predictors?
- Transparency of calculation?
- Should it be fast?
Maarten van Smeden (LUMC) Risk prediction model building 20-24 August 2018
8. Research design: design of data collection
• Diagnostic risk prediction:
cross-sectional design (e.g.
consecutive patients):
measurement of predictors
at baseline + reference
standard (”gold standard” is
often a misnomer)
• Prognostic risk prediction:
(prospective) cohort study:
measurement of predictors at
baseline + follow-up until
event occurs (time-horizon)
Figure: Moons, Ann Int Med, 2016, doi: 10.7326/M14-0698
Alternative data collection designs:
• Randomized trial: typically small, large treatment effects, strict eligibility criteria
• Routine care data: often suffering from data quality issues (misclassifications, missing data)
• Case-control study: generally unsuitable for risk prediction
Maarten van Smeden (LUMC) Risk prediction model building 20-24 August 2018
9. Steps of model development
• Research design and data collection
• Choice of statistical model, outcome and (candidate) predictors
• Initial data analysis
• Descriptive analysis
• Model specification and estimation
• Evaluation of performance and internal validation
• Presentation
Maarten van Smeden (LUMC) Risk prediction model building 20-24 August 2018
10. Possible outcomes
Types of outcomes
• Death (e.g. 10 day in hospital mortality)
• Hospital readmission (e.g. 1 year after CVD event)
• Developing a disease (e.g. 10 year risk of Diabetes Type-II)
• Bleeding risk (Thrombosis)
• Complications after surgery
• Response to treatment
Considerations
• Relevant time horizon for risk essential
• Broad composite outcomes not informative
• Misclassification errors can be influential on risk prediction
Maarten van Smeden (LUMC) Risk prediction model building 20-24 August 2018
11. Possible candidate predictors
General advise: Use clinical knowledge and (systematic) reviews to identify predictors that are
plausibly related to the outcome of interest
Type of predictors
• Demographics (age, sex, SES)
• Patient history (previous disease)
• Physical examination (may be subjective)
• Diagnostic tests (imaging, ECG)
• Biomarkers
• Disease characteristics (diagnosis, severity)
• Therapies received
• Physical functioning
• . . .
Include?
• Unique contribution to prediction
• Cost of measurement
• Speed of measurement
• Invasiveness of measurement
• Availability in clinical practice
• Measurement objectivity
• Measurement quality
• Model parsimony
• . . .
Maarten van Smeden (LUMC) Risk prediction model building 20-24 August 2018
12. Choice of statistical model
Outcome Regression model Example
Continuous linear (OLS) blood pressure at discharge
Binary
(death/alive)
binary logistic EuroSCORE: 30 day mortality
after cardiac surgery
Survival (time to
event)
Cox model Framingham risk score: 10-year
cardio-vascular disease
Categorical multinomial logistic Operative delivery (spontaneous,
instrumental, caesarean section)
Note: many alternative regression models exist for similar outcomes (e.g. weighted linear, probit, Weibull, proportional odds)
Machine learning methods and artificial intelligence:
so far shown to give little advantage or to perform worse than regression models based risk
prediction (more about this tomorrow)
EuroSCORE: 10.1016/S0195-668X(02)00799-6; Framingham: 10.1161/CIRCULATIONAHA.107.699579; Operative delivery:
10.1111/j.1471-0528.2012.03334.x
Maarten van Smeden (LUMC) Risk prediction model building 20-24 August 2018
13. Steps of model development
• Research design and data collection
• Choice of statistical model, outcome and (candidate) predictors
• Initial data analysis
• Descriptive analysis
• Model specification and estimation
• Evaluation of performance and internal validation
• Presentation
Maarten van Smeden (LUMC) Risk prediction model building 20-24 August 2018
14. Initial data analysis and descriptive analysis
Risk model for venous thromboembolism in postpartum women: Abdul Sultan, BMJ, 2016, doi:10.1136/bmj.i6253
Maarten van Smeden (LUMC) Risk prediction model building 20-24 August 2018
15. Selecting predictors on univariable associations
• The association between one particular predictor and the outcome is a univariable
association ⇒ informative at the initial data analysis and descriptive analysis step
Univariable selection:
• Is the use of a p-value criterion (p < .05) for selecting predictors for inclusion in the
prediction model based on the univariable relations between predictors and the outcome
• Is commonly used for selecting predictors
• Is inappropriate as it rejects important predictors
• Is inappropriate as it selects unimportant predictors
• only works for completely uncorrelated predictor variables, which they never are
Bottom line: don’t use univariable selection to select or reject predictors
Read more: Sun, JCE, 1996, doi: 10.1016/0895-4356(96)00025-X
Maarten van Smeden (LUMC) Risk prediction model building 20-24 August 2018
16. Missing data
Discussed extensively on day 2.
Missing data often poses a non-ignorable problem for prediction
models, requiring extra steps and efforts when developing and
validating the model. But there is consensus on how to deal with
particular forms of missing data (e.g. multiple imputation by chained
equations when MAR, sensitivity analyses when MNAR). Missing
data should be prevented as much as possible.
Read more: Vergouwe, JCE, 2010, doi: 10.1016/j.jclinepi.2009.03.017
Maarten van Smeden (LUMC) Risk prediction model building 20-24 August 2018
17. Steps of model development
• Research design and data collection
• Choice of statistical model, outcome and (candidate) predictors
• Initial data analysis
• Descriptive analysis
• Model specification and estimation
• Evaluation of performance and internal validation
• Presentation
Maarten van Smeden (LUMC) Risk prediction model building 20-24 August 2018
18. Model specification
f(X) → linear predictor (lp)
Simplest case: lp = β0 + β1x1 + . . . + βPxP (only ”main effects”)
linear regression
Y = lp + ε
logistic regression
ln{Pr(Y = 1)/(1 – Pr(Y = 1))} = lp
Pr(Y = 1) = 1/(1 + exp{–lp})
Cox regression
h(t) = h0(t)exp(lp)
Maarten van Smeden (LUMC) Risk prediction model building 20-24 August 2018
19. Continuous predictors
• Many predictors are measured on a continuous scale
- Age
- Systolic/diastolic blood pressure
- HDL/LDL
- Biomarkers
- . . .
• Decision required on how to include continuous predictors in the modelling
• Allow for nonlinearity
- Polynomials (e.g. quadratic)
- Splines functions
- Fractional polynomials
Read more: Collins, Stat Med, 2016, doi: 10.1002/sim.6986
Maarten van Smeden (LUMC) Risk prediction model building 20-24 August 2018
21. Dichotomania
Dichotomania is an obsessive compulsive disorder to which medical advisors in
particular are prone [. . .]. Show a medical advisor some continuous measurements
and he or she immediately wonders. Hmm, how can I make these clinically
meaningful? Where can I cut them in two? What ludicrous side conditions can I
impose on this?
Stephen Senn
Quote source: Senn, http://www.senns.demon.co.uk/Geep.htm
Dichotomising predictors is unfortunately very common in prediction modeling
• Example: create a new predictor with 0 if age < 50 years (’young’); 1 if age ≥ 50 years
(’old’)
• Throws away precious information for risk prediction
• Unrealistic, it assumes those immediately above and below the cut point have different risk
• Reduces predictive accuracy of the model
Avoid dichotomising predictors!
Maarten van Smeden (LUMC) Risk prediction model building 20-24 August 2018
22. Dichotomania
Source: Royston, Stat Med, 2006, doi: 10.1002/sim.2331
Maarten van Smeden (LUMC) Risk prediction model building 20-24 August 2018
23. Steps of model development
• Research design and data collection
• Choice of statistical model, outcome and (candidate) predictors
• Initial data analysis
• Descriptive analysis
• Model specification and estimation
• Evaluation of performance and internal validation
• Presentation
Maarten van Smeden (LUMC) Risk prediction model building 20-24 August 2018
24. Model predictive performance
Source: Steyerberg, Epidemiology, 2010, doi: 10.1097/EDE.0b013e3181c30fb2
Maarten van Smeden (LUMC) Risk prediction model building 20-24 August 2018
29. Discrimination
• Sensitivity/specificity trade-off
• Arbitrary choice threshold → many
possible sensitivity/specificity pairs
• All pairs in 1 graph: ROC curve
• Area under the ROC-curve:
probability that a random individual
with event has a higher predicted
probability than a random individual
without event
• Area under the ROC-curve: the c-
statistic (for logistic regression) takes
on values between 0.5 (no better
than a coin-flip) and 1.0 (perfect
discrimination)
Read more: Sedgwick, BMJ, 2015, doi: 10.1136/bmj.h2464
Maarten van Smeden (LUMC) Risk prediction model building 20-24 August 2018
31. Discrimination and calibration
• Discrimination: the extent to which risks differentiate between positive and negative
outcomes
• Calibration: the extent to which estimated risks are valid
• Discrimination is usually the no. 1 performance measure
- Risk models are typically compared based discriminative performance; not on
calibration
- A risk prediction model with no discriminative performance is uninformative
- A risk prediction model that is poorly calibrated is misleading
Van Calster, JCE, 2016, doi: 10.1016/j.jclinepi.2015.12.005
Maarten van Smeden (LUMC) Risk prediction model building 20-24 August 2018
32. Overoptimism
Overoptimsm
Predictive performance evaluations are too optimistic when estimated
on the same data where the risk prediction model was developed. This
is therefore called apparent performance of the model
• Optimism can be large, especially in small datasets and with a large number of predictors
• To get a better estimate of the predictive performance:
- Internal validation (same data sample)
- External validation (other data sample, discussed in tomorrow’s lecture)
Maarten van Smeden (LUMC) Risk prediction model building 20-24 August 2018
33. Internal validation
• Evaluate performance of risk prediction model on data from the same population from
which model was developed
• Say that we start with one dataset with all data available: the original data
• Option 1: Splitting original data
- One portion to develop (’training set’); one portion to evaluate (’test set’)
- Non-random vs random split
- Generates 1 test of performance
• Option 2: Resampling from original data
- Cross-validation
- Bootstrapping
- Generates a distribution of performances
• General advice: avoid splitting (option 1) because
- Inefficient → especially when original data is small
- Usually leads to a too small test set
Read more: Steyerberg, JCE, 2001, doi: 10.1016/S0895-4356(01)00341-9
Maarten van Smeden (LUMC) Risk prediction model building 20-24 August 2018
34. Bootstrapping
Steps:
• Randomly selects individuals from the original data until a dataset of the same size is
obtained (called the bootstrap sample)
• Each time an individual is selected, they are put back into the original dataset individuals
may therefore be selected more than once in each bootstrap sample
• Repeat this process many times - say 500 - to obtain 500 bootstrap samples
• Repeat the model development process (incl non-linear effects, variable selection) on each
of the bootstrap samples
• Calculate the predictive performance of the developed models on the original data.
• Take the average over these samples to get an optimism corrected estimate of performance
of the model in the original sample.
Maarten van Smeden (LUMC) Risk prediction model building 20-24 August 2018
35. Steps of model development
• Research design and data collection
• Choice of statistical model, outcome and (candidate) predictors
• Initial data analysis
• Descriptive analysis
• Model specification and estimation
• Evaluation of performance and internal validation
• Presentation
Maarten van Smeden (LUMC) Risk prediction model building 20-24 August 2018
36. Presentation
• Make sure that information about all the estimated regression parameters are provided,
including intercept.
• Consider: adding a nomogram, developing a score chart or app
• Follow the reporting guideline TRIPOD
TRIPOD, Ann Int Med, 2016, doi: 10.7326/M14-0697 and 10.7326/M14-0698
Maarten van Smeden (LUMC) Risk prediction model building 20-24 August 2018
37. Report all estimated parameters
Maarten van Smeden (LUMC) Risk prediction model building 20-24 August 2018
39. Outline
1 Introduction to prediction modelling
2 Example: predicting systolic blood pressure
3 Risk and probability
4 Risk prediction modelling: rationale and context
5 Risk prediction model building
6 Overfitting
7 External validation and updating
Maarten van Smeden (LUMC) Overfitting 20-24 August 2018
40. Overfitting
Curse of all statistical modelling1
What you see is not what you get2
When a model is fitted that is too complex, that is it has too many free
parameters to estimate for the amount of information in the data, the worth of
the model (e.g., R2 ) will be exaggerated and future observed values will not
agree with predicted values3
Idiosyncrasies in the data are fitted rather than generalizable patterns. A
model may hence not be applicable to new patients, even when the setting of
application is very similar to the development setting4
1van Houwelingen, Stat Med, 2000, PMID: 11122504; 2Babyak, Psychosomatic Medicine, 2004, PMID: 15184705; 3Harrell, 2001, Springer, ISBN
978-1-4757-3462-1; 4 Steyerberg, 2009, Springer, ISBN 978-0-387-77244-8.
Maarten van Smeden (LUMC) Overfitting 20-24 August 2018
41. Overfitting poem
Wherry, Personnel Psychology, 1975, doi: 10.1111/j.1744-6570.1975.tb00387.x
Maarten van Smeden (LUMC) Overfitting 20-24 August 2018
43. Overfitting causes and consequences
Steyerberg, 2009, Springer, ISBN 978-0-387-77244-8.
Maarten van Smeden (LUMC) Overfitting 20-24 August 2018
44. Overfitting: typical calibration plot
• Low probabilities are predicted too low, high probabilities are predicted too high
Maarten van Smeden (LUMC) Overfitting 20-24 August 2018
46. Calibration development data: not insightful
Bell, BMJ, 2015, doi: 10.1136/bmj.h5639
Maarten van Smeden (LUMC) Overfitting 20-24 August 2018
47. How to avoid overfitting?
• Be conservative selecting/removing variable predictor variables
• Avoid stepwise selection and forward selection
• When using backward elimination use conservative p-values (e.g. p = 0.10 or 0.20)
• Apply shrinkage methods
• Sample size
Maarten van Smeden (LUMC) Overfitting 20-24 August 2018
48. Automated (stepwise) variable selection
• Selection unstable: selection and order of entry often overinterpreted
• Limited power to detect true effects: predictive ability suffers, underfitting
• Risk of false-positive associations: multiple testing, overfitting
• Inference biased: P-values exaggerated; standard errors too small
• Estimated coefficients biased: testimation
Figure: Steyerberg, JCE, 2018, doi: 10.1016/j.jclinepi.2017.11.013; Read more: Heinze, Biometrical J, 2018, doi: 10.1002/bimj.201700067
Maarten van Smeden (LUMC) Overfitting 20-24 August 2018
49. 1956: Steins paradox
Stein, 1956: http://www.dtic.mil/dtic/tr/fulltext/u2/1028390.pdf
Maarten van Smeden (LUMC) Overfitting 20-24 August 2018
50. 1956: Steins paradox
In words (rather simplified):
When one has three or more units (say, individuals), and for each unit one can
calculate an average score (say, average blood pressure), then the best guess
of future observations (blood pressure) for each unit is NOT its average score
Maarten van Smeden (LUMC) Overfitting 20-24 August 2018
51. 1961: James-Stein estimator: the next Berkley Symposium
James, 1961: https://projecteuclid.org/euclid.bsmsp/1200512173
Maarten van Smeden (LUMC) Overfitting 20-24 August 2018
52. 1977: Baseball example
Efron, Scientific American, 1977, www.jstor.org/stable/24954030
Maarten van Smeden (LUMC) Overfitting 20-24 August 2018
53. Lessons from Stein’s paradox
• Stein’s paradox is among the most surprising (and initially doubted) phenomena in statistics
• After the James-Stein paradox many other shrinkage estimators were developed. Now a
large family: shrinkage estimators reduce prediction variance to an extent that outweighs
the bias that is introduced (bias/variance trade-off)
Bias, variance and prediction error
Expected prediction error = irreducible error + bias + variance2
Friedman et al. (2001). The elements of statistical learning. Vol. 1. New York: Springer series.
Maarten van Smeden (LUMC) Overfitting 20-24 August 2018
64. Was I just lucky?
No: 5% reduction in MSPE just by shrinkage estimator (Van Houwelingen and le Cessie’s
heuristic shrinkage factor)
Maarten van Smeden (LUMC) Overfitting 20-24 August 2018
67. Shrinkage estimators
Popular shrinkage approaches for prediction modeling:
• Bootstrap
• Heuristic formula
• Firths correction
• Ridge regression
• LASSO regression
• Bayesian prediction modeling
• Note: shrinkage is in general particularly beneficial for calibration of the risk prediction
model and less so for its discrimination
Further reading: Pavlou, BMJ, 2015, doi: 10.1136/bmj.h3868; van Smeden, SMMR, 2018, doi: 10.1177/0962280218784726
Maarten van Smeden (LUMC) Overfitting 20-24 August 2018
68. Sample size
• Sample size is important factor driving performance of risk prediction models
• No consensus on what counts as an adequate sample size
• General principles for adequate sample size:
- Effective sample size driven by number of observations in the group with or without
the outcome predicted whichever is the smallest, per convention called ”events”
- EPV: the number of events divided by the number of candidate predictors is a
common ratio to describe model parsimony vs effective sample size
- EPV < 10 is ”danger zone”: avoid
- EPV much larger than 10 is often needed to a prediction model that gives precise risk
estimates
Further reading: van Smeden, SMMR, 2018, doi: 10.1177/0962280218784726
Maarten van Smeden (LUMC) Overfitting 20-24 August 2018
69. Sample size and shrinkage
Benefit of regression shrinkage dependents on:
• Sample size
• Correlations between predictor variables
• Sparsity of outcome and predictor variables
• The irreducible error component
• Type of outcome (continuous, binary, count, time-to-event,...)
• Number of candidate predictor variables
• Non-linear/interaction effects
• Weak/strong predictor balance
How to know that there is no need for shrinkage at some sample size?
Advice: always apply shrinkage regardless of sample size and compare to non-shrunken model.
Very large differences may indicate a variety of non-identified issues that may need fixing →
contact statistician
Maarten van Smeden (LUMC) Overfitting 20-24 August 2018
70. Outline
1 Introduction to prediction modelling
2 Example: predicting systolic blood pressure
3 Risk and probability
4 Risk prediction modelling: rationale and context
5 Risk prediction model building
6 Overfitting
7 External validation and updating
Maarten van Smeden (LUMC) External validation and updating 20-24 August 2018
71. Prediction model landscape
• > 110 models for prostate cancer (Shariat 2008)
• > 100 models for traumatic brain injury (Perel 2006)
• 83 models for stroke (Counsell 2001)
• 54 models for breast cancer (Altman 2009)
• 43 models for type 2 diabetes (Collins 2011; Dieren 2012)
• 31 models for osteoporotic fracture (Steurer 2011)
• 29 models in reproductive medicine (Leushuis 2009)
• 26 models for hospital readmission (Kansagara 2011)
• > 25 models for length of stay in cardiac surgery (Ettema 2010)
• > 350 models for cardiovascular disease outcomes (Damen 2016)
• What if your model becomes number 300-something?
• What about the clinical benefit/utility of number 300-something?
Courtesy of KGM Moons and GS Collins for this overview
Maarten van Smeden (LUMC) External validation and updating 20-24 August 2018
72. Before developing yet another model, know that:
• For most diseases / outcomes risk prediction models have already been developed
→ Only few are externally validated or updated
→ Even fewer are disseminated and used in clinical practice
• Use your data for external validation of models already developed!
Maarten van Smeden (LUMC) External validation and updating 20-24 August 2018
73. External validation
• Study of the predictive performance of the risk prediction model in data of new subjects
that were not used to develop it
• The larger the difference between development and validation data, the more likely the
model will be useful in (as yet) untested populations
- Case-mix (distributions of predictors and outcome)
• External validation is the strongest test of a prediction model
- Different time period (’temporal’)
- Different areas/centres (’geographical’)
- Ideally by independent investigators
Collins, BMJ, 2012, doi: 10.1136/bmj.e3186
Maarten van Smeden (LUMC) External validation and updating 20-24 August 2018
74. External validation is not
• It is not repeating model development steps
• Whether the same predictors, regression coefficients and predictive performance would be
found in new data is not in question
• It is not re-estimating a previously developed model
• Updating regression coefficients is sometimes done when the performance at external
validation is unsatisfactory. This can be viewed as model (model revision) and calls for new
external validation
Maarten van Smeden (LUMC) External validation and updating 20-24 August 2018
75. What to expect at external validation
• Decreased predictive performance compared to development is expected
• Many possible causes:
- Overfitting of the model at development
- Different type of patients (case mix)
- Different outcome occurrence
- Differences in care over time
- Differences in treatments
- Improvement in measurements over time (e.g.previous CTs less accurate than spiral
CT for PE detection)
- . . .
• When predictive performance is judged too low → consider model updating
Maarten van Smeden (LUMC) External validation and updating 20-24 August 2018
76. Model updating
• Recalibration in the large: re-estimate the intercept
• Recalibration: re-estimate the intercept + additional factor that multiplies all coefficients
with same factor (calibration slope)
Table from Vergouwe, Stat Med, 2017, doi: 10.1002/sim.7179
Maarten van Smeden (LUMC) External validation and updating 20-24 August 2018
77. Sample size for external validation
Vergouwe, JCE, 2005, doi: 10.1016/j.jclinepi.2004.06.017; Collins, Stat Med, 2015, doi: 10.1002/sim.6787
Maarten van Smeden (LUMC) External validation and updating 20-24 August 2018
78. Maarten van Smeden (LUMC) External validation and updating 20-24 August 2018
79. Advanced Epidemiologic Methods
causal research and prediction modelling
Final remarks
Maarten van Smeden
LUMC, Department of Clinical Epidemiology
20-24 August 2018
Maarten van Smeden (LUMC) Final remarks 20-24 August 2018
81. Machine learning
Beam, JAMA, 2018, doi: 10.1001/jama.2017.18391
Maarten van Smeden (LUMC) Final remarks 20-24 August 2018
82. Machine learning
Shah, JAMA, 2018, doi: 10.1001/jama.2018.5602
Maarten van Smeden (LUMC) Final remarks 20-24 August 2018
83. Machine learning
Shah, JAMA, 2018, doi: 10.1001/jama.2018.5602
Maarten van Smeden (LUMC) Final remarks 20-24 August 2018
84. Machine learning
source: blog Frank Harrell, http://www.fharrell.com/post/stat-ml/
Maarten van Smeden (LUMC) Final remarks 20-24 August 2018
85. Final remarks
• Prediction models can take many forms but in medicine the interest is often in calculating
risk of a health state currently being present (diagnostic) or developing in the future
(prognostic)
• Risk prediction models are tools that aim to support medical decision making, not replace
physicians
• Many prediction models have been developed already → make sure you know review the
earlier models in the field before deciding to build your own
• Calibration is essential for accurate risk prediction. Miscalibrated models misinform and may
cause patients harm
Maarten van Smeden (LUMC) Final remarks 20-24 August 2018
86. Acknowledgment
The materials (slides) used for in this course were inspired by materials that belong to Prof dr Gary Collins.
Maarten van Smeden (LUMC) Final remarks 20-24 August 2018