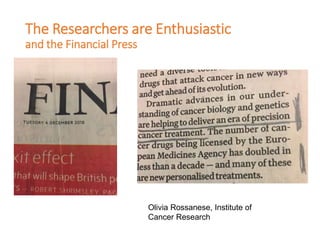
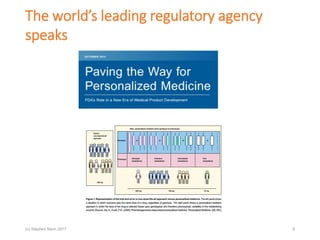
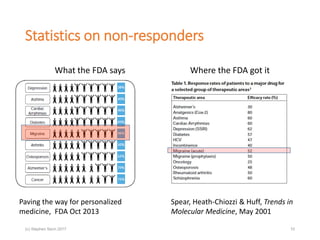
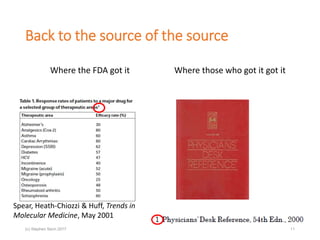
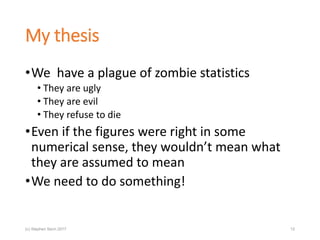
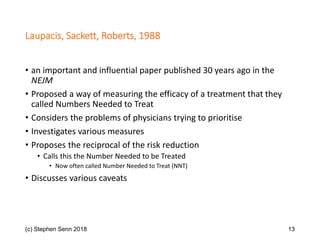
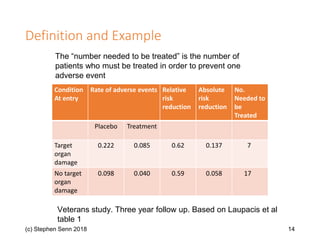
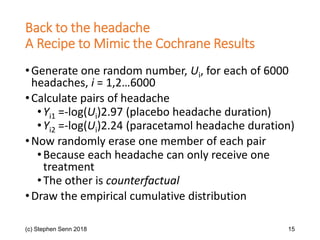
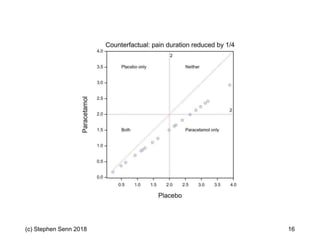
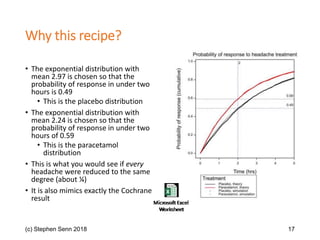
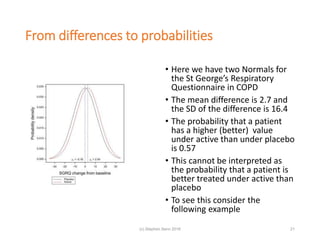
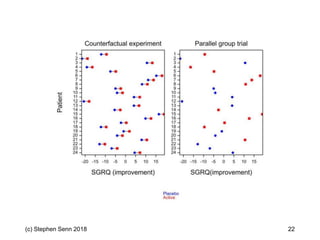
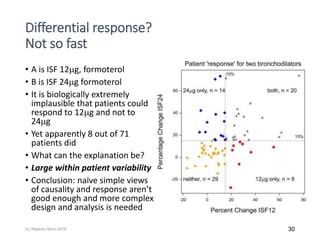
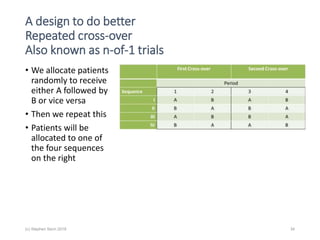
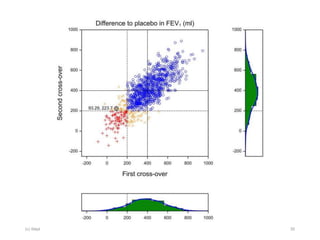
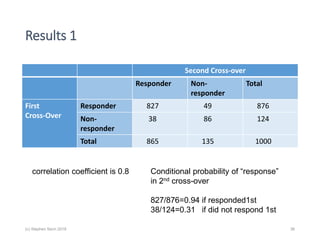
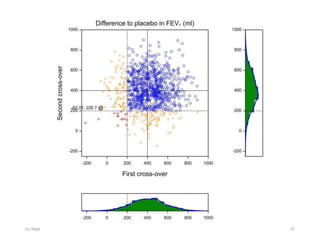
(c) Stephen Senn 2018 1
Numbers needed to treat, responder analysis
and overlap measures
Has the scope for personalised medicine been
overestimated?
Stephen Senn
Edinburgh
stephen@senns.demon.co.uk
Acknowledgements
My thanks to Jean Saunders and the University of Limerick for
the invitation
My thanks to Andreas Laupacis and Jennifer Deevy for
providing me with a copy of the classic paper on NNTs
This work was partly supported by the European Union’s 7th
Framework Programme for research, technological
development and demonstration under grant agreement no.
602552. “IDEAL”
2(c) Stephen Senn 2018
Disclaimers
(c) Stephen Senn 2018 3
These are my personal opinions and should not be attributed to any other
parties
I shall pick up some examples of problems to illustrate the point.
Just as a careless use of P-values does not indicate that all the science in the
paper in question is bad, a careless use of NNTs does not indicate that the
paper it appeared in is bad.
In some cases the problems are actually with publicity given to a paper rather
than the content of the papers
The difficulty of statistics is regularly underestimated by everybody, including
me.
A previous Prime Minister of the UK
speaks
This agreement will see the UK lead the world in
genetic research within years. I am determined
to do all I can to support the health and scientific
sector to unlock the power of DNA, turning an
important scientific breakthrough into something
that will help deliver better tests, better drugs
and above all better care for patients....
David Cameron, August 2014 (my emphasis)
(c) Stephen Senn 2017 4
A former captain of industry speaks
It will soon be possible for patients in clinical trials to undergo genetic tests
to identify those individuals who will respond favourably to the drug
candidate, based on their genotype…. This will translate into smaller, more
effective clinical trials with corresponding cost savings and ultimately better
treatment in general practice. … individual patients will be targeted with
specific treatment and personalised dosing regimens to maximise efficacy
and minimise pharmacokinetic problems and other side-effects.
Sir Richard Sykes, FRS, 1997
My emphasis
5(c) Stephen Senn 2017
(c) Stephen Senn 2018 6
59% had no or at worst mild
headache after 2 hours when
treated with paracetamol
49% had no or at worst mild
headache after 2 hours when
treated with placebo
59%-49% = 10%
Therefore 10% benefitted
The number needed to treat
(NNT) for one extra patient to
have a benefit is 10
Based on a review of 23 studies
and 6000 patients
The leading evidence based medicine
organisation speaks
(c) Stephen Senn 2018 7
Anybody familiar with the notion of “number needed to
treat” (NNT) knows that it's usually necessary to treat
many patients in order for one to benefit. NNTs under
5 are unusual, whereas NNTs over 20 are common.
Richard Smith, BMJ, 13 December 2003
(Richard Smith was the editor of the BMJ for many
years and remains a very interesting commentator of
medicine and health.)
The editor of a leading journal speaks
The Researchers are Enthusiastic
and the Financial Press
Olivia Rossanese, Institute of
Cancer Research
(c) Stephen Senn 2017 9
The world’s leading regulatory agency
speaks
Statistics on non-responders
What the FDA says Where the FDA got it
Paving the way for personalized
medicine, FDA Oct 2013
Spear, Heath-Chiozzi & Huff, Trends in
Molecular Medicine, May 2001
(c) Stephen Senn 2017 10
Back to the source of the source
Where the FDA got it Where those who got it got it
Spear, Heath-Chiozzi & Huff, Trends in
Molecular Medicine, May 2001
(c) Stephen Senn 2017 11
My thesis
•We have a plague of zombie statistics
• They are ugly
• They are evil
• They refuse to die
•Even if the figures were right in some
numerical sense, they wouldn’t mean what
they are assumed to mean
•We need to do something!
(c) Stephen Senn 2017 12
Laupacis, Sackett, Roberts, 1988
• an important and influential paper published 30 years ago in the
NEJM
• Proposed a way of measuring the efficacy of a treatment that they
called Numbers Needed to Treat
• Considers the problems of physicians trying to prioritise
• Investigates various measures
• Proposes the reciprocal of the risk reduction
• Calls this the Number Needed to be Treated
• Now often called Number Needed to Treat (NNT)
• Discusses various caveats
(c) Stephen Senn 2018 13
Definition and Example
(c) Stephen Senn 2018 14
The “number needed to be treated” is the number of
patients who must be treated in order to prevent one
adverse event
Condition
At entry
Rate of adverse events Relative
risk
reduction
Absolute
risk
reduction
No.
Needed to
be
Treated
Placebo Treatment
Target
organ
damage
0.222 0.085 0.62 0.137 7
No target
organ
damage
0.098 0.040 0.59 0.058 17
Veterans study. Three year follow up. Based on Laupacis et al
table 1
Back to the headache
A Recipe to Mimic the Cochrane Results
•Generate one random number, Ui, for each of 6000
headaches, i = 1,2…6000
•Calculate pairs of headache
•Yi1 =-log(Ui)2.97 (placebo headache duration)
•Yi2 =-log(Ui)2.24 (paracetamol headache duration)
•Now randomly erase one member of each pair
•Because each headache can only receive one
treatment
•The other is counterfactual
•Draw the empirical cumulative distribution
(c) Stephen Senn 2018 15
(c) Stephen Senn 2018 16
Why this recipe?
• The exponential distribution with
mean 2.97 is chosen so that the
probability of response in under two
hours is 0.49
• This is the placebo distribution
• The exponential distribution with
mean 2.24 is chosen so that the
probability of response in under two
hours of 0.59
• This is the paracetamol
distribution
• This is what you would see if every
headache were reduced to the same
degree (about ¼)
• It is also mimics exactly the Cochrane
result
(c) Stephen Senn 2018 17
Lessons
Particular
• The NNT of 10 is perfectly
compatible with paracetamol
having exactly the same
proportionate effect on every
headache
• Nothing in the data we are
given says anything whatsoever
about differential response
In general
• An NNT cannot tell you what
proportion of patients
responded
• To think so is a straightforward
conceptual mistake
• Claims regarding the proportion
who respond based on NNTs are
misleading
(c) Stephen Senn 2018 18
Warning
We tend to believe the truth is in
there.
Sometimes it isn’t and the
danger is that we will find it
anyway
(c) Stephen Senn 2018 19
Misunderstanding overlap measures
• Proposed measuring the
difference between groups as a
ratio of the standard deviation
• If measures are Normally
distributed and variances are
the same this translates into a
probability that a randomly
chosen value in one group will
be higher than one in the other
• Misinterpreted this as a
probability of response
(c) Stephen Senn 2018 20
From differences to probabilities
• Here we have two Normals for
the St George’s Respiratory
Questionnaire in COPD
• The mean difference is 2.7 and
the SD of the difference is 16.4
• The probability that a patient
has a higher (better) value
under active than under placebo
is 0.57
• This cannot be interpreted as
the probability that a patient is
better treated under active than
placebo
• To see this consider the
following example
(c) Stephen Senn 2018 21
(c) Stephen Senn 2018 22
How responder analysis misleads us:
Six depressingly common sins
• Poor choice of counterfactual
• Baseline does not necessarily predict what would happen in the absence of
treatment
• Bad measures
• Percent change from baseline is known to be a highly variable and badly behaved
measure
• Arbitrary dichotomy
• There is nothing magic about the standards we use and dichotomising loses
information
• Linguistic confusion
• Responder does not mean ‘was caused to improve’ it means ‘was observed to
improve’
• Causal naivety
• Subsequence is not consequence
• Failure to replicate
• If you want to exclude within-patient variability as an explanation you have to
know how big it is. That involves measuring patients more than once
23(c) Stephen Senn 2018
(c) Nature 2018 24
Slide with the Obligatory Purloined Cartoon
Senn, Nature, 29 November 2018
Baseline as a counterfactual? An example
• Long term trial (20 years) of an anti-aging cream by hundreds of
subjects
• Perfect compliance
• Obviously a fictional example!
• Measure based on ‘wrinkle score’
• Number of wrinkles at the end of the trial compared to the baseline value for
every subject
• The average wrinkle score at the end of the trial was zero
• Clearly the cream did not work
(c) Stephen Senn 2018 25
What the example makes clear
• Baselines are not in general suitable as counterfactuals
• Alas, the past is not on offer
• I say this as someone who is now aged 65 !
• Decision making, including decision making as regards which
treatment to take, is a choice between possible futures
• A baseline is only useful to the degree it helps us predict this future
• That is not the way clinical trials work or at least should work
• This is all very very obvious
• So why do we ignore at an individual level, what we all know at the
level of a trial?
(c) Stephen Senn 2018 26
(c) Stephen Senn 2018 27
15% increase in forced expiratory volume in
one second (FEV1)
Some regulatory magic
(c) Stephen Senn 2018 28
Some key efficacy PD responses were similar between xxx and yyy
following 180 μg single dose inhalation. The percentage of responders
(15% increase in FEV1 from baseline) was 63% and 52% for xxx and yyy,
respectively
From a cross-over trial submitted to the FDA as part of a review
This is cited just to show that the standard of 15% bronchodilation is
used
I shall now use an example of my own
So can we identify individual response with
cross-overs?
• Cross-over trial in asthma
• 71 patients
• Forced expiratory volume in one
second (FEV1) at 12 hours
• FDA definition of response is 
15% increase compered to
baseline
• There seem to be a number of
patients who respond to B and
not to A and vice versa
• Clearly if we can find predictive
characteristics of them we can
improve treatment
• Can’t we?
29(c) Stephen Senn 2018
Differential response?
Not so fast
• A is ISF 12g, formoterol
• B is ISF 24g formoterol
• It is biologically extremely
implausible that patients could
respond to 12g and not to
24g
• Yet apparently 8 out of 71
patients did
• What can the explanation be?
• Large within patient variability
• Conclusion: naïve simple views
of causality and response aren’t
good enough and more complex
design and analysis is needed
30(c) Stephen Senn 2018
Fisher’s great paper of 1918
(c) Stephen Senn 2017 31
Sources of Variation in Clinical Trials
Label Source Description
A Between
treatments
The average difference between patients over all treatments
and all randomisations
B Between
patients
The difference between patients given the same treatment.
(Averaged over both experimental and control treatments.)
C Patient by
treatment
interaction
The extent to which the ’true’ difference between
treatments will vary from patient to patient. (Equivalently
the extent to which the difference between patients will
vary from treatment to treatment.)
D Pure within
patient error
The extent to which the ‘response’ would vary for a given
patient when given the same treatment on different
occasions. (Averaged over all patients and both treatments.)
1. Senn SJ. Individual Therapy: New Dawn or False Dawn. Drug Information Journal
2001;35(4):1479-1494
(c) Stephen Senn 2018 32
Identifiability and Clinical Trials
Type of Trial Description Identifiable effects Error term
Parallel Each patient receives one
treatment
A B+C+D
Cross-over Each patient receives each
treatments
A+B C+D
Repeated cross-over Each patient receives each
treatment at least twice
A+B+C D
(c) Stephen Senn 2018 33
A design to do better
Repeated cross-over
Also known as n-of-1 trials
• We allocate patients
randomly to receive
either A followed by
B or vice versa
• Then we repeat this
• Patients will be
allocated to one of
the four sequences
on the right
(c) Stephen Senn 2018 34
(c) Stephen Senn 2018 35
Results 1
Second Cross-over
Responder Non-
responder
Total
First
Cross-Over
Responder 827 49 876
Non-
responder
38 86 124
Total 865 135 1000
(c) Stephen Senn 2018 36
correlation coefficient is 0.8 Conditional probability of “response”
in 2nd cross-over
827/876=0.94 if responded1st
38/124=0.31 if did not respond 1st
(c) Stephen Senn 2018 37
Results 2
Second Cross-over
Responder Non-
responder
Total
First
Cross-Over
Responder 797 95 892
Non-
responder
93 15 108
Total 865 135 1000
(c) Stephen Senn 2018 38
correlation coefficient is 0.0.2 Conditional probability of “response”
in 2nd cross-over
797/892=0.89 if responded1st
93/108=0.86 if did not respond 1st
The real lessons
• Other things being equal a high NNT is indicative of a poorer
treatment but it is not a valid shortcut to studying variation
• We need to understand and master the variation in the system
• We need to not naively over-interpret differentiation in observed
response
• Some of it may be genuine treatment-by-patient interaction
• Much of it may be within-patient variation
• In many (but not all) cases the task facing us will be to deliver better
average medicine
• In this connection there is one big problem we continually overlook
• The main source of variation in the system is not patients
• It’s doctors
(c) Stephen Senn 2018 39
Case-mix fails to explain variation in mastectomy rates:
management of screen-detected breast cancer in a UK
region 1997–2003 (Caldon et al 2005)
• 1997-2003
• 11 units
• 5109 cases and 1829 mastectomies
• Significant variation in rates
between units p<0.00001
• Not explained by case mix
p<0.00001
• 2-fold variation ratio observed to
expected and 4-fold for cancers <
15mm diameter
(c) Stephen Senn 2018 40
The central problem in management and leadership is failure to
understand the information in variation. Lloyd S Nelson
(quoted by WE Deming)
• As Deming, the guru of quality control taught us, it is the duty of
every manager to understand the variation in the system
• This is what is inspiring what Brent James is doing at Inter-
Mountain health
• At the moment we are making a bad job of this
• NNTs and responder analysis are no substitute for serious study of
components of variation
• There is no point publishing and developing yet more complicated
fancy stuff involving mixed models if we fail at the first hurdle
• Once you have sold the post by permitting naïve causal definitions
the battle is already lost
• We must do better
• and I would include me but I am retired
(c) Stephen Senn 2018 41
(c) Stephen Senn 42(c) Stephen Senn 2018 42
The supply of truth always greatly
exceeds its demand
John F Moffitt
(c) Stephen Senn 2018 43
Suggested further reading
(c) Stephen Senn 2018 44
Araujo, A., S. Julious and S. Senn (2016). "Understanding Variation in Sets of N-
of-1 Trials." PLOS ONE 11(12): e0167167.
Holland, P. W. (1986). "Statistics and Causal Inference." Journal of the American
Statistical Association 81(396): 945-960.
Robins, J. and S. Greenland (1989). "The probability of causation under a
stochastic model for individual risk." Biometrics 45(4): 1125-1138.
Rubin, D. B. (1974). "Estimating causal effects of treatments in randomized and
nonrandomized studies." Journal of educational Psychology 66(5): 688.
Senn, S. J. (2001). "Individual Therapy: New Dawn or False Dawn." Drug
Information Journal 35(4): 1479-1494.
Senn, S. J. (2004). "Individual response to treatment: is it a valid assumption?"
BMJ 329(7472): 966-968.
Senn, S. J. (2016). "Mastering variation: variance components and personalised
medicine." Statistics in Medicine 35(7): 966-977.
Senn SJ. (2018) Statistical pitfalls of personalized medicine. Nature.
2018;563(7733):619-621.
Snapinn, S. and Q. Jiang (2011). "On the clinical meaningfulness of a
treatment's effect on a time-to-event variable." Stat Med 30(19): 2341-2348.

NNTs, responder analysis & overlap measures

  • 1.
    (c) Stephen Senn2018 1 Numbers needed to treat, responder analysis and overlap measures Has the scope for personalised medicine been overestimated? Stephen Senn Edinburgh stephen@senns.demon.co.uk
  • 2.
    Acknowledgements My thanks toJean Saunders and the University of Limerick for the invitation My thanks to Andreas Laupacis and Jennifer Deevy for providing me with a copy of the classic paper on NNTs This work was partly supported by the European Union’s 7th Framework Programme for research, technological development and demonstration under grant agreement no. 602552. “IDEAL” 2(c) Stephen Senn 2018
  • 3.
    Disclaimers (c) Stephen Senn2018 3 These are my personal opinions and should not be attributed to any other parties I shall pick up some examples of problems to illustrate the point. Just as a careless use of P-values does not indicate that all the science in the paper in question is bad, a careless use of NNTs does not indicate that the paper it appeared in is bad. In some cases the problems are actually with publicity given to a paper rather than the content of the papers The difficulty of statistics is regularly underestimated by everybody, including me.
  • 4.
    A previous PrimeMinister of the UK speaks This agreement will see the UK lead the world in genetic research within years. I am determined to do all I can to support the health and scientific sector to unlock the power of DNA, turning an important scientific breakthrough into something that will help deliver better tests, better drugs and above all better care for patients.... David Cameron, August 2014 (my emphasis) (c) Stephen Senn 2017 4
  • 5.
    A former captainof industry speaks It will soon be possible for patients in clinical trials to undergo genetic tests to identify those individuals who will respond favourably to the drug candidate, based on their genotype…. This will translate into smaller, more effective clinical trials with corresponding cost savings and ultimately better treatment in general practice. … individual patients will be targeted with specific treatment and personalised dosing regimens to maximise efficacy and minimise pharmacokinetic problems and other side-effects. Sir Richard Sykes, FRS, 1997 My emphasis 5(c) Stephen Senn 2017
  • 6.
    (c) Stephen Senn2018 6 59% had no or at worst mild headache after 2 hours when treated with paracetamol 49% had no or at worst mild headache after 2 hours when treated with placebo 59%-49% = 10% Therefore 10% benefitted The number needed to treat (NNT) for one extra patient to have a benefit is 10 Based on a review of 23 studies and 6000 patients The leading evidence based medicine organisation speaks
  • 7.
    (c) Stephen Senn2018 7 Anybody familiar with the notion of “number needed to treat” (NNT) knows that it's usually necessary to treat many patients in order for one to benefit. NNTs under 5 are unusual, whereas NNTs over 20 are common. Richard Smith, BMJ, 13 December 2003 (Richard Smith was the editor of the BMJ for many years and remains a very interesting commentator of medicine and health.) The editor of a leading journal speaks
  • 8.
    The Researchers areEnthusiastic and the Financial Press Olivia Rossanese, Institute of Cancer Research
  • 9.
    (c) Stephen Senn2017 9 The world’s leading regulatory agency speaks
  • 10.
    Statistics on non-responders Whatthe FDA says Where the FDA got it Paving the way for personalized medicine, FDA Oct 2013 Spear, Heath-Chiozzi & Huff, Trends in Molecular Medicine, May 2001 (c) Stephen Senn 2017 10
  • 11.
    Back to thesource of the source Where the FDA got it Where those who got it got it Spear, Heath-Chiozzi & Huff, Trends in Molecular Medicine, May 2001 (c) Stephen Senn 2017 11
  • 12.
    My thesis •We havea plague of zombie statistics • They are ugly • They are evil • They refuse to die •Even if the figures were right in some numerical sense, they wouldn’t mean what they are assumed to mean •We need to do something! (c) Stephen Senn 2017 12
  • 13.
    Laupacis, Sackett, Roberts,1988 • an important and influential paper published 30 years ago in the NEJM • Proposed a way of measuring the efficacy of a treatment that they called Numbers Needed to Treat • Considers the problems of physicians trying to prioritise • Investigates various measures • Proposes the reciprocal of the risk reduction • Calls this the Number Needed to be Treated • Now often called Number Needed to Treat (NNT) • Discusses various caveats (c) Stephen Senn 2018 13
  • 14.
    Definition and Example (c)Stephen Senn 2018 14 The “number needed to be treated” is the number of patients who must be treated in order to prevent one adverse event Condition At entry Rate of adverse events Relative risk reduction Absolute risk reduction No. Needed to be Treated Placebo Treatment Target organ damage 0.222 0.085 0.62 0.137 7 No target organ damage 0.098 0.040 0.59 0.058 17 Veterans study. Three year follow up. Based on Laupacis et al table 1
  • 15.
    Back to theheadache A Recipe to Mimic the Cochrane Results •Generate one random number, Ui, for each of 6000 headaches, i = 1,2…6000 •Calculate pairs of headache •Yi1 =-log(Ui)2.97 (placebo headache duration) •Yi2 =-log(Ui)2.24 (paracetamol headache duration) •Now randomly erase one member of each pair •Because each headache can only receive one treatment •The other is counterfactual •Draw the empirical cumulative distribution (c) Stephen Senn 2018 15
  • 16.
  • 17.
    Why this recipe? •The exponential distribution with mean 2.97 is chosen so that the probability of response in under two hours is 0.49 • This is the placebo distribution • The exponential distribution with mean 2.24 is chosen so that the probability of response in under two hours of 0.59 • This is the paracetamol distribution • This is what you would see if every headache were reduced to the same degree (about ¼) • It is also mimics exactly the Cochrane result (c) Stephen Senn 2018 17
  • 18.
    Lessons Particular • The NNTof 10 is perfectly compatible with paracetamol having exactly the same proportionate effect on every headache • Nothing in the data we are given says anything whatsoever about differential response In general • An NNT cannot tell you what proportion of patients responded • To think so is a straightforward conceptual mistake • Claims regarding the proportion who respond based on NNTs are misleading (c) Stephen Senn 2018 18
  • 19.
    Warning We tend tobelieve the truth is in there. Sometimes it isn’t and the danger is that we will find it anyway (c) Stephen Senn 2018 19
  • 20.
    Misunderstanding overlap measures •Proposed measuring the difference between groups as a ratio of the standard deviation • If measures are Normally distributed and variances are the same this translates into a probability that a randomly chosen value in one group will be higher than one in the other • Misinterpreted this as a probability of response (c) Stephen Senn 2018 20
  • 21.
    From differences toprobabilities • Here we have two Normals for the St George’s Respiratory Questionnaire in COPD • The mean difference is 2.7 and the SD of the difference is 16.4 • The probability that a patient has a higher (better) value under active than under placebo is 0.57 • This cannot be interpreted as the probability that a patient is better treated under active than placebo • To see this consider the following example (c) Stephen Senn 2018 21
  • 22.
  • 23.
    How responder analysismisleads us: Six depressingly common sins • Poor choice of counterfactual • Baseline does not necessarily predict what would happen in the absence of treatment • Bad measures • Percent change from baseline is known to be a highly variable and badly behaved measure • Arbitrary dichotomy • There is nothing magic about the standards we use and dichotomising loses information • Linguistic confusion • Responder does not mean ‘was caused to improve’ it means ‘was observed to improve’ • Causal naivety • Subsequence is not consequence • Failure to replicate • If you want to exclude within-patient variability as an explanation you have to know how big it is. That involves measuring patients more than once 23(c) Stephen Senn 2018
  • 24.
    (c) Nature 201824 Slide with the Obligatory Purloined Cartoon Senn, Nature, 29 November 2018
  • 25.
    Baseline as acounterfactual? An example • Long term trial (20 years) of an anti-aging cream by hundreds of subjects • Perfect compliance • Obviously a fictional example! • Measure based on ‘wrinkle score’ • Number of wrinkles at the end of the trial compared to the baseline value for every subject • The average wrinkle score at the end of the trial was zero • Clearly the cream did not work (c) Stephen Senn 2018 25
  • 26.
    What the examplemakes clear • Baselines are not in general suitable as counterfactuals • Alas, the past is not on offer • I say this as someone who is now aged 65 ! • Decision making, including decision making as regards which treatment to take, is a choice between possible futures • A baseline is only useful to the degree it helps us predict this future • That is not the way clinical trials work or at least should work • This is all very very obvious • So why do we ignore at an individual level, what we all know at the level of a trial? (c) Stephen Senn 2018 26
  • 27.
  • 28.
    15% increase inforced expiratory volume in one second (FEV1) Some regulatory magic (c) Stephen Senn 2018 28 Some key efficacy PD responses were similar between xxx and yyy following 180 μg single dose inhalation. The percentage of responders (15% increase in FEV1 from baseline) was 63% and 52% for xxx and yyy, respectively From a cross-over trial submitted to the FDA as part of a review This is cited just to show that the standard of 15% bronchodilation is used I shall now use an example of my own
  • 29.
    So can weidentify individual response with cross-overs? • Cross-over trial in asthma • 71 patients • Forced expiratory volume in one second (FEV1) at 12 hours • FDA definition of response is  15% increase compered to baseline • There seem to be a number of patients who respond to B and not to A and vice versa • Clearly if we can find predictive characteristics of them we can improve treatment • Can’t we? 29(c) Stephen Senn 2018
  • 30.
    Differential response? Not sofast • A is ISF 12g, formoterol • B is ISF 24g formoterol • It is biologically extremely implausible that patients could respond to 12g and not to 24g • Yet apparently 8 out of 71 patients did • What can the explanation be? • Large within patient variability • Conclusion: naïve simple views of causality and response aren’t good enough and more complex design and analysis is needed 30(c) Stephen Senn 2018
  • 31.
    Fisher’s great paperof 1918 (c) Stephen Senn 2017 31
  • 32.
    Sources of Variationin Clinical Trials Label Source Description A Between treatments The average difference between patients over all treatments and all randomisations B Between patients The difference between patients given the same treatment. (Averaged over both experimental and control treatments.) C Patient by treatment interaction The extent to which the ’true’ difference between treatments will vary from patient to patient. (Equivalently the extent to which the difference between patients will vary from treatment to treatment.) D Pure within patient error The extent to which the ‘response’ would vary for a given patient when given the same treatment on different occasions. (Averaged over all patients and both treatments.) 1. Senn SJ. Individual Therapy: New Dawn or False Dawn. Drug Information Journal 2001;35(4):1479-1494 (c) Stephen Senn 2018 32
  • 33.
    Identifiability and ClinicalTrials Type of Trial Description Identifiable effects Error term Parallel Each patient receives one treatment A B+C+D Cross-over Each patient receives each treatments A+B C+D Repeated cross-over Each patient receives each treatment at least twice A+B+C D (c) Stephen Senn 2018 33
  • 34.
    A design todo better Repeated cross-over Also known as n-of-1 trials • We allocate patients randomly to receive either A followed by B or vice versa • Then we repeat this • Patients will be allocated to one of the four sequences on the right (c) Stephen Senn 2018 34
  • 35.
  • 36.
    Results 1 Second Cross-over ResponderNon- responder Total First Cross-Over Responder 827 49 876 Non- responder 38 86 124 Total 865 135 1000 (c) Stephen Senn 2018 36 correlation coefficient is 0.8 Conditional probability of “response” in 2nd cross-over 827/876=0.94 if responded1st 38/124=0.31 if did not respond 1st
  • 37.
  • 38.
    Results 2 Second Cross-over ResponderNon- responder Total First Cross-Over Responder 797 95 892 Non- responder 93 15 108 Total 865 135 1000 (c) Stephen Senn 2018 38 correlation coefficient is 0.0.2 Conditional probability of “response” in 2nd cross-over 797/892=0.89 if responded1st 93/108=0.86 if did not respond 1st
  • 39.
    The real lessons •Other things being equal a high NNT is indicative of a poorer treatment but it is not a valid shortcut to studying variation • We need to understand and master the variation in the system • We need to not naively over-interpret differentiation in observed response • Some of it may be genuine treatment-by-patient interaction • Much of it may be within-patient variation • In many (but not all) cases the task facing us will be to deliver better average medicine • In this connection there is one big problem we continually overlook • The main source of variation in the system is not patients • It’s doctors (c) Stephen Senn 2018 39
  • 40.
    Case-mix fails toexplain variation in mastectomy rates: management of screen-detected breast cancer in a UK region 1997–2003 (Caldon et al 2005) • 1997-2003 • 11 units • 5109 cases and 1829 mastectomies • Significant variation in rates between units p<0.00001 • Not explained by case mix p<0.00001 • 2-fold variation ratio observed to expected and 4-fold for cancers < 15mm diameter (c) Stephen Senn 2018 40
  • 41.
    The central problemin management and leadership is failure to understand the information in variation. Lloyd S Nelson (quoted by WE Deming) • As Deming, the guru of quality control taught us, it is the duty of every manager to understand the variation in the system • This is what is inspiring what Brent James is doing at Inter- Mountain health • At the moment we are making a bad job of this • NNTs and responder analysis are no substitute for serious study of components of variation • There is no point publishing and developing yet more complicated fancy stuff involving mixed models if we fail at the first hurdle • Once you have sold the post by permitting naïve causal definitions the battle is already lost • We must do better • and I would include me but I am retired (c) Stephen Senn 2018 41
  • 42.
    (c) Stephen Senn42(c) Stephen Senn 2018 42
  • 43.
    The supply oftruth always greatly exceeds its demand John F Moffitt (c) Stephen Senn 2018 43
  • 44.
    Suggested further reading (c)Stephen Senn 2018 44 Araujo, A., S. Julious and S. Senn (2016). "Understanding Variation in Sets of N- of-1 Trials." PLOS ONE 11(12): e0167167. Holland, P. W. (1986). "Statistics and Causal Inference." Journal of the American Statistical Association 81(396): 945-960. Robins, J. and S. Greenland (1989). "The probability of causation under a stochastic model for individual risk." Biometrics 45(4): 1125-1138. Rubin, D. B. (1974). "Estimating causal effects of treatments in randomized and nonrandomized studies." Journal of educational Psychology 66(5): 688. Senn, S. J. (2001). "Individual Therapy: New Dawn or False Dawn." Drug Information Journal 35(4): 1479-1494. Senn, S. J. (2004). "Individual response to treatment: is it a valid assumption?" BMJ 329(7472): 966-968. Senn, S. J. (2016). "Mastering variation: variance components and personalised medicine." Statistics in Medicine 35(7): 966-977. Senn SJ. (2018) Statistical pitfalls of personalized medicine. Nature. 2018;563(7733):619-621. Snapinn, S. and Q. Jiang (2011). "On the clinical meaningfulness of a treatment's effect on a time-to-event variable." Stat Med 30(19): 2341-2348.