Download to read offline
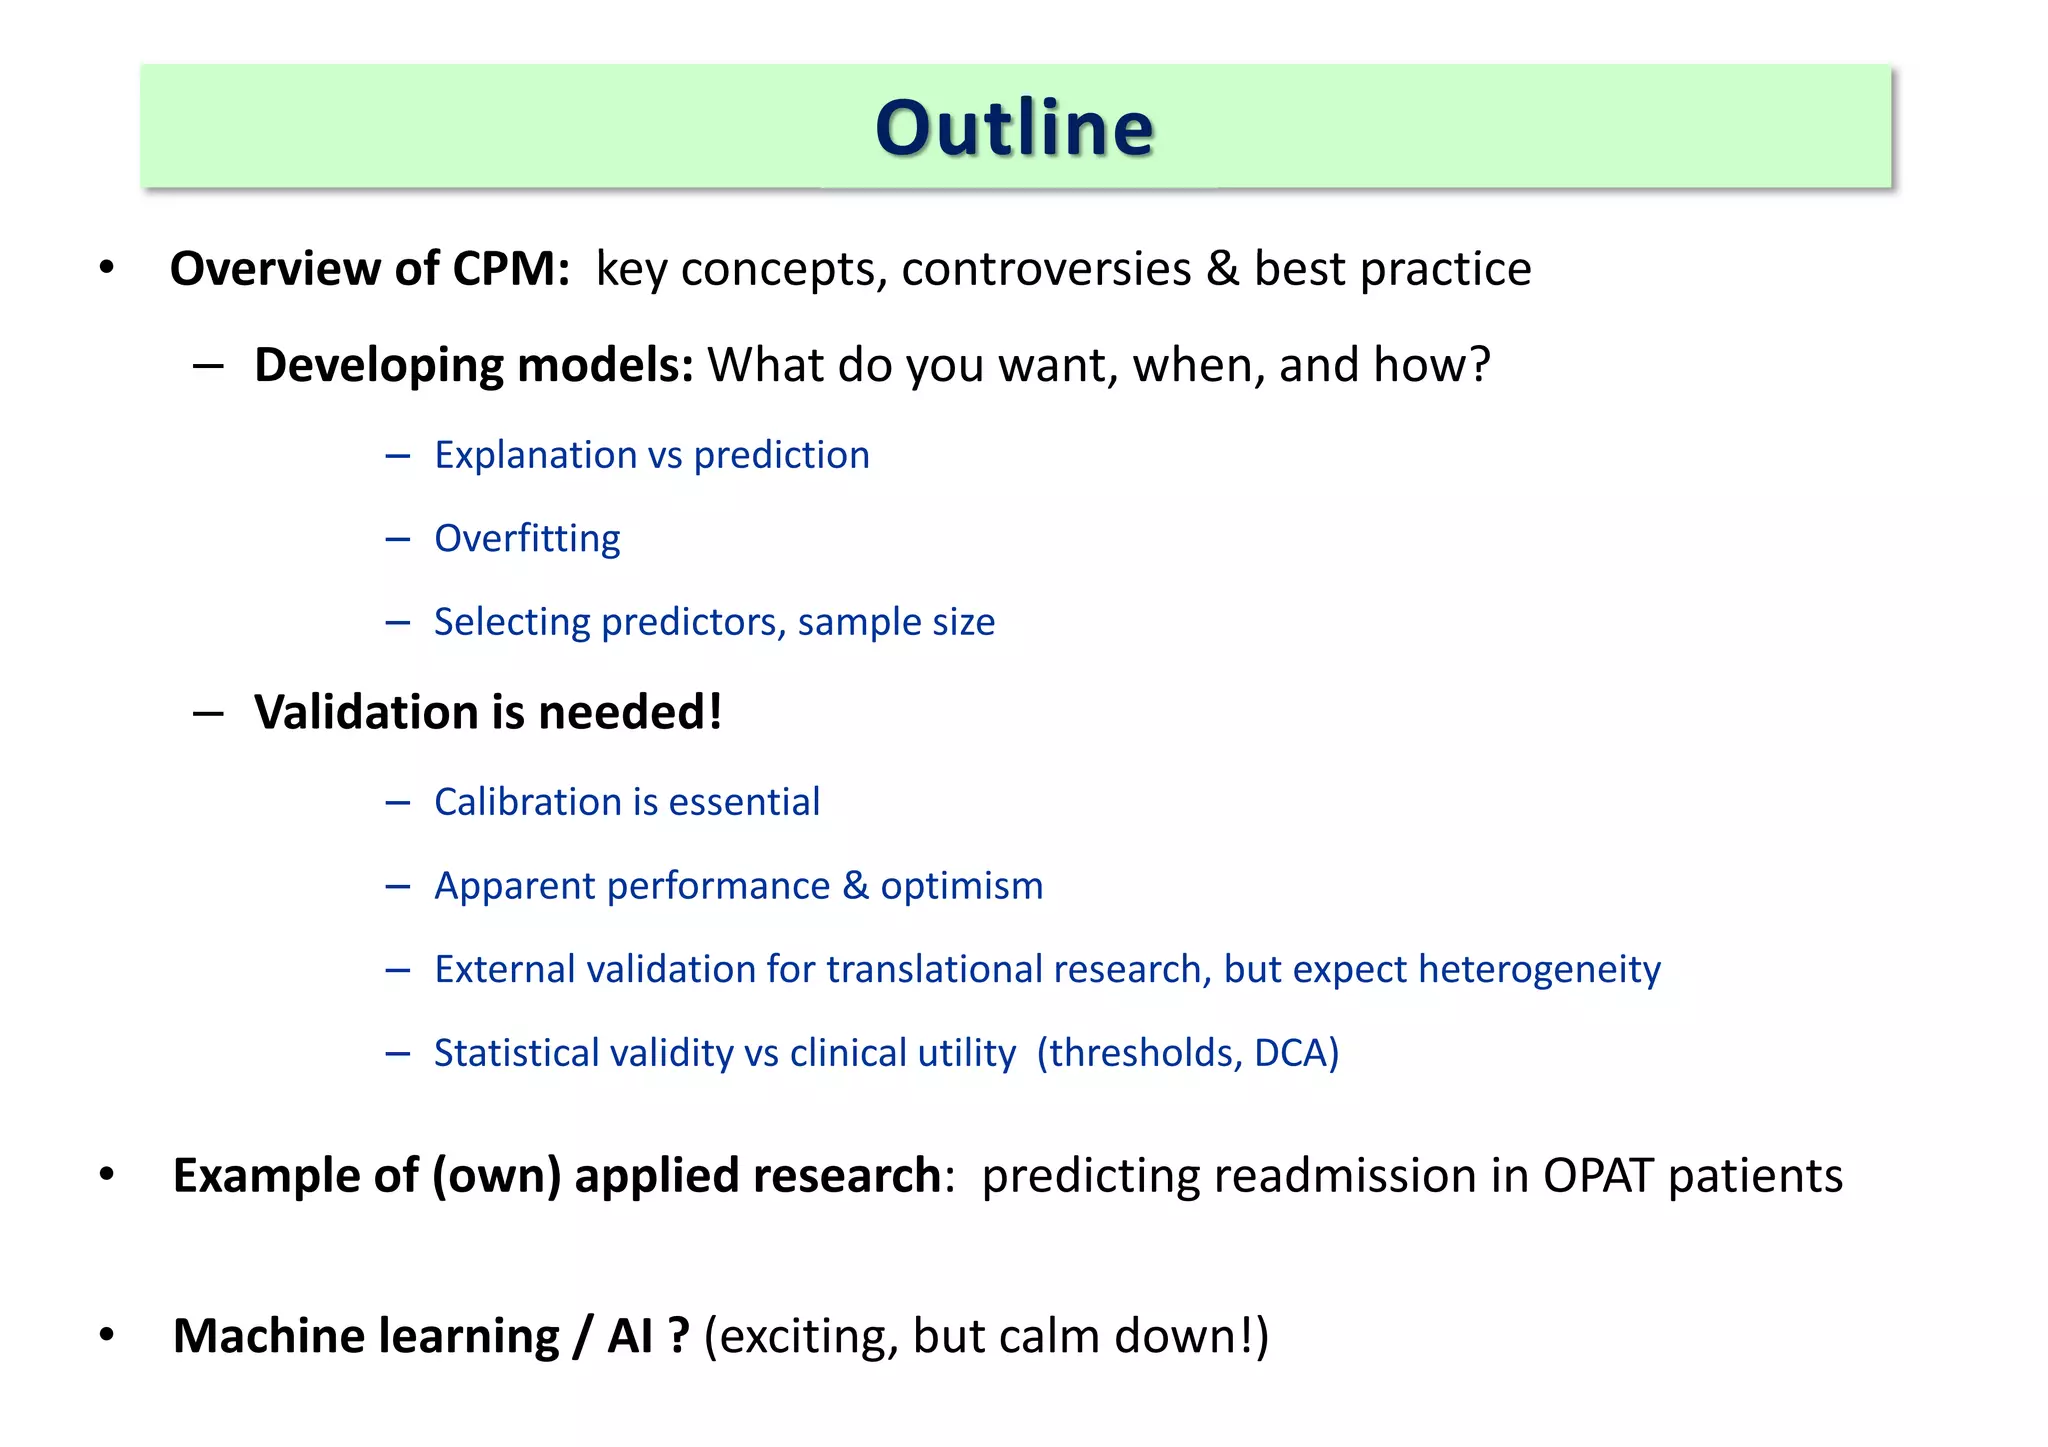
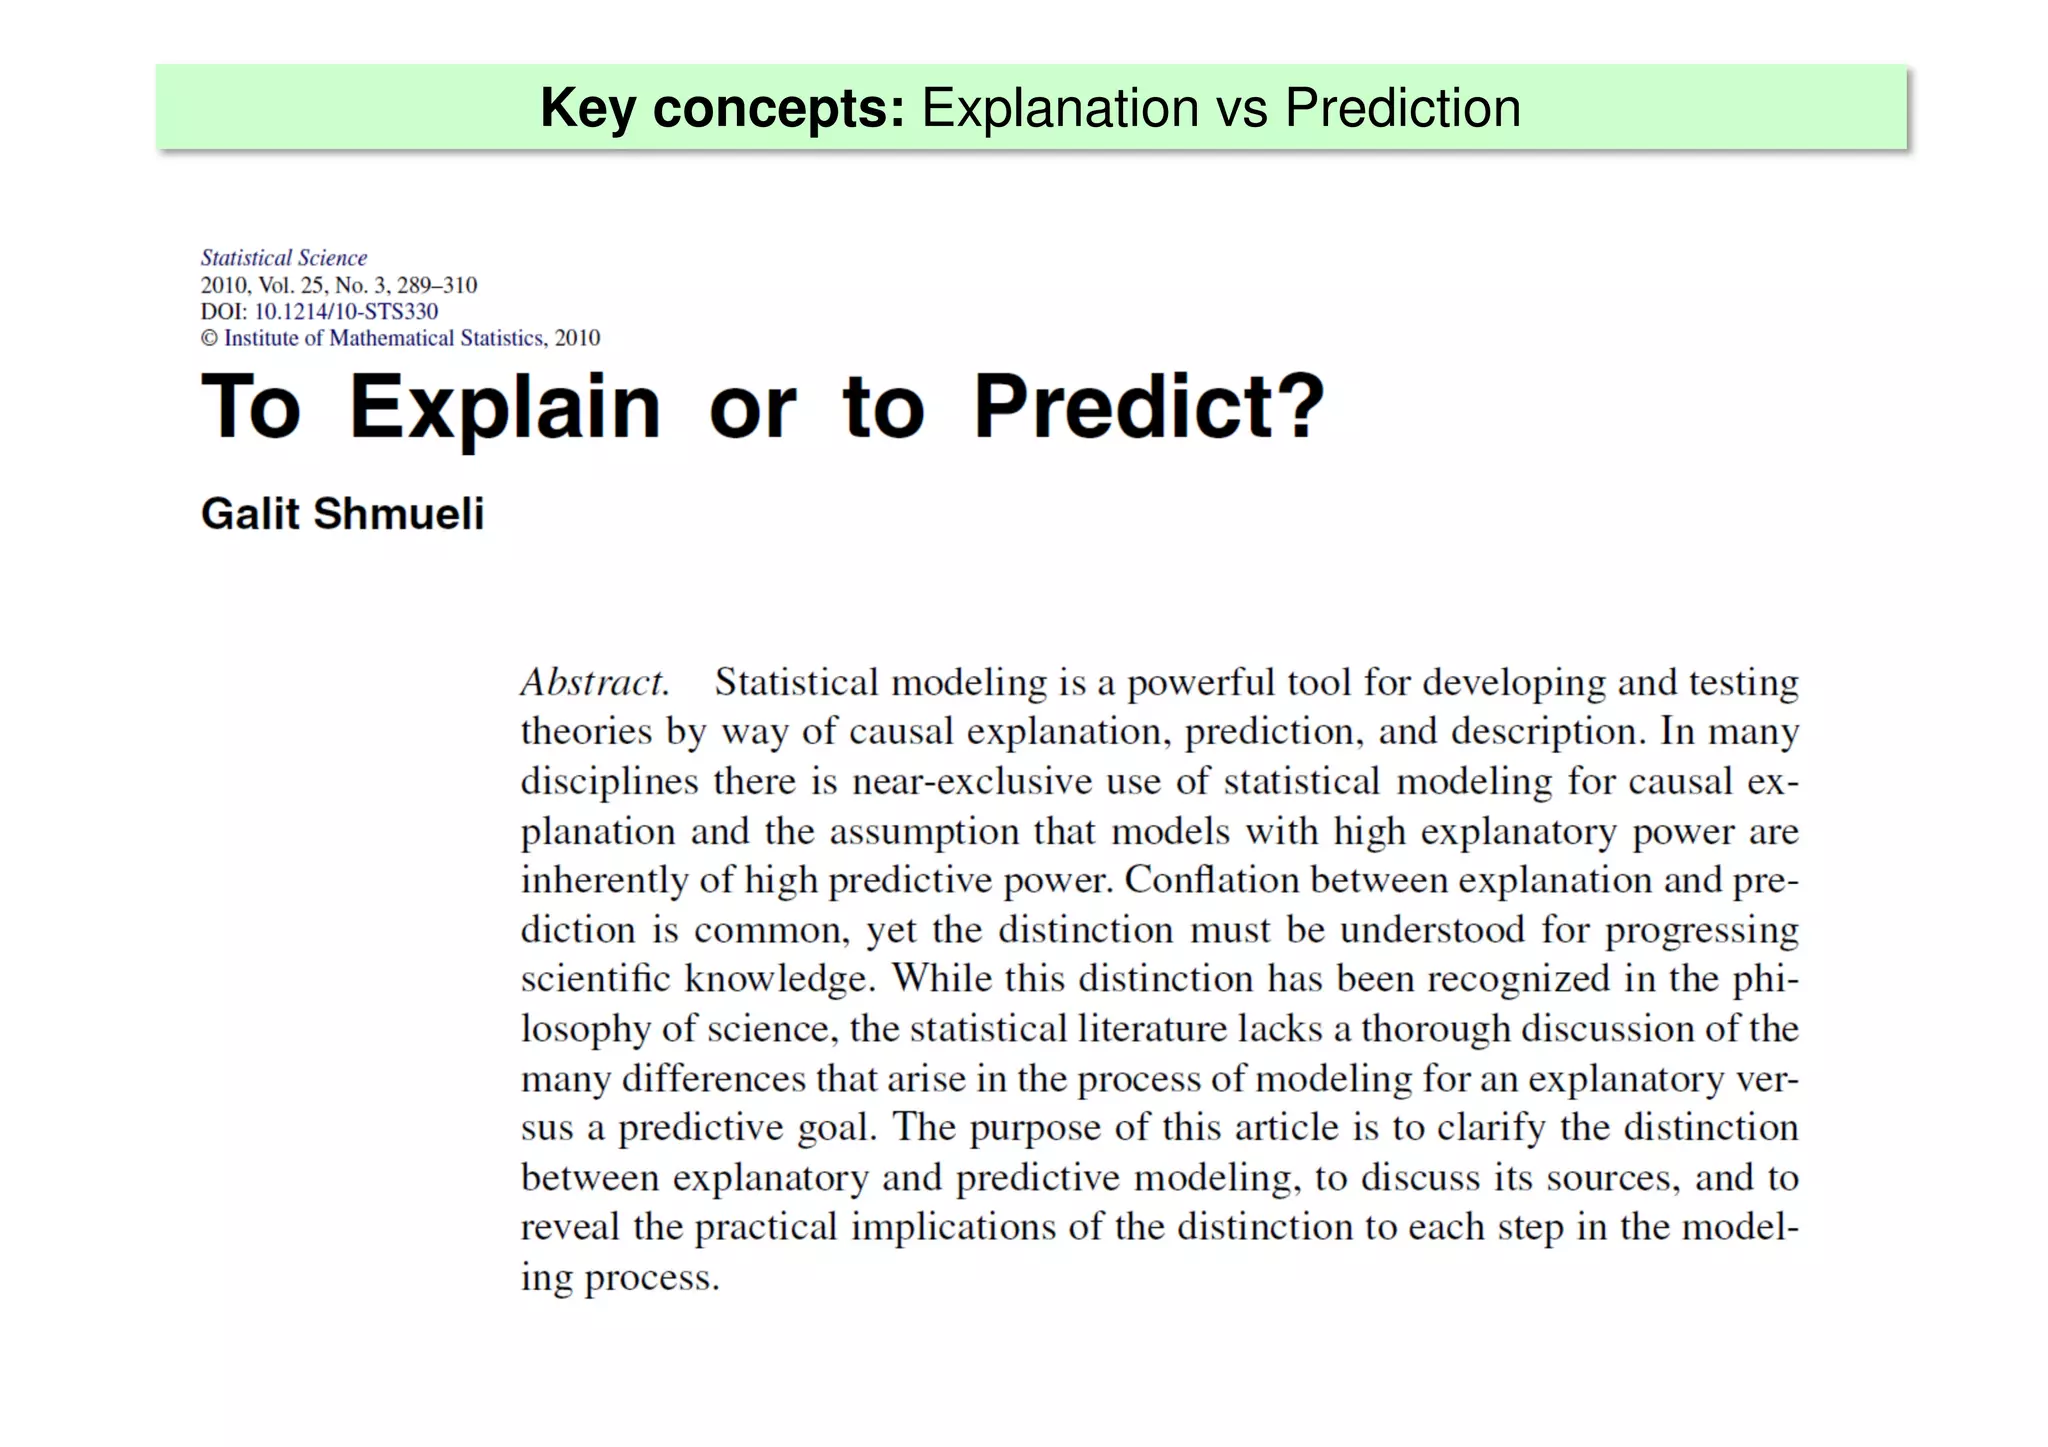
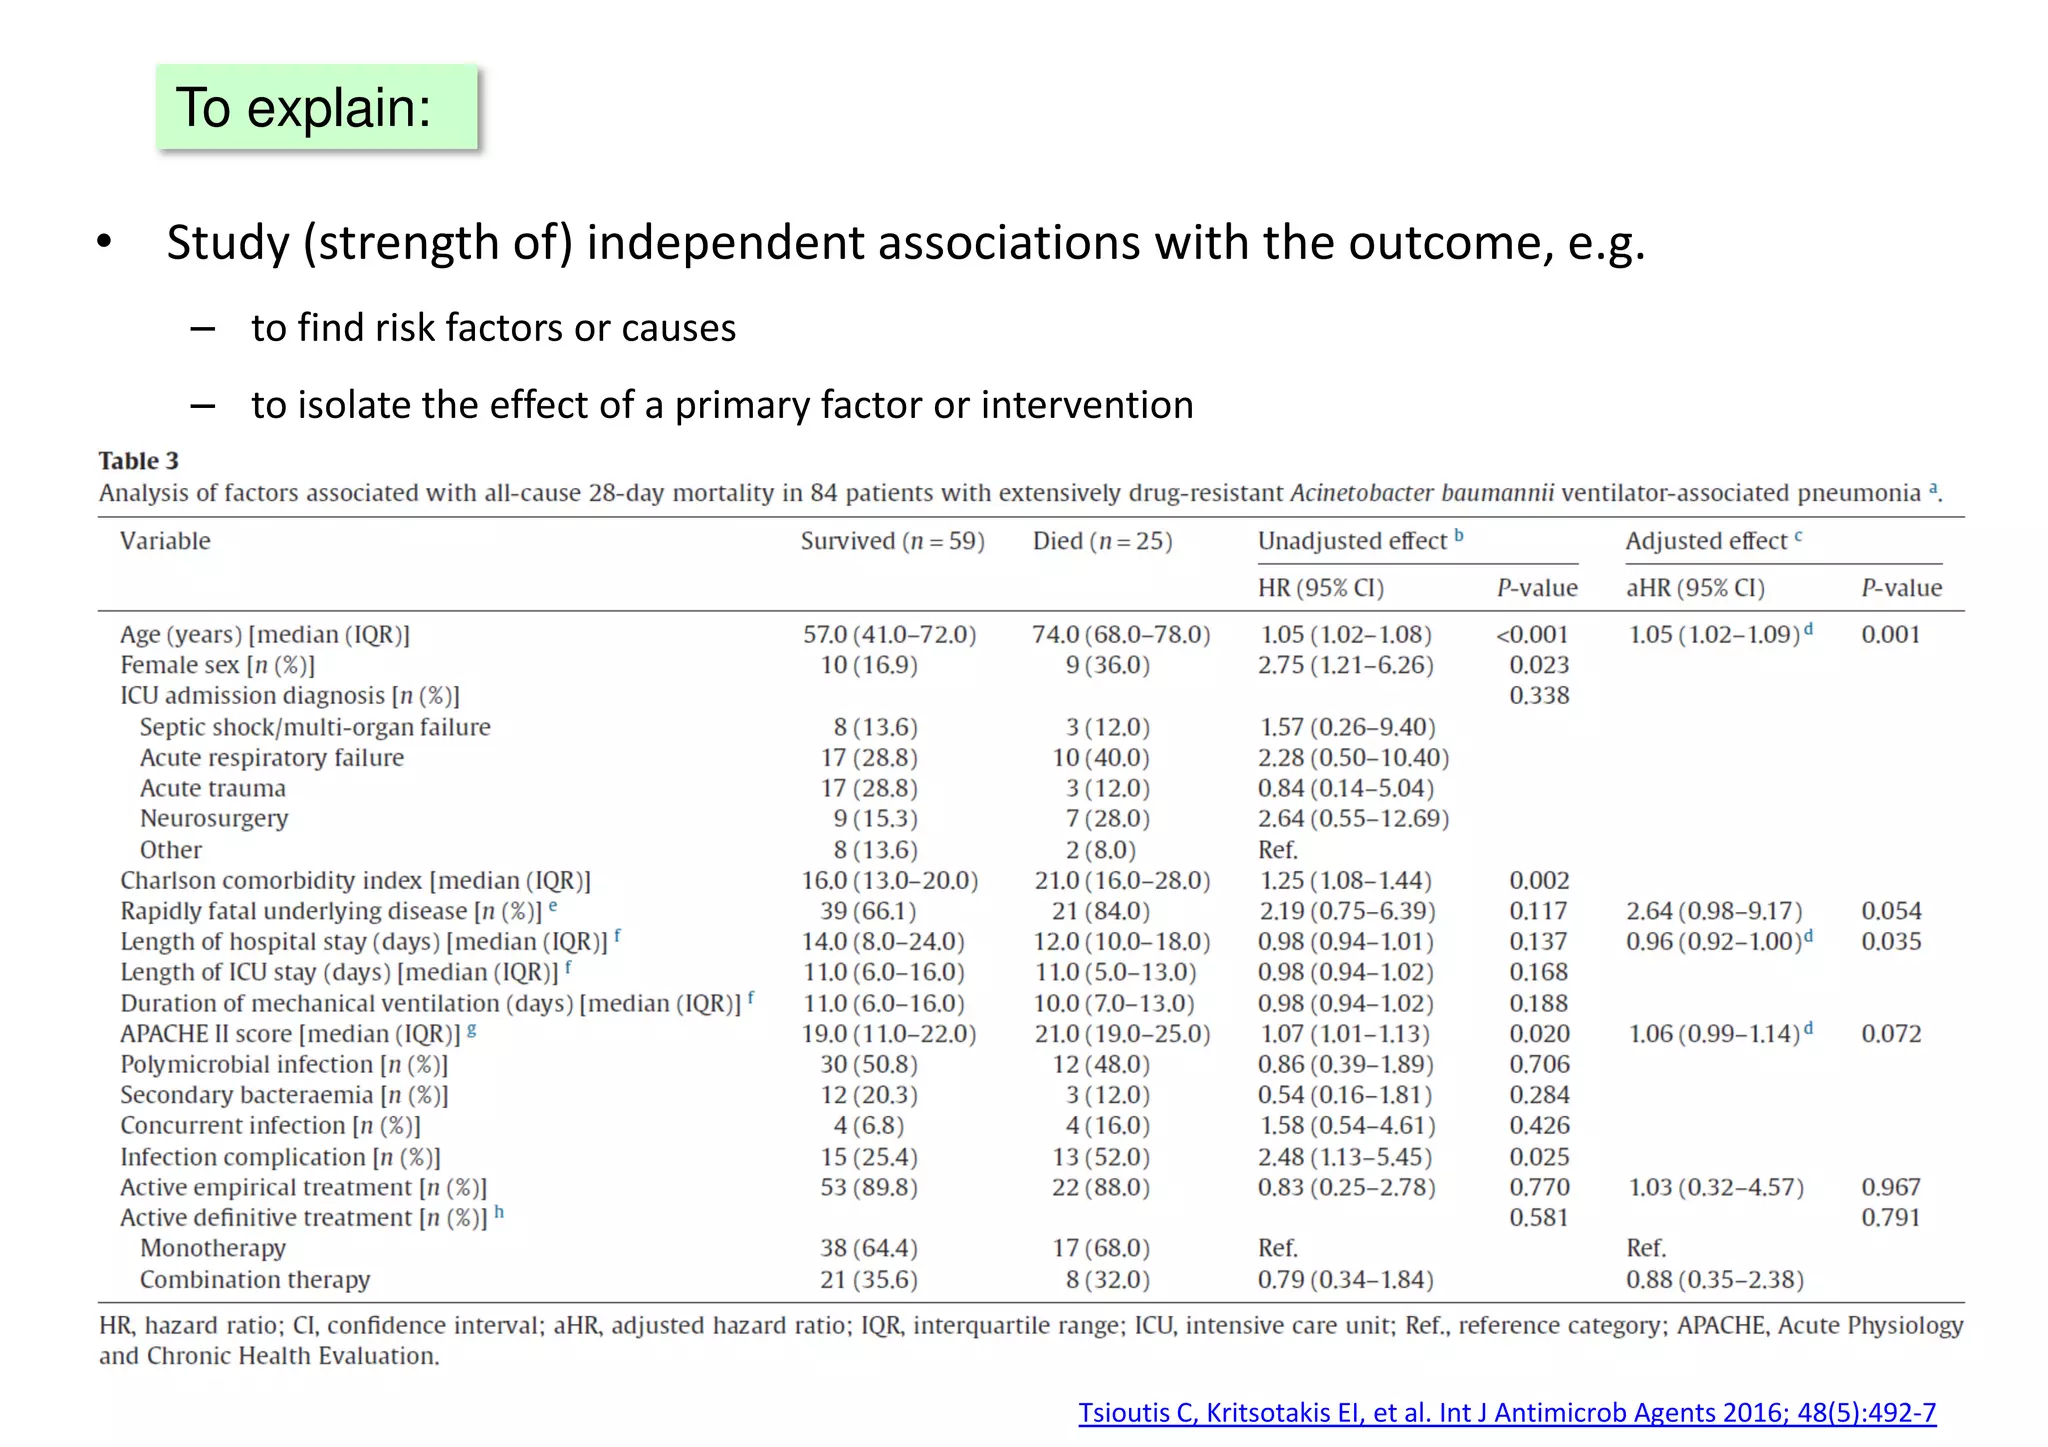
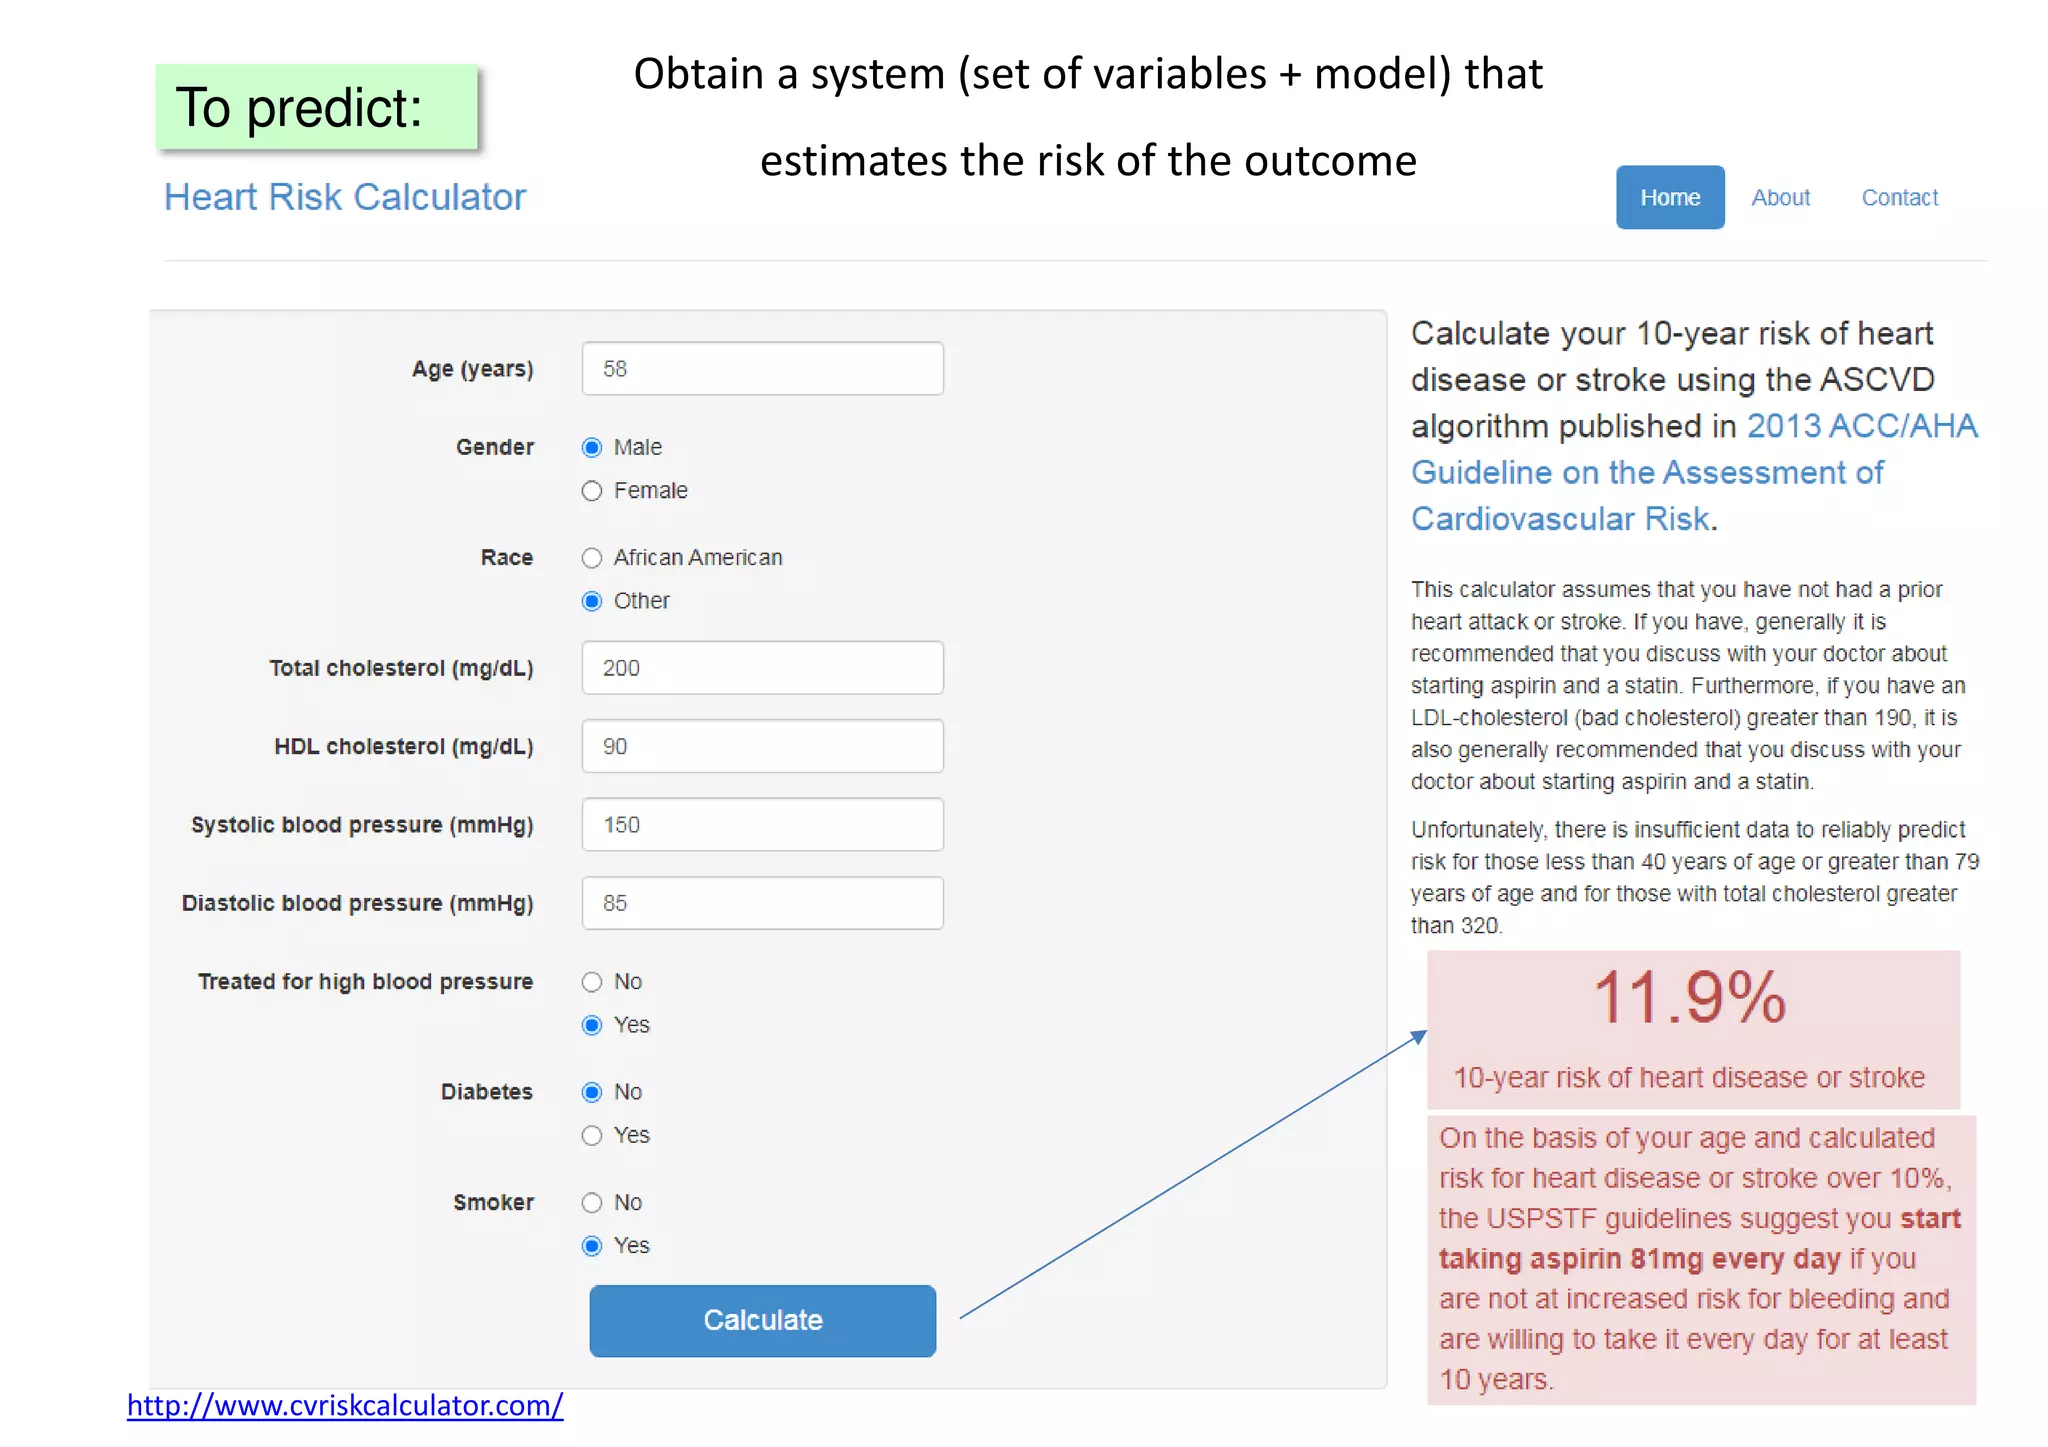
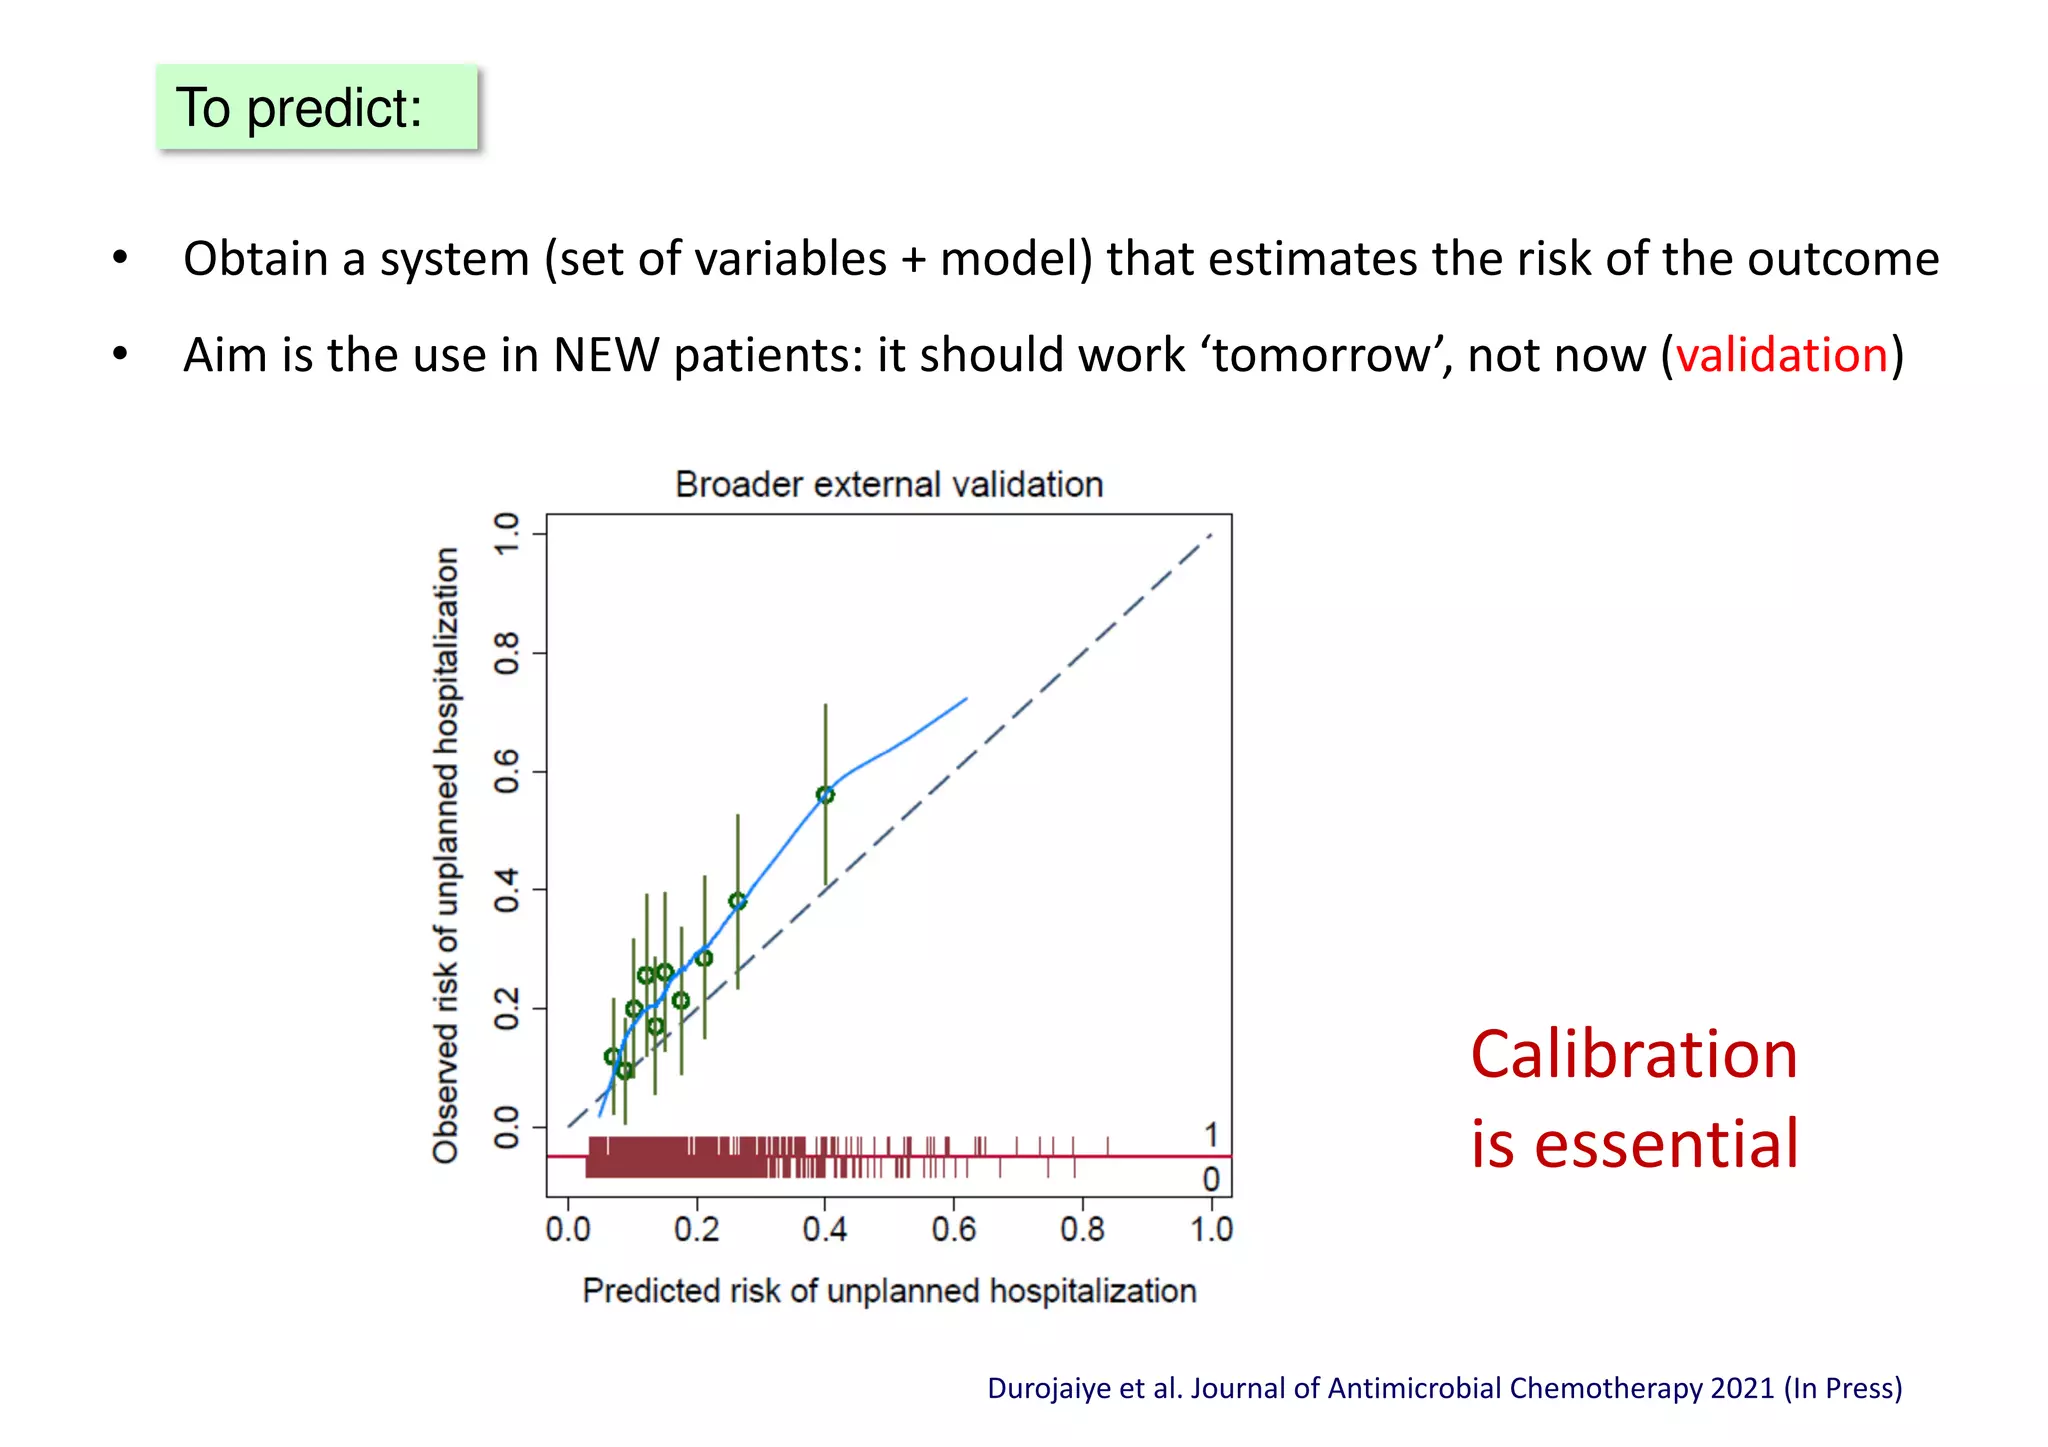
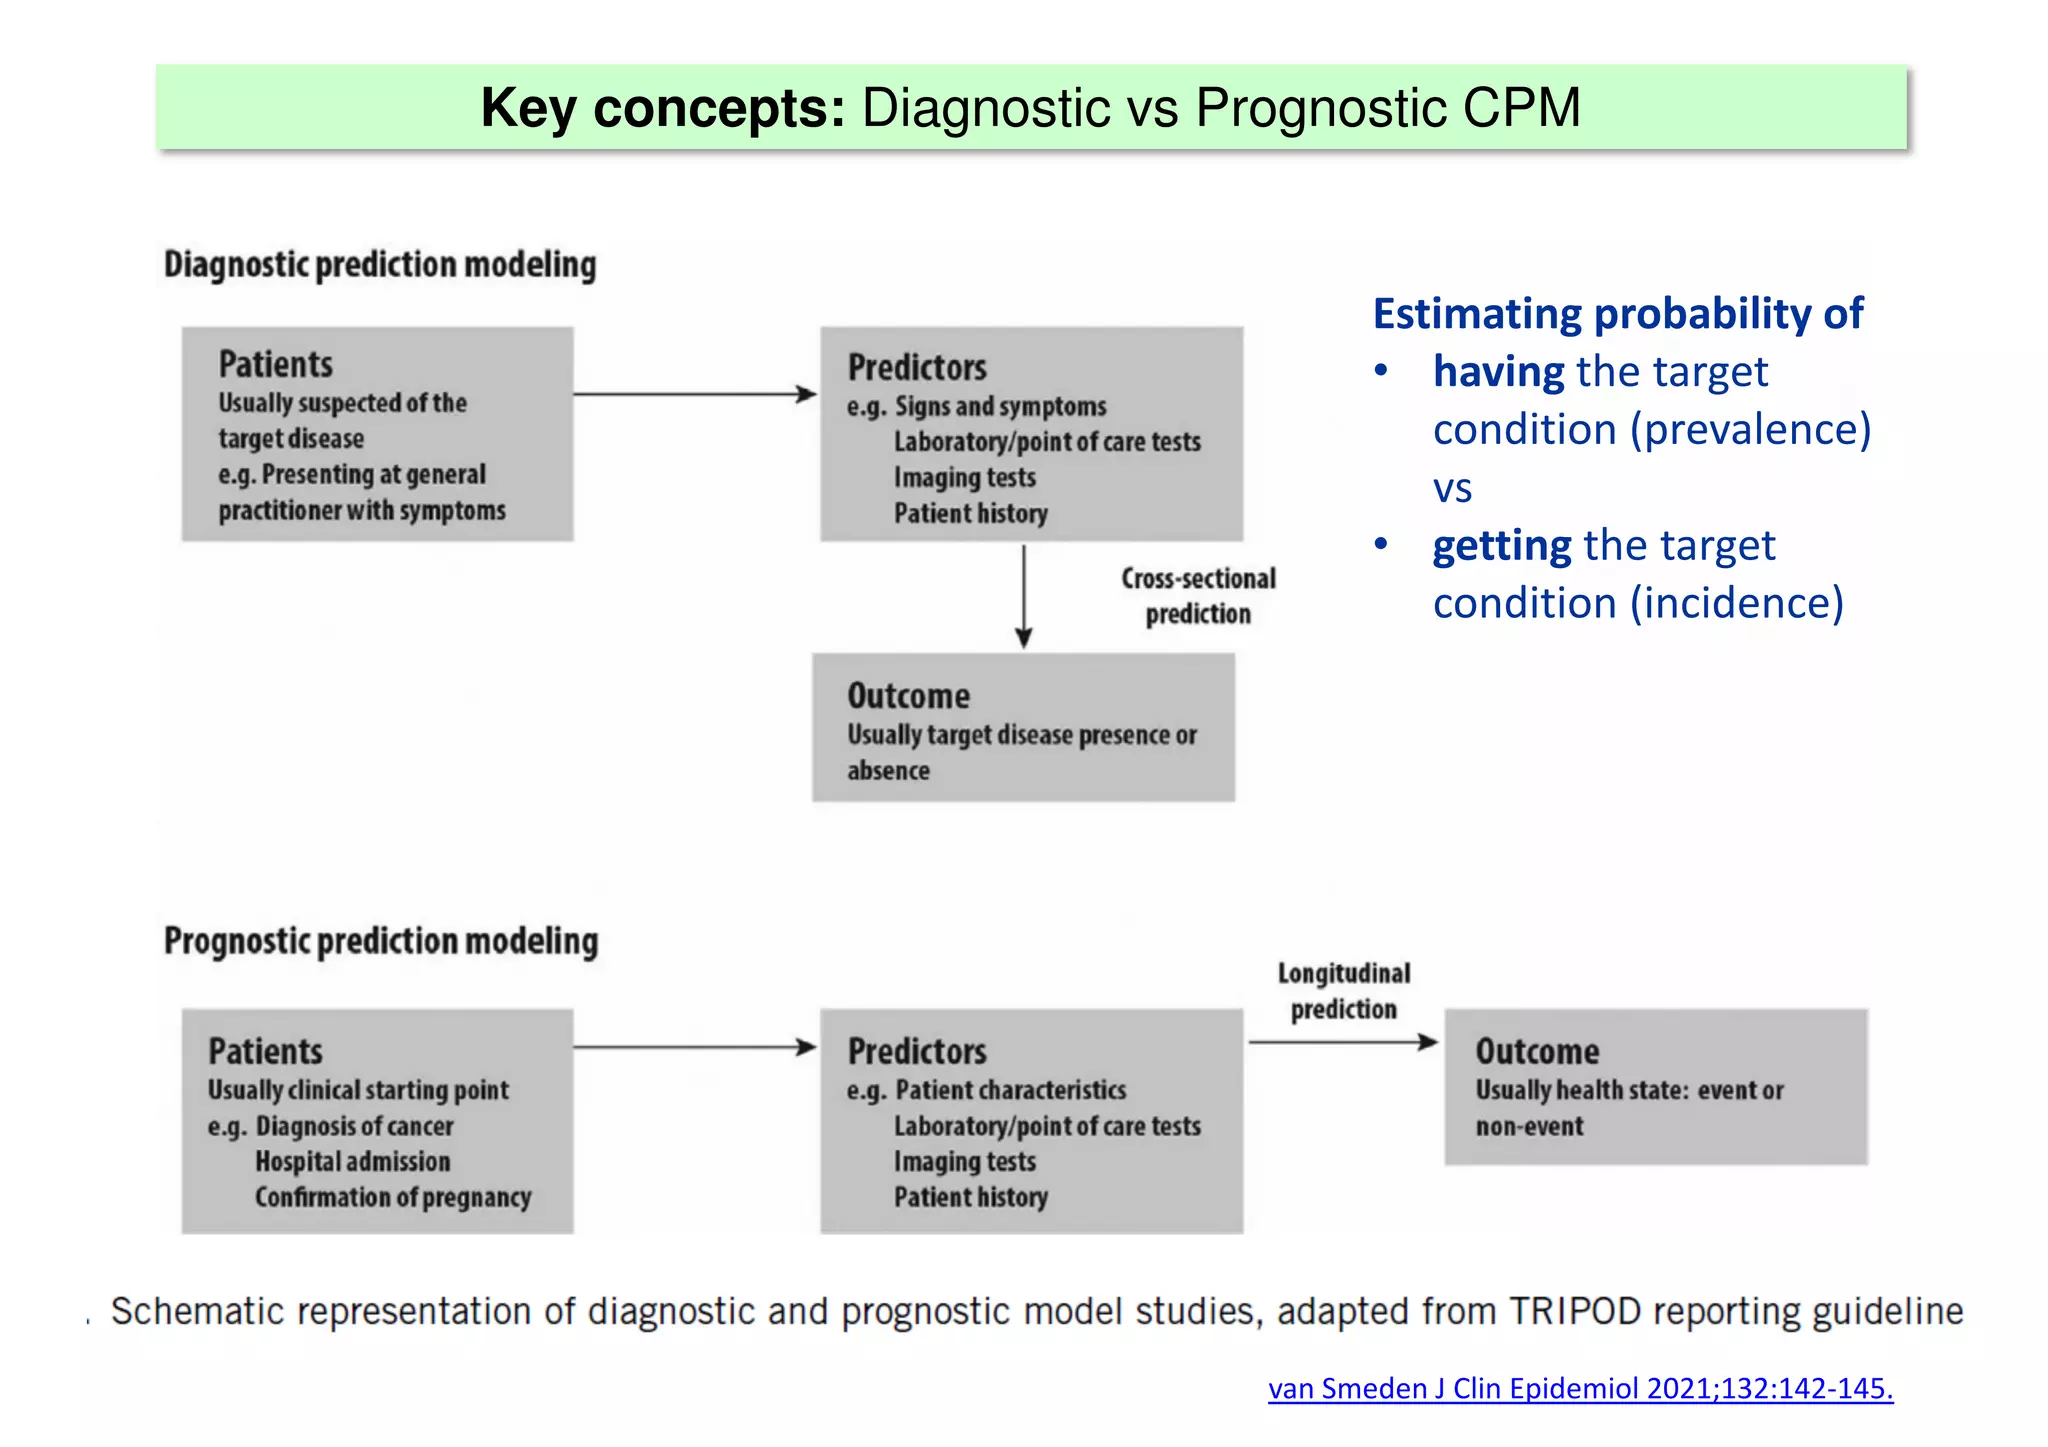
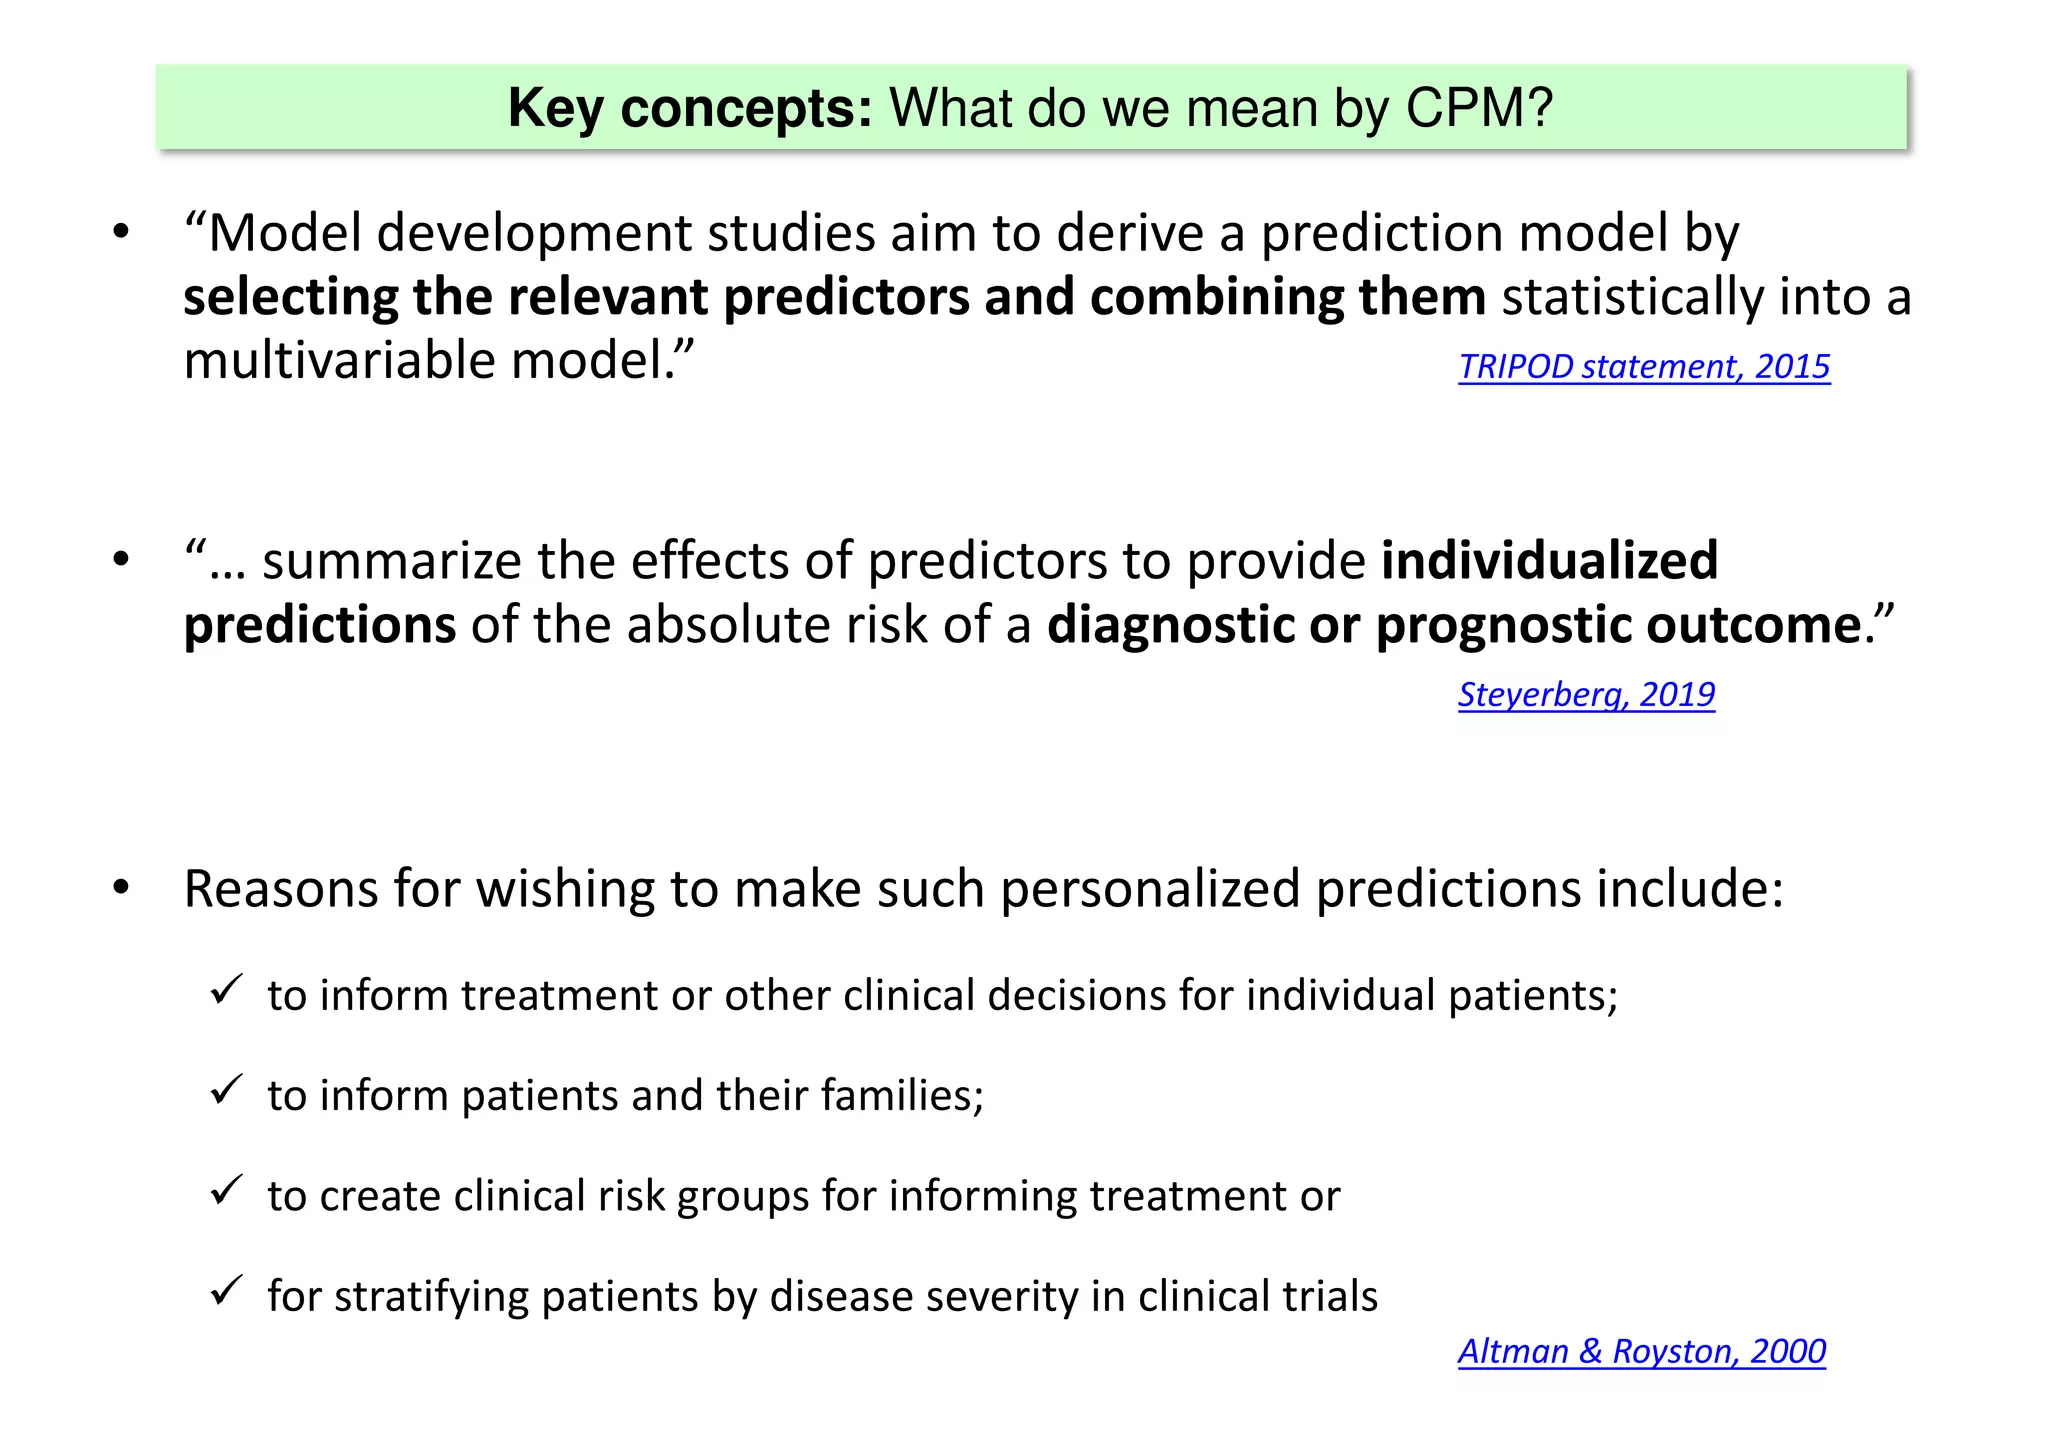
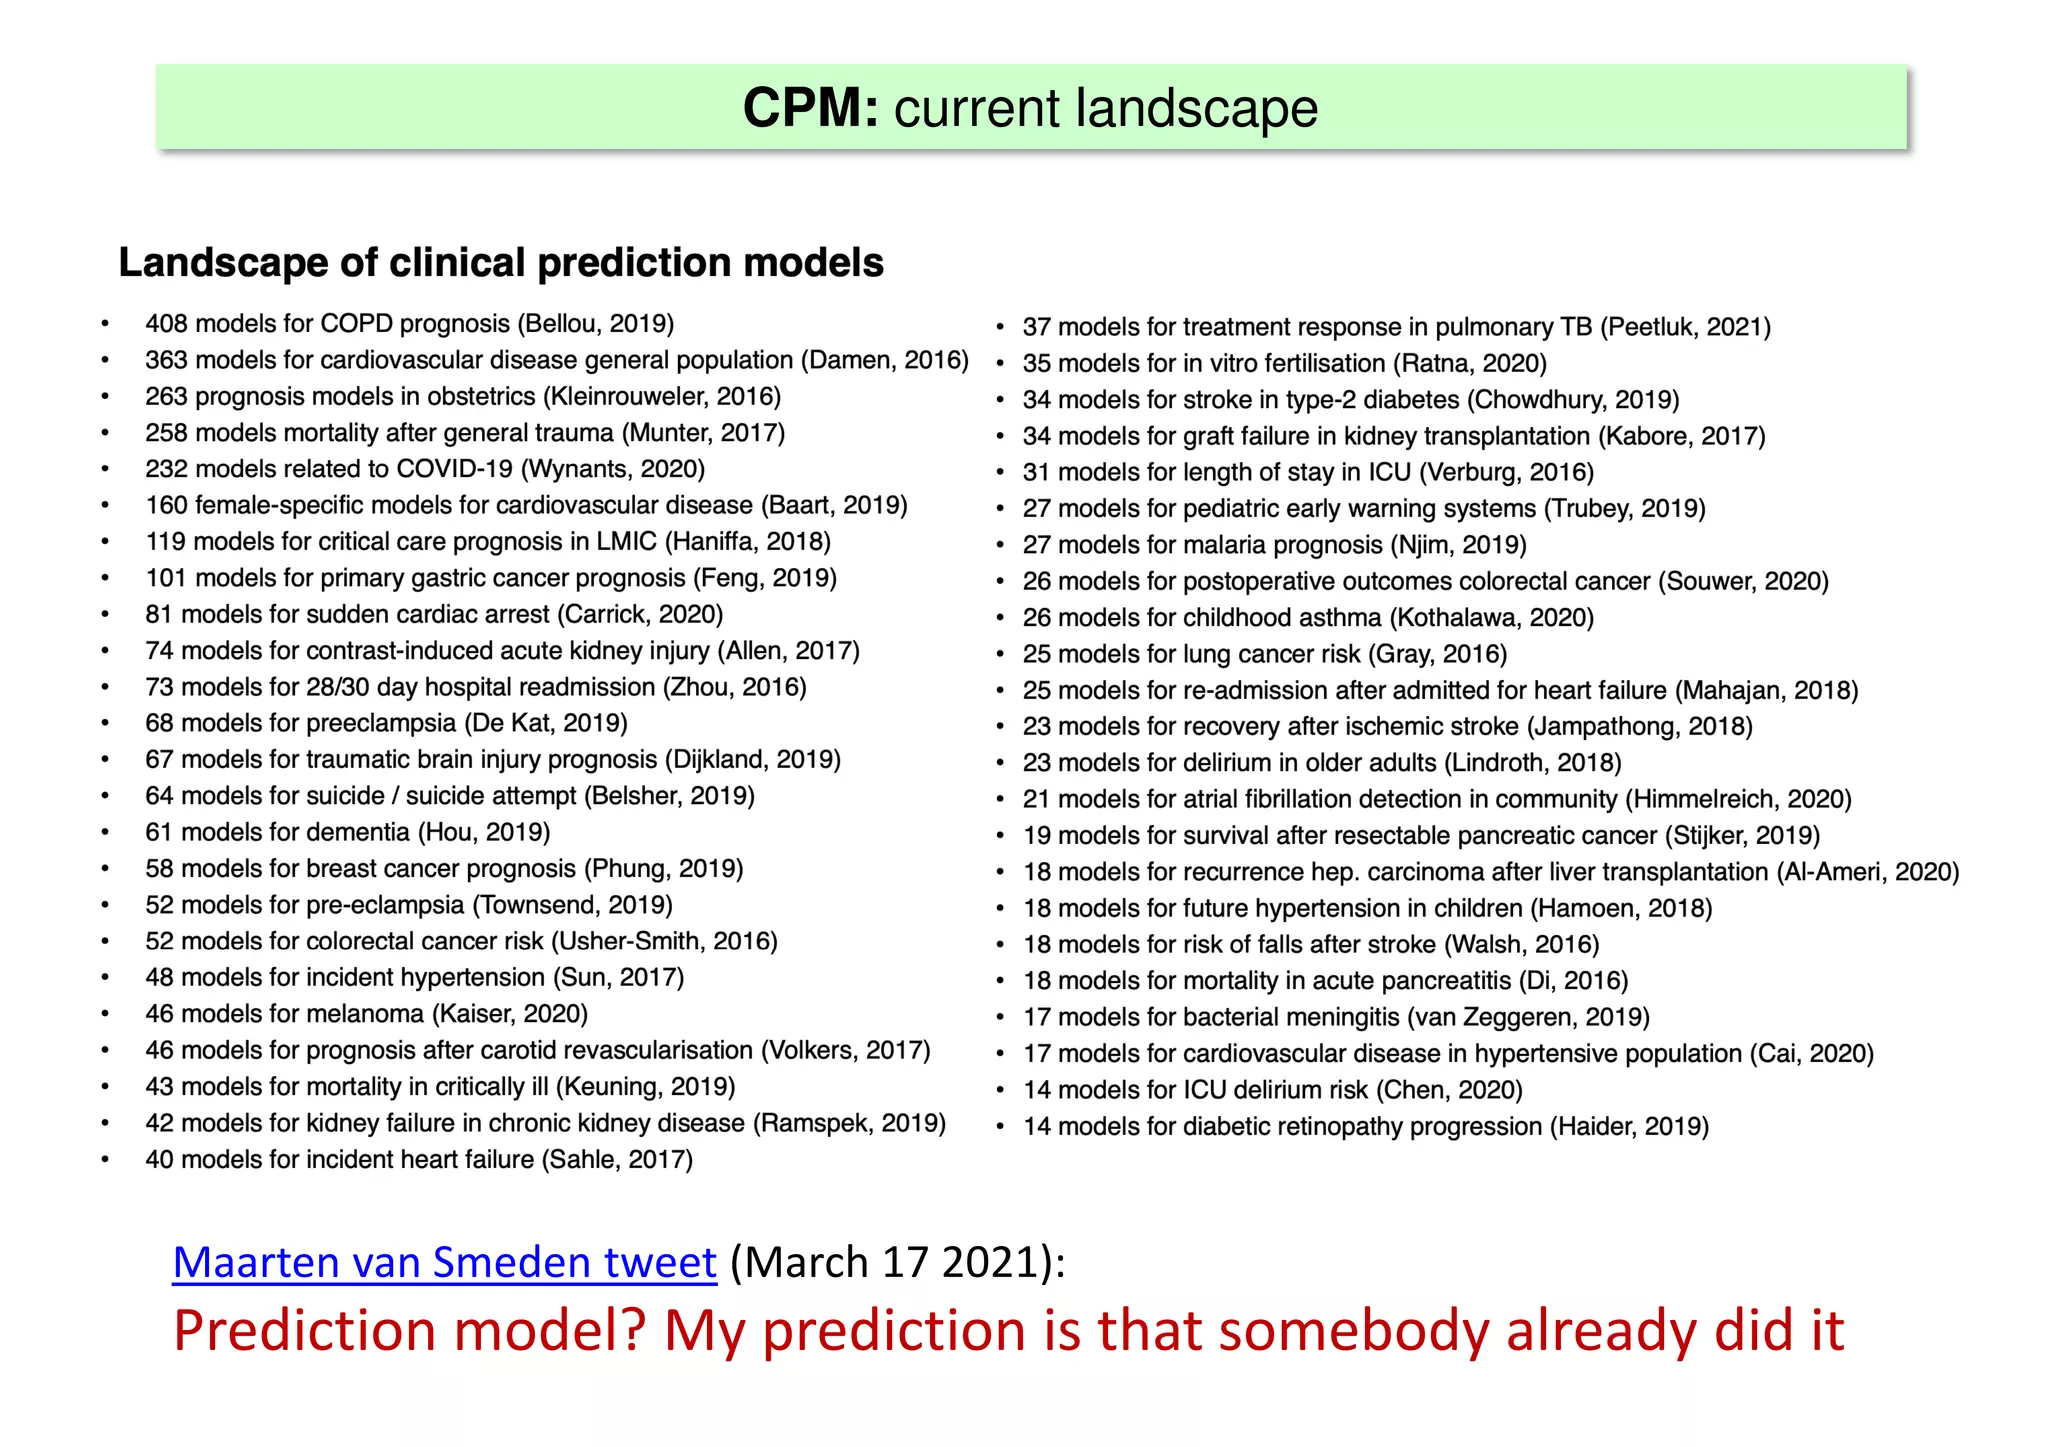
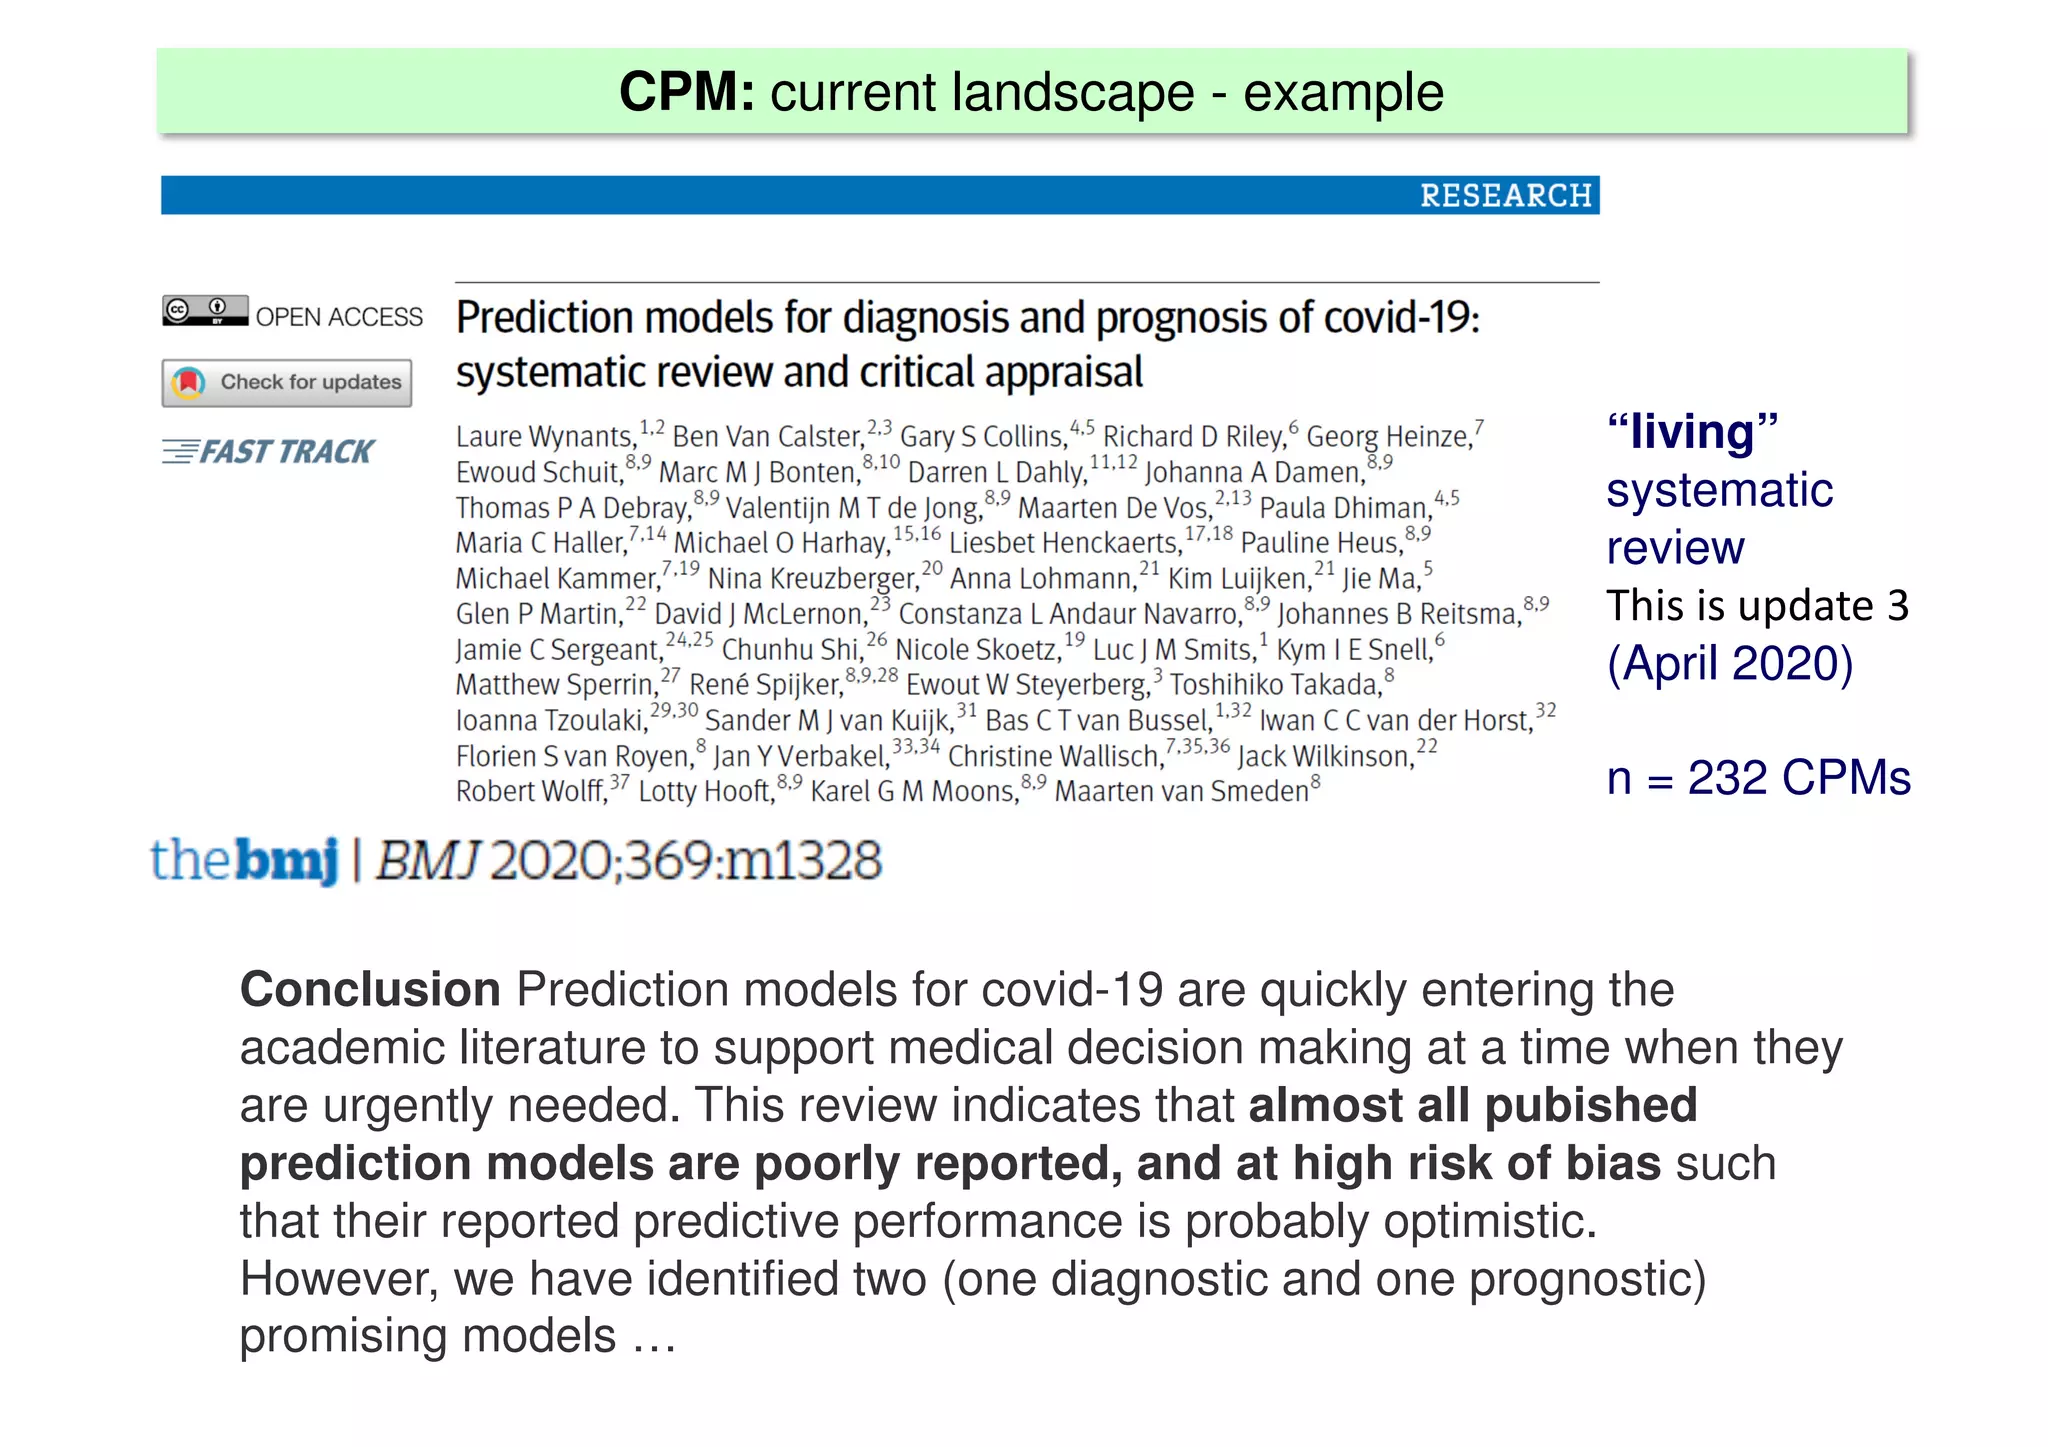
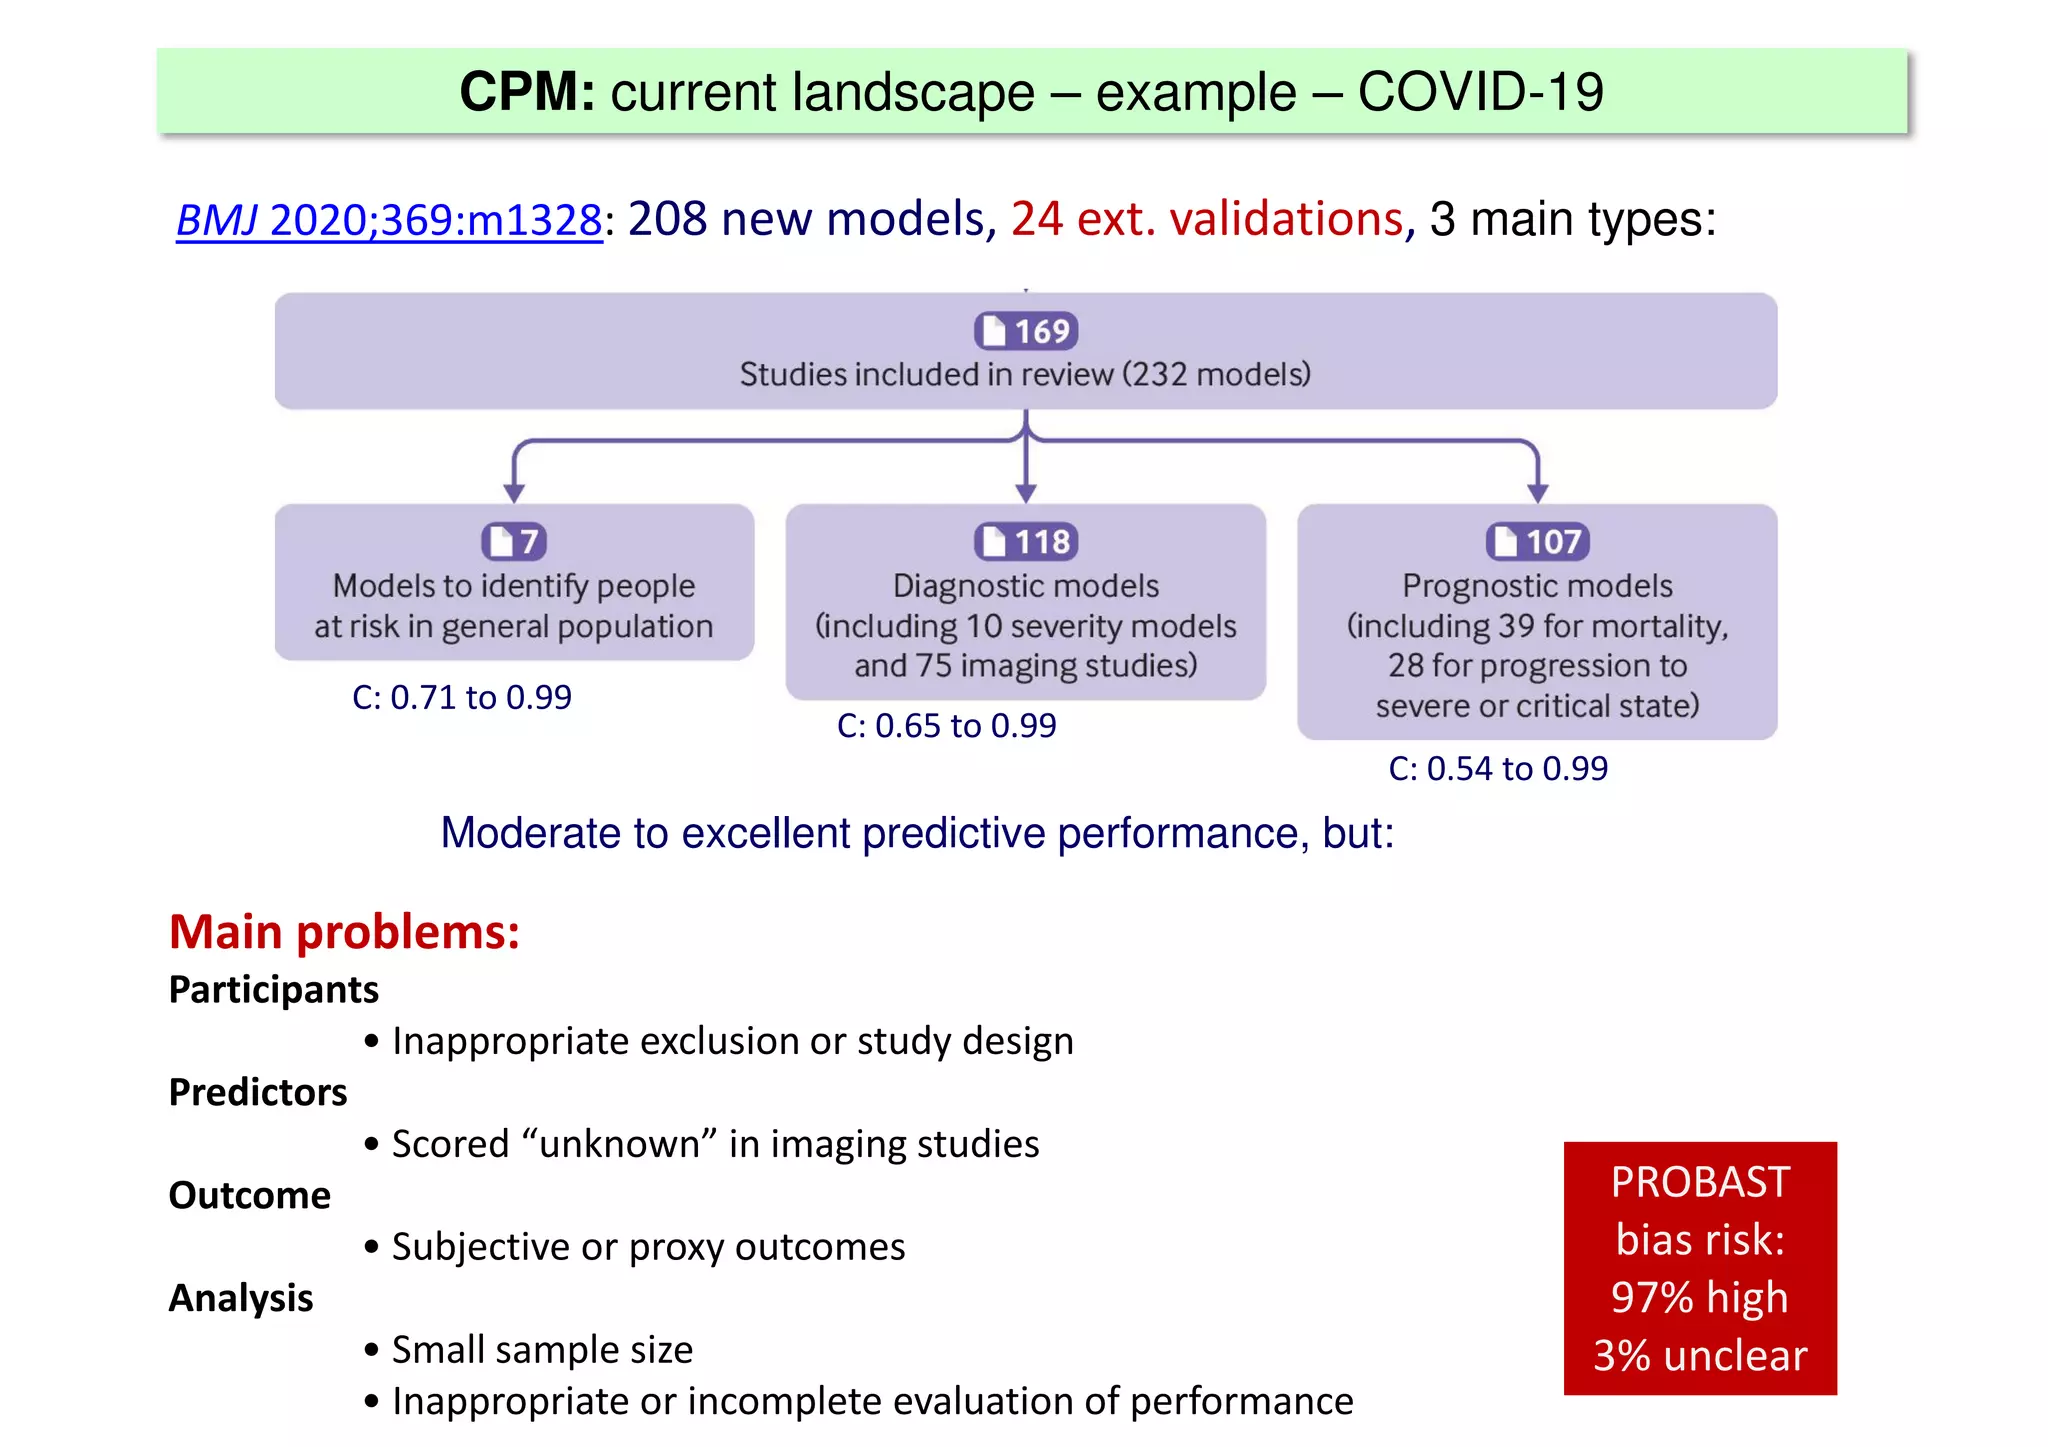
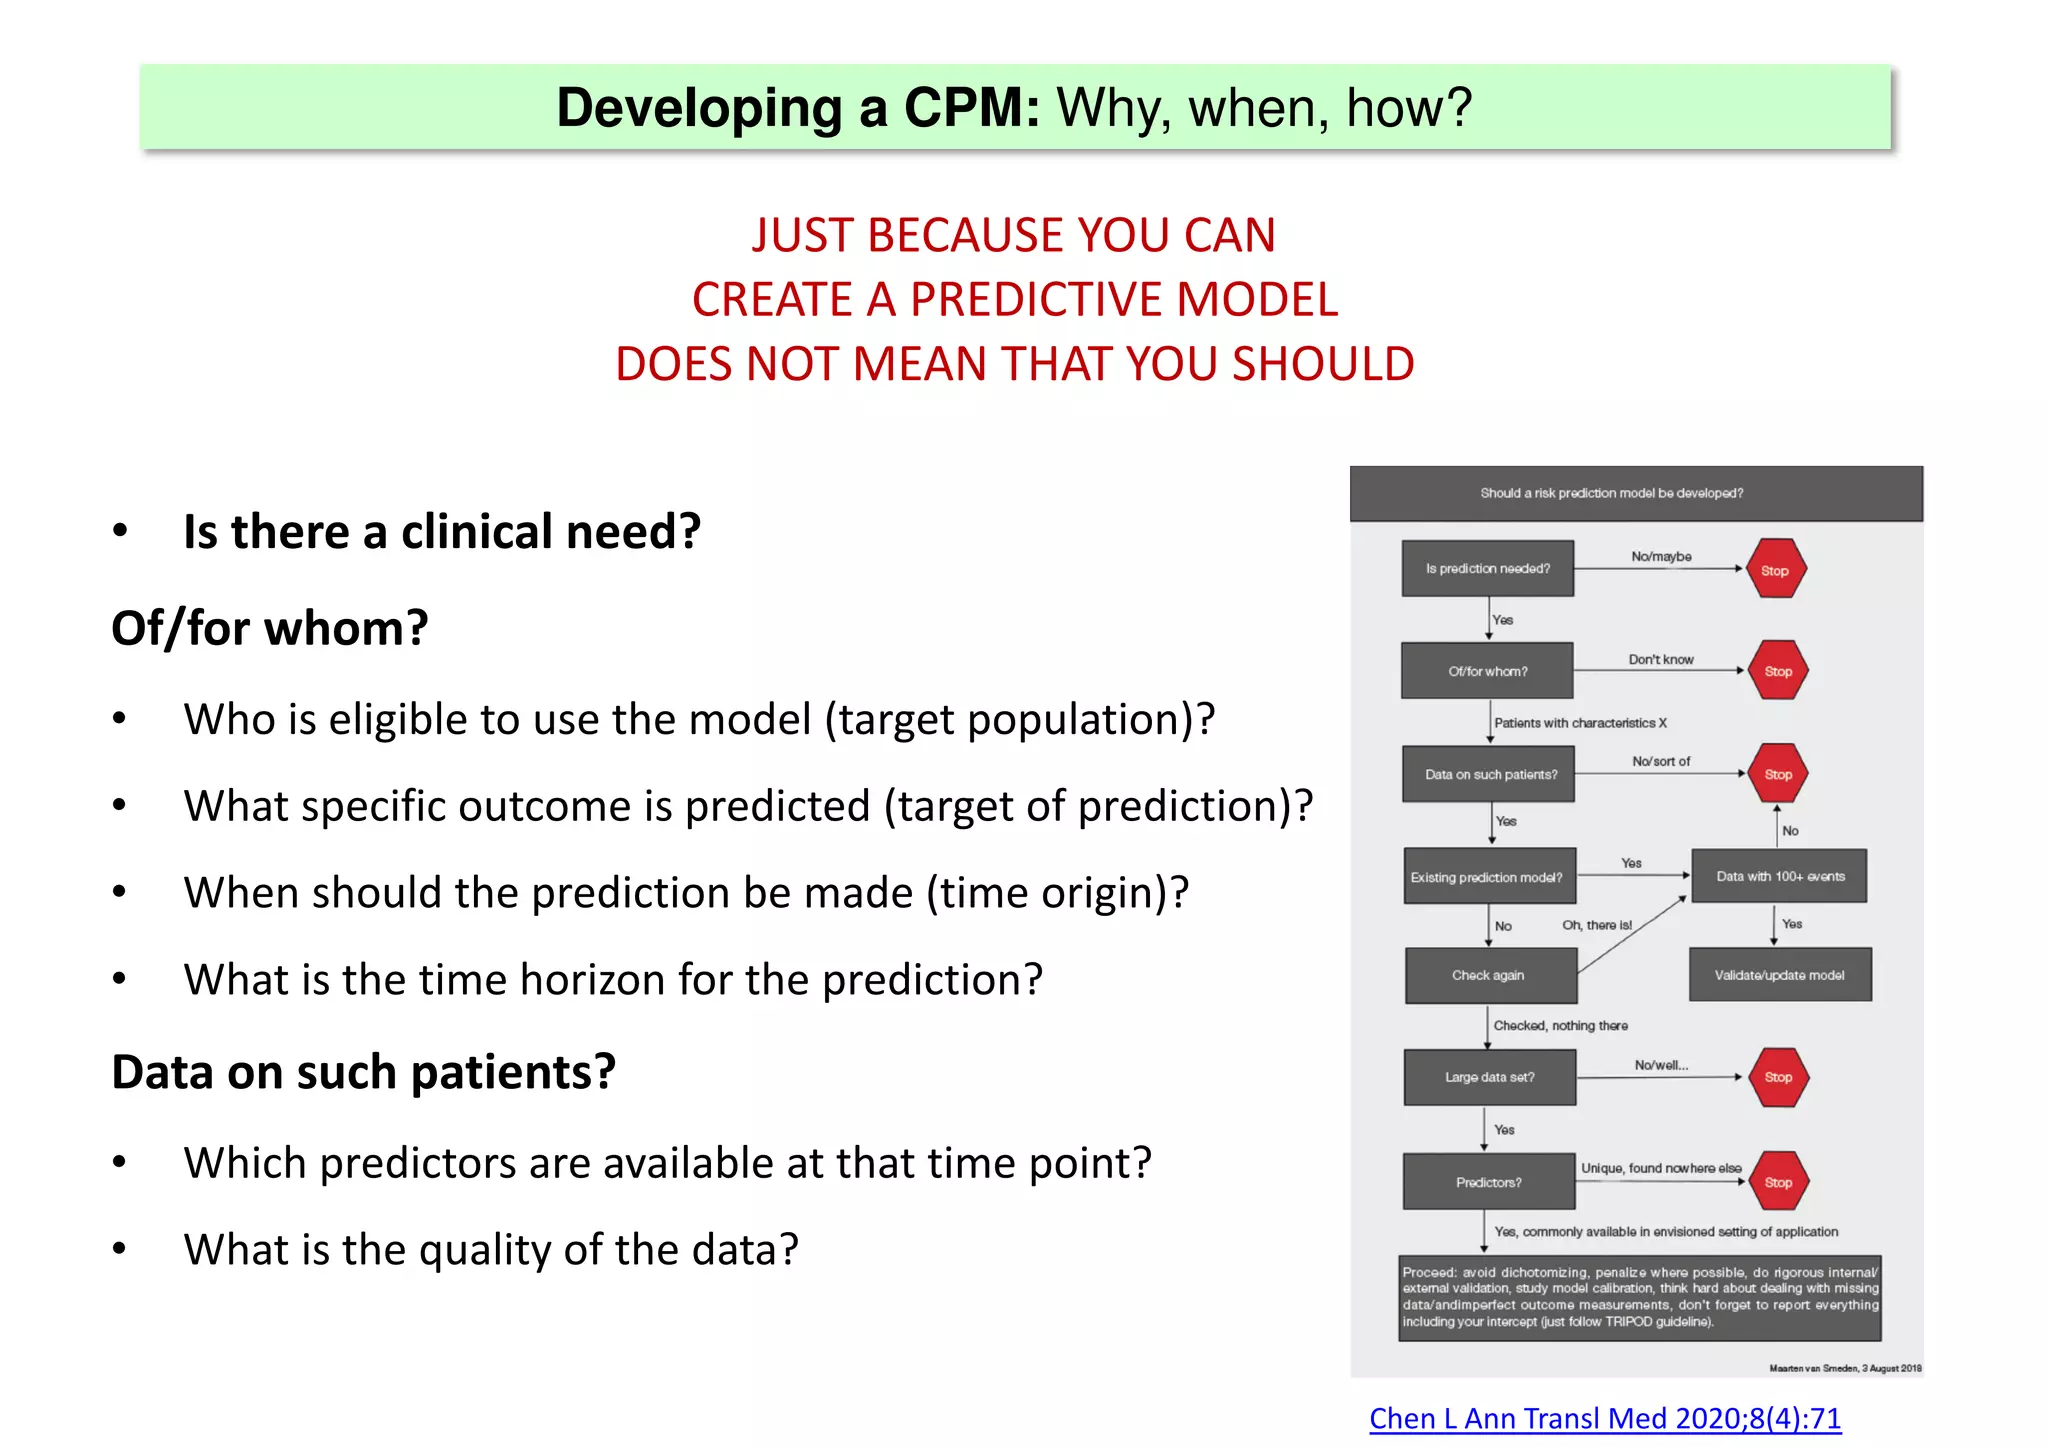
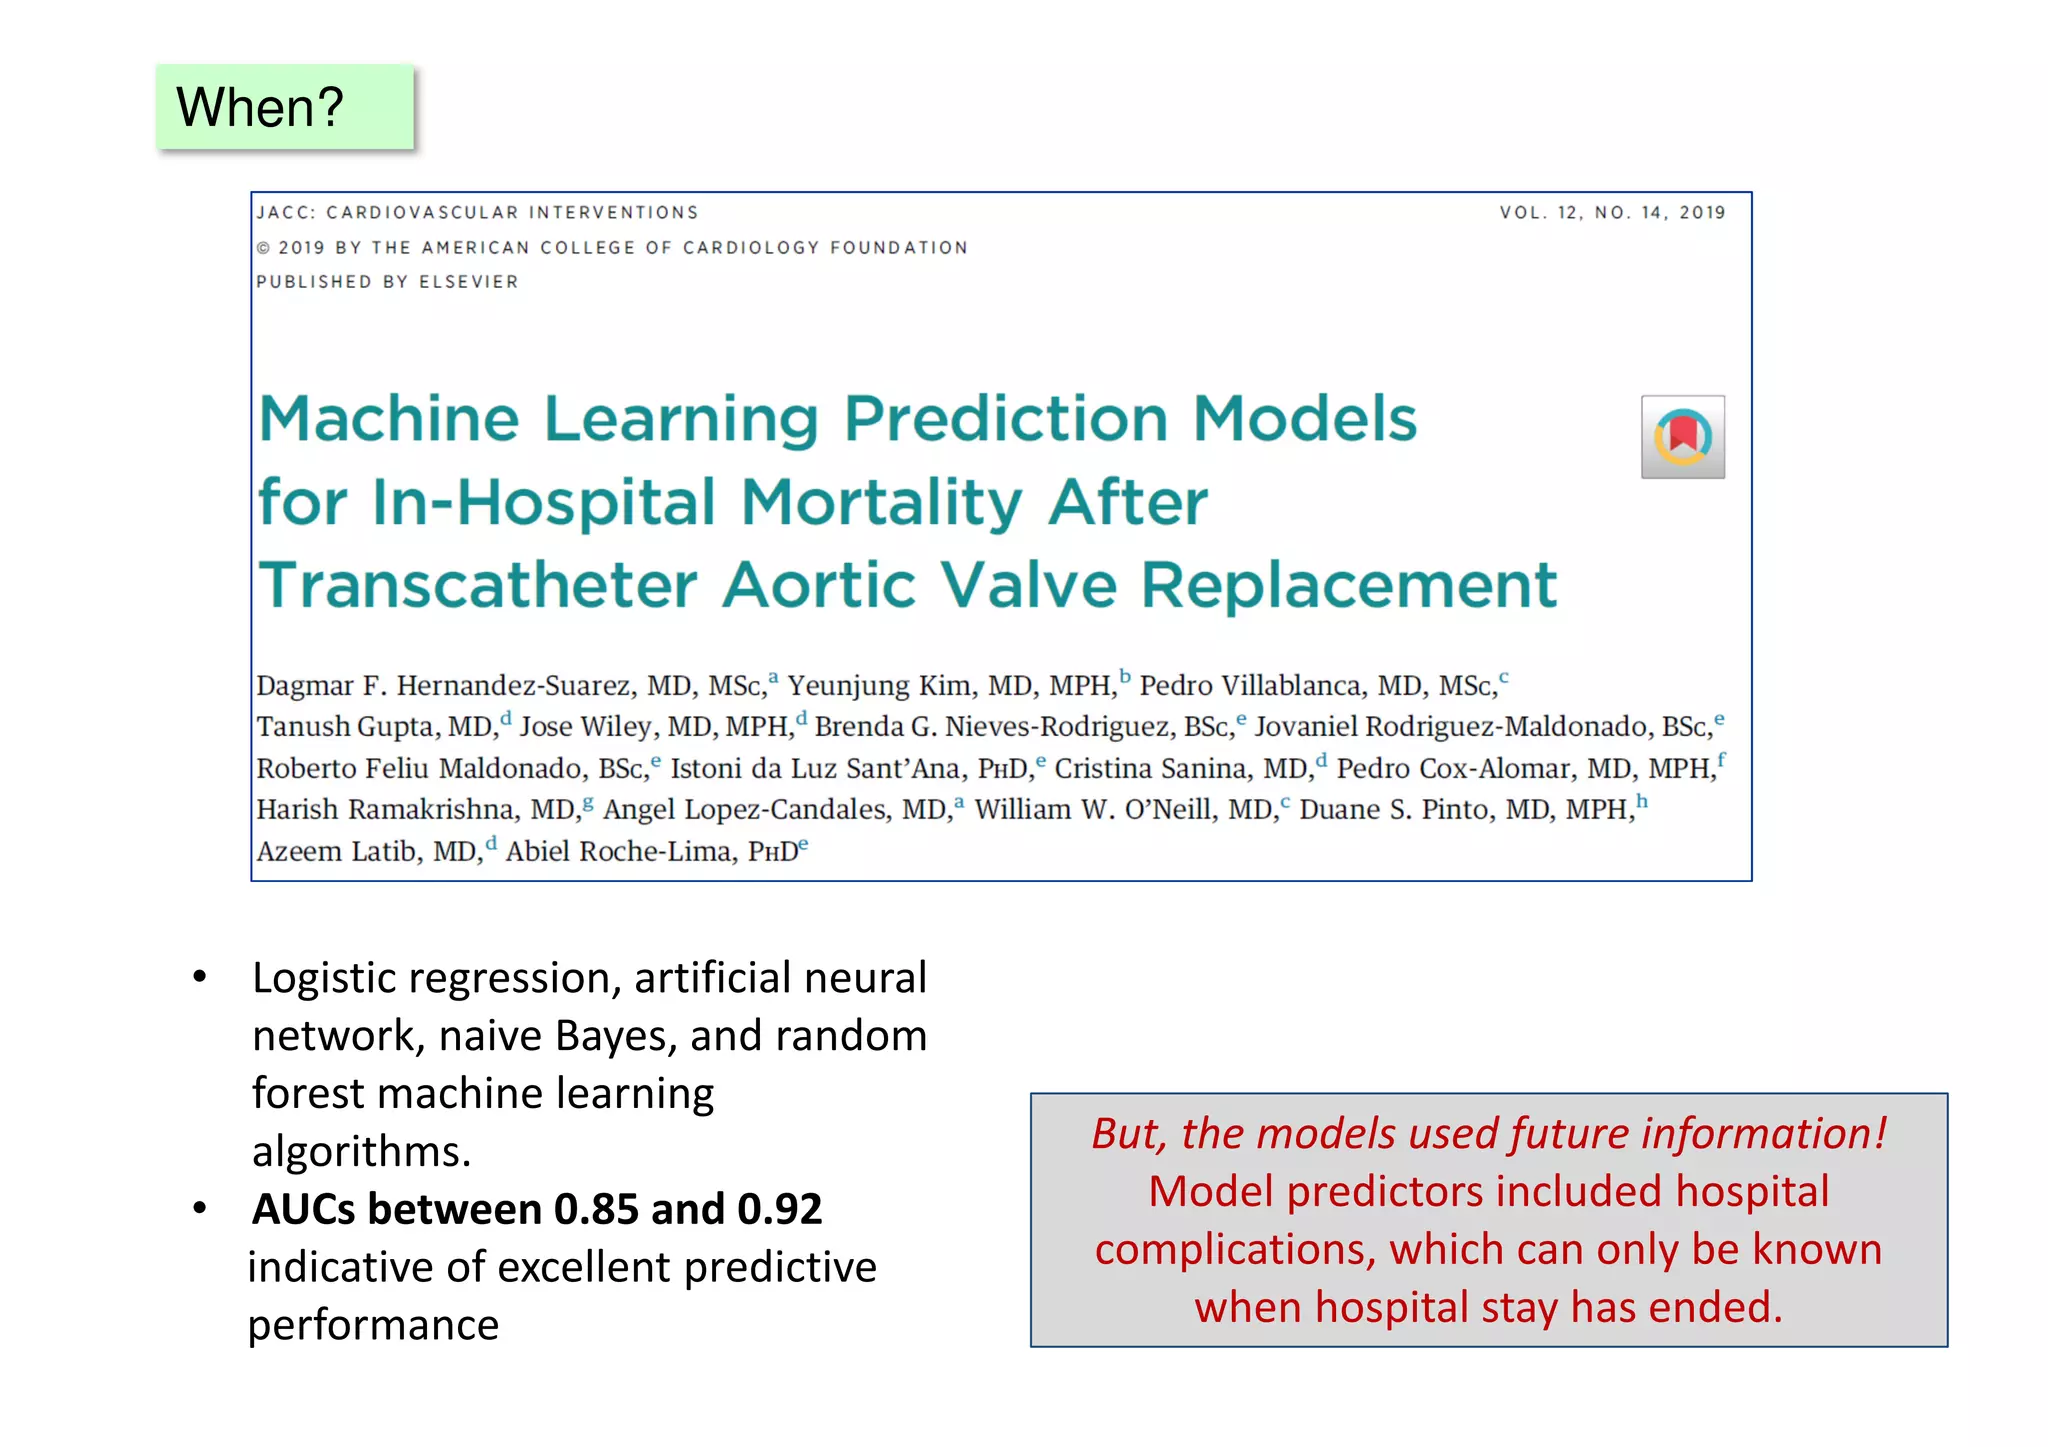
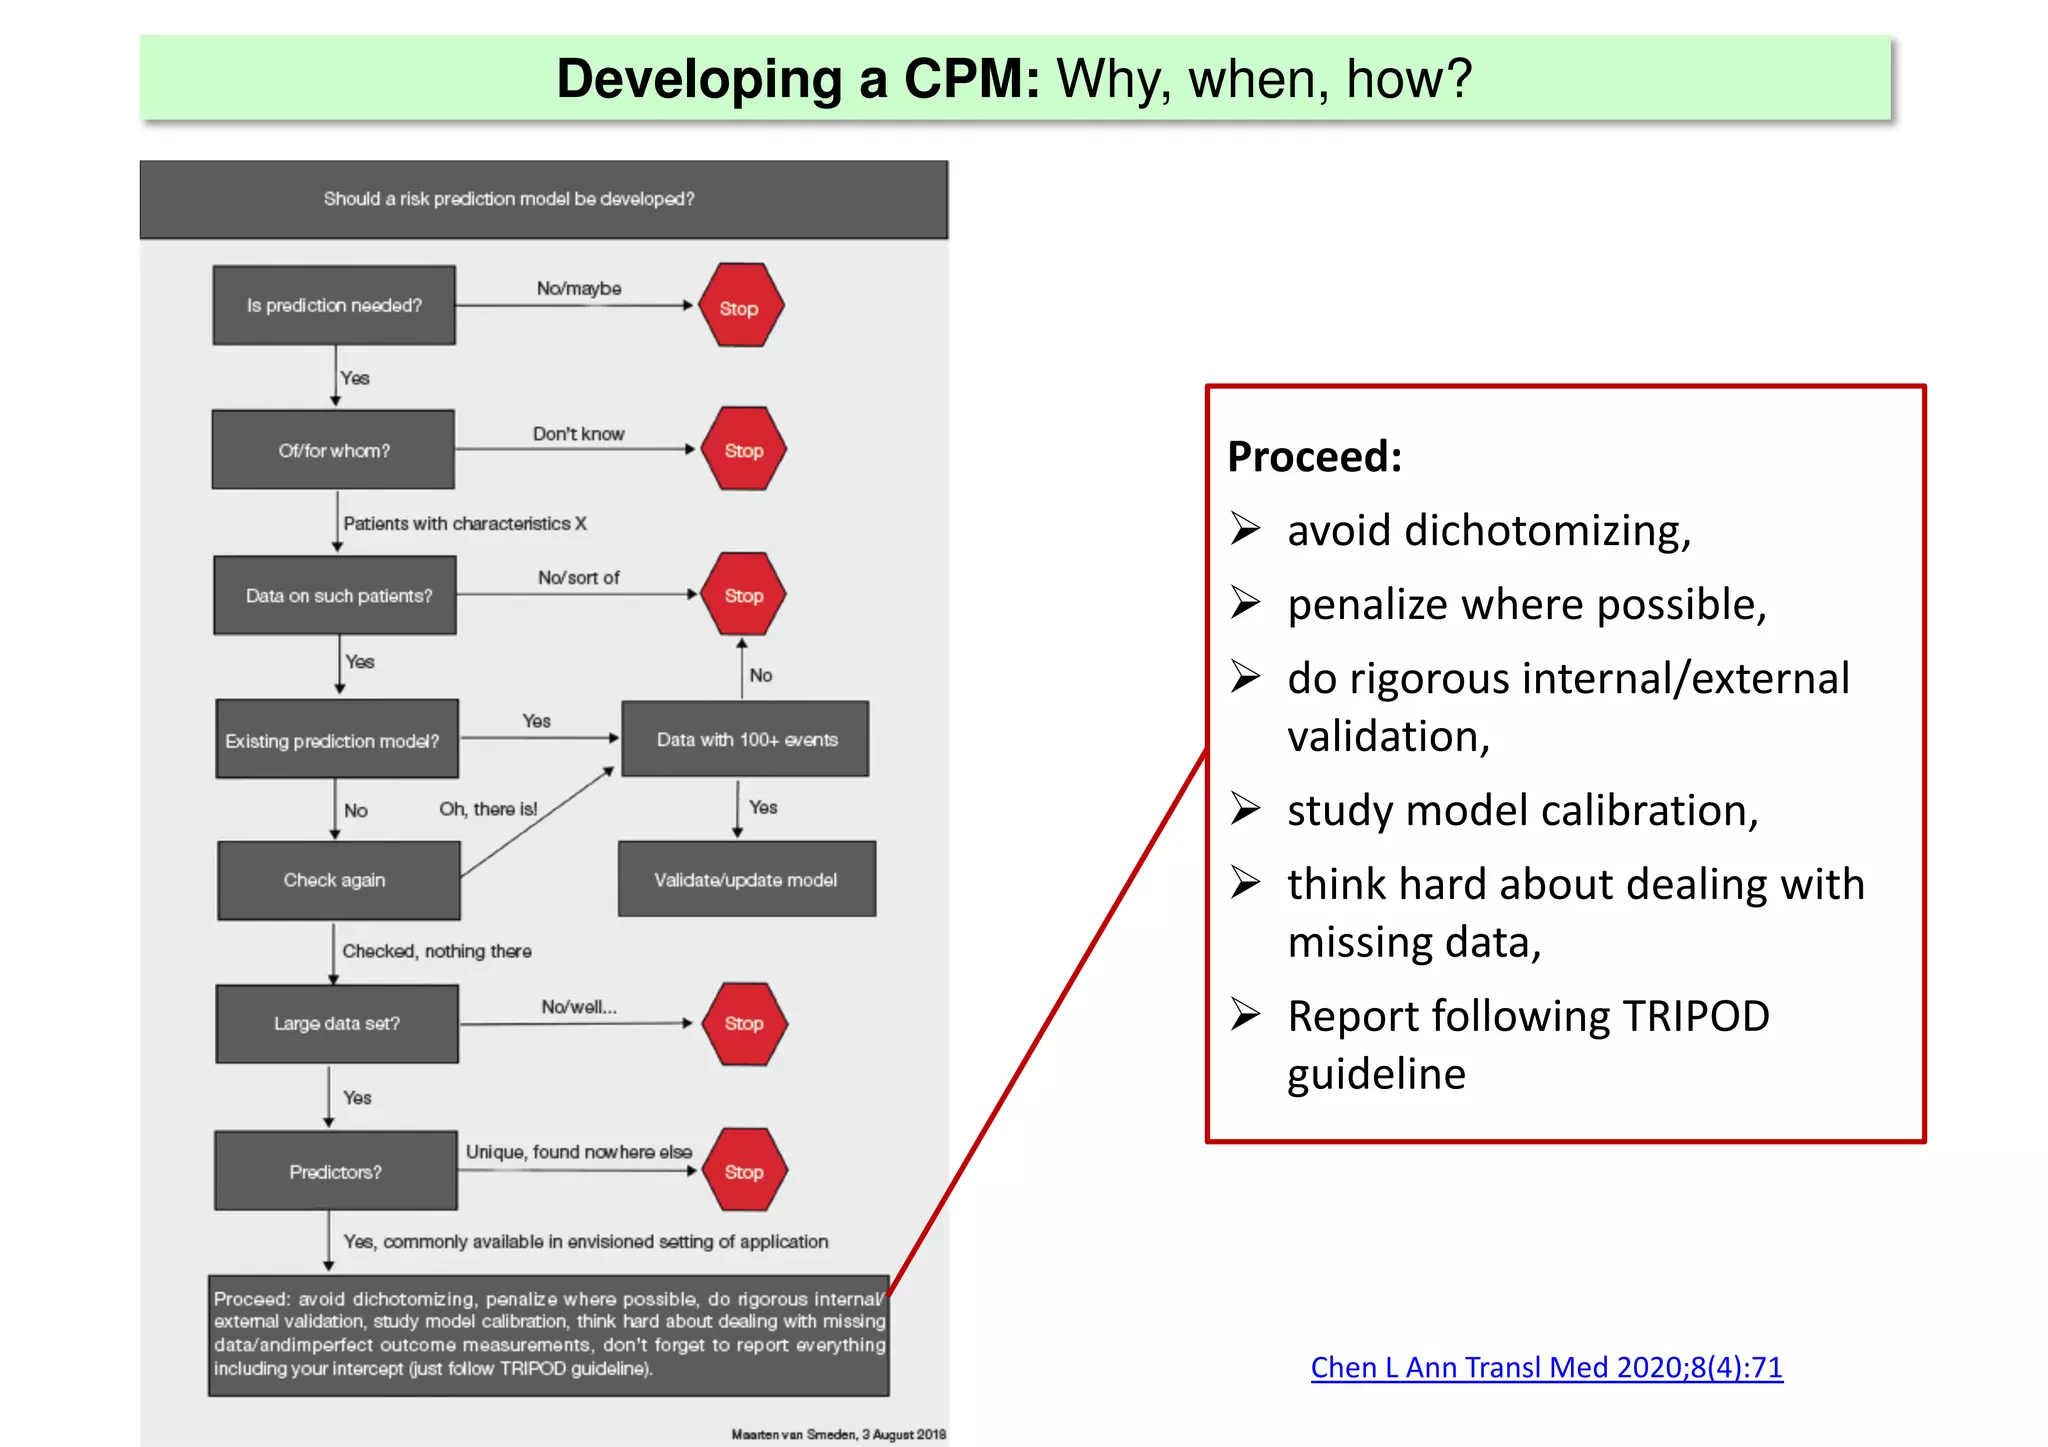
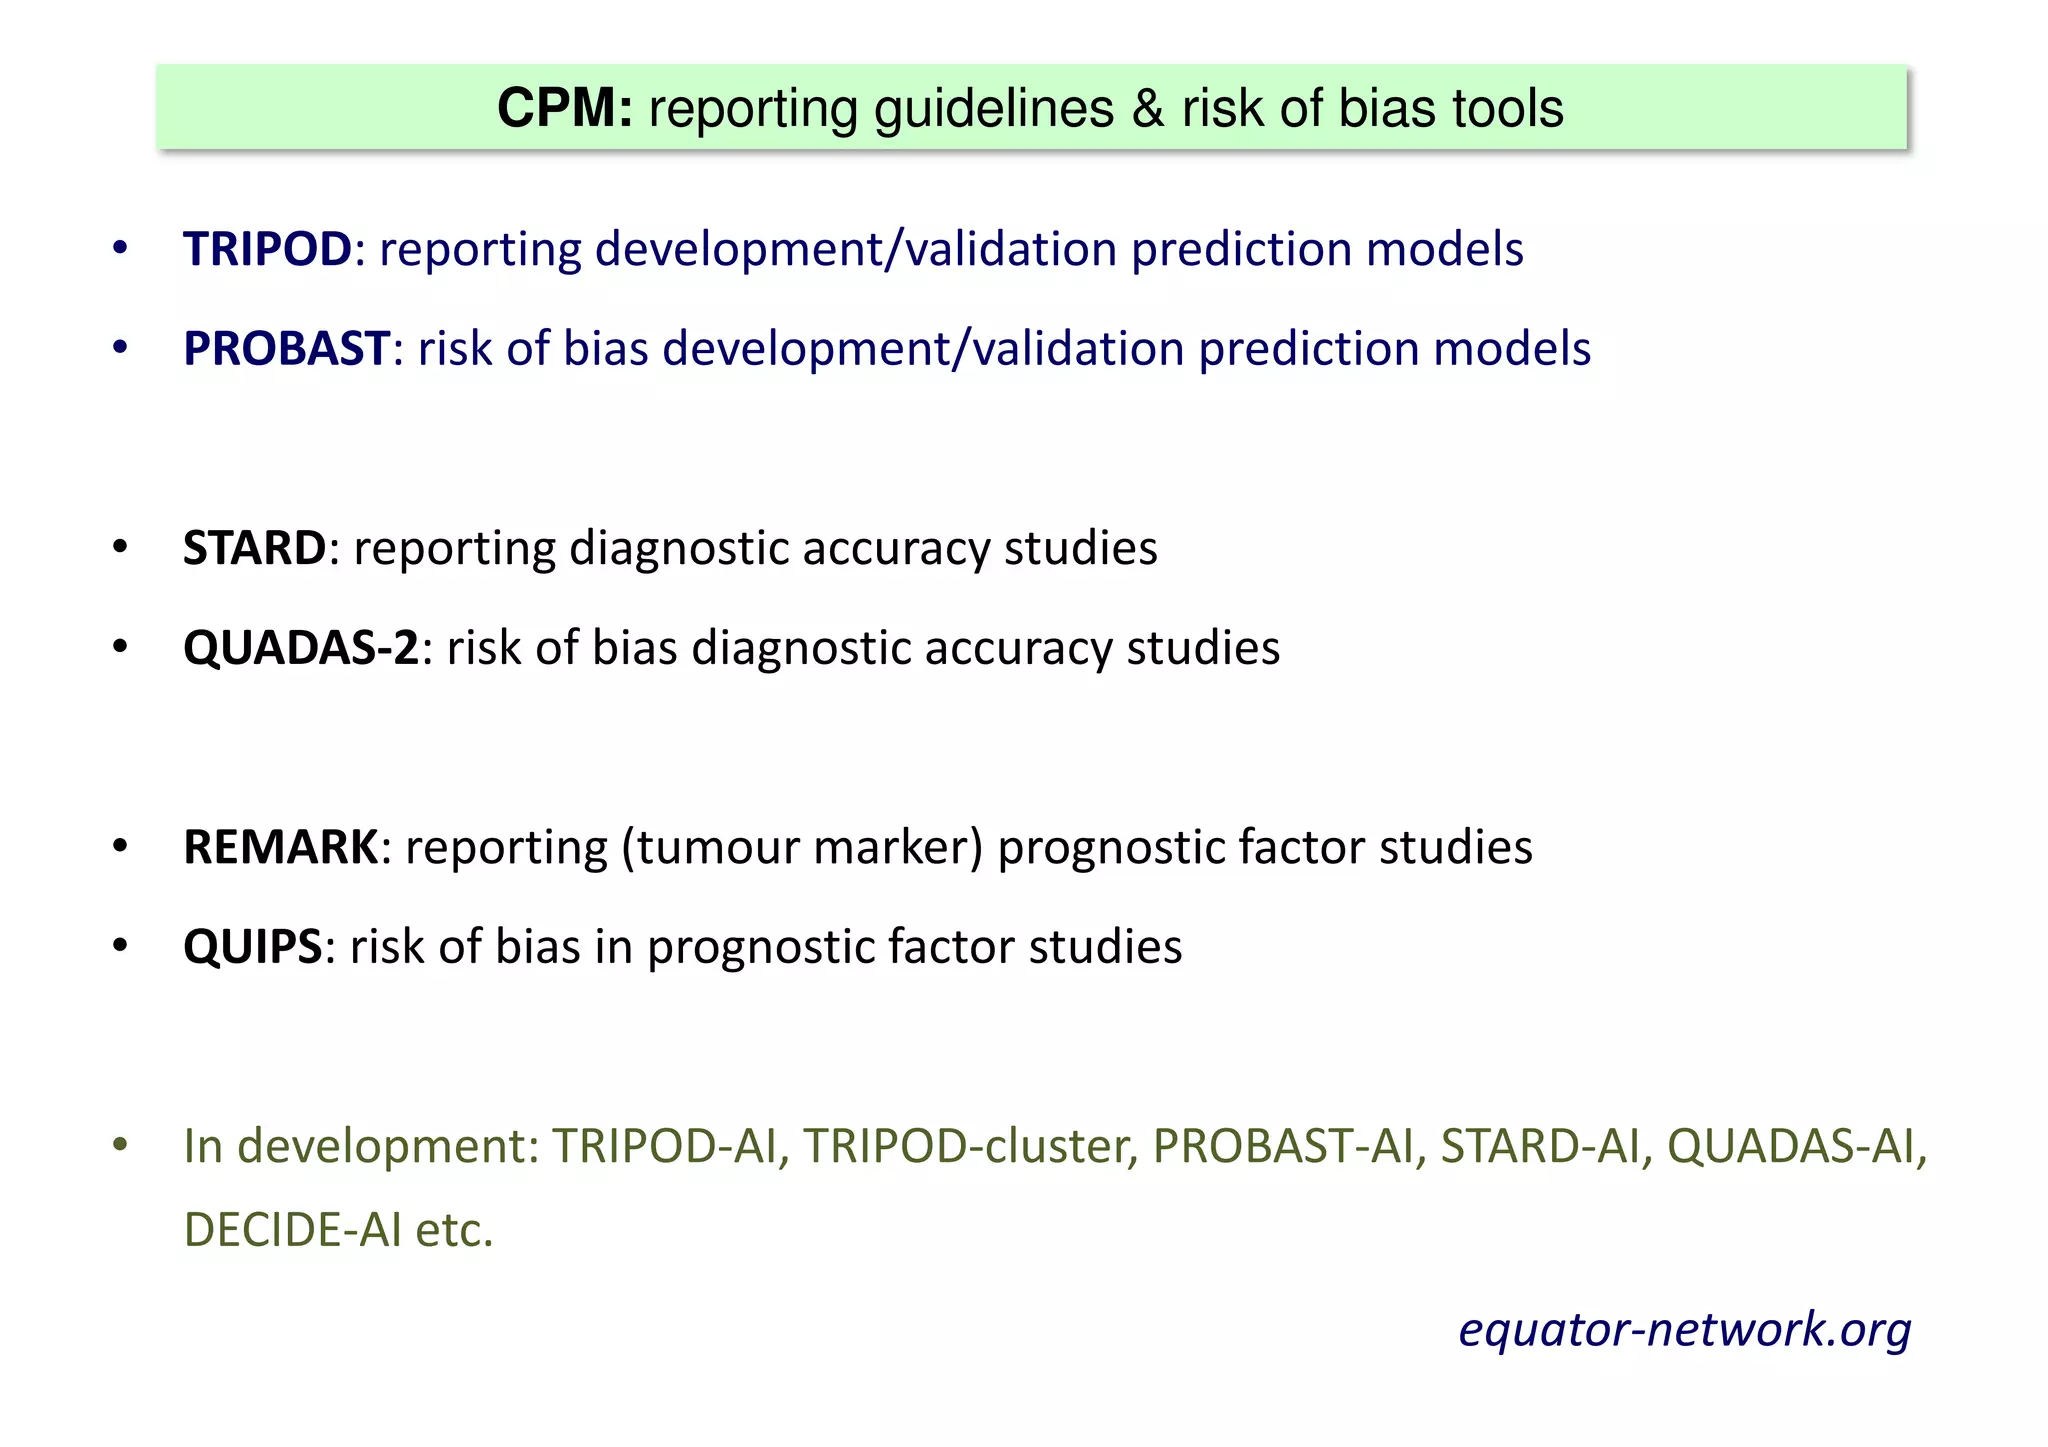
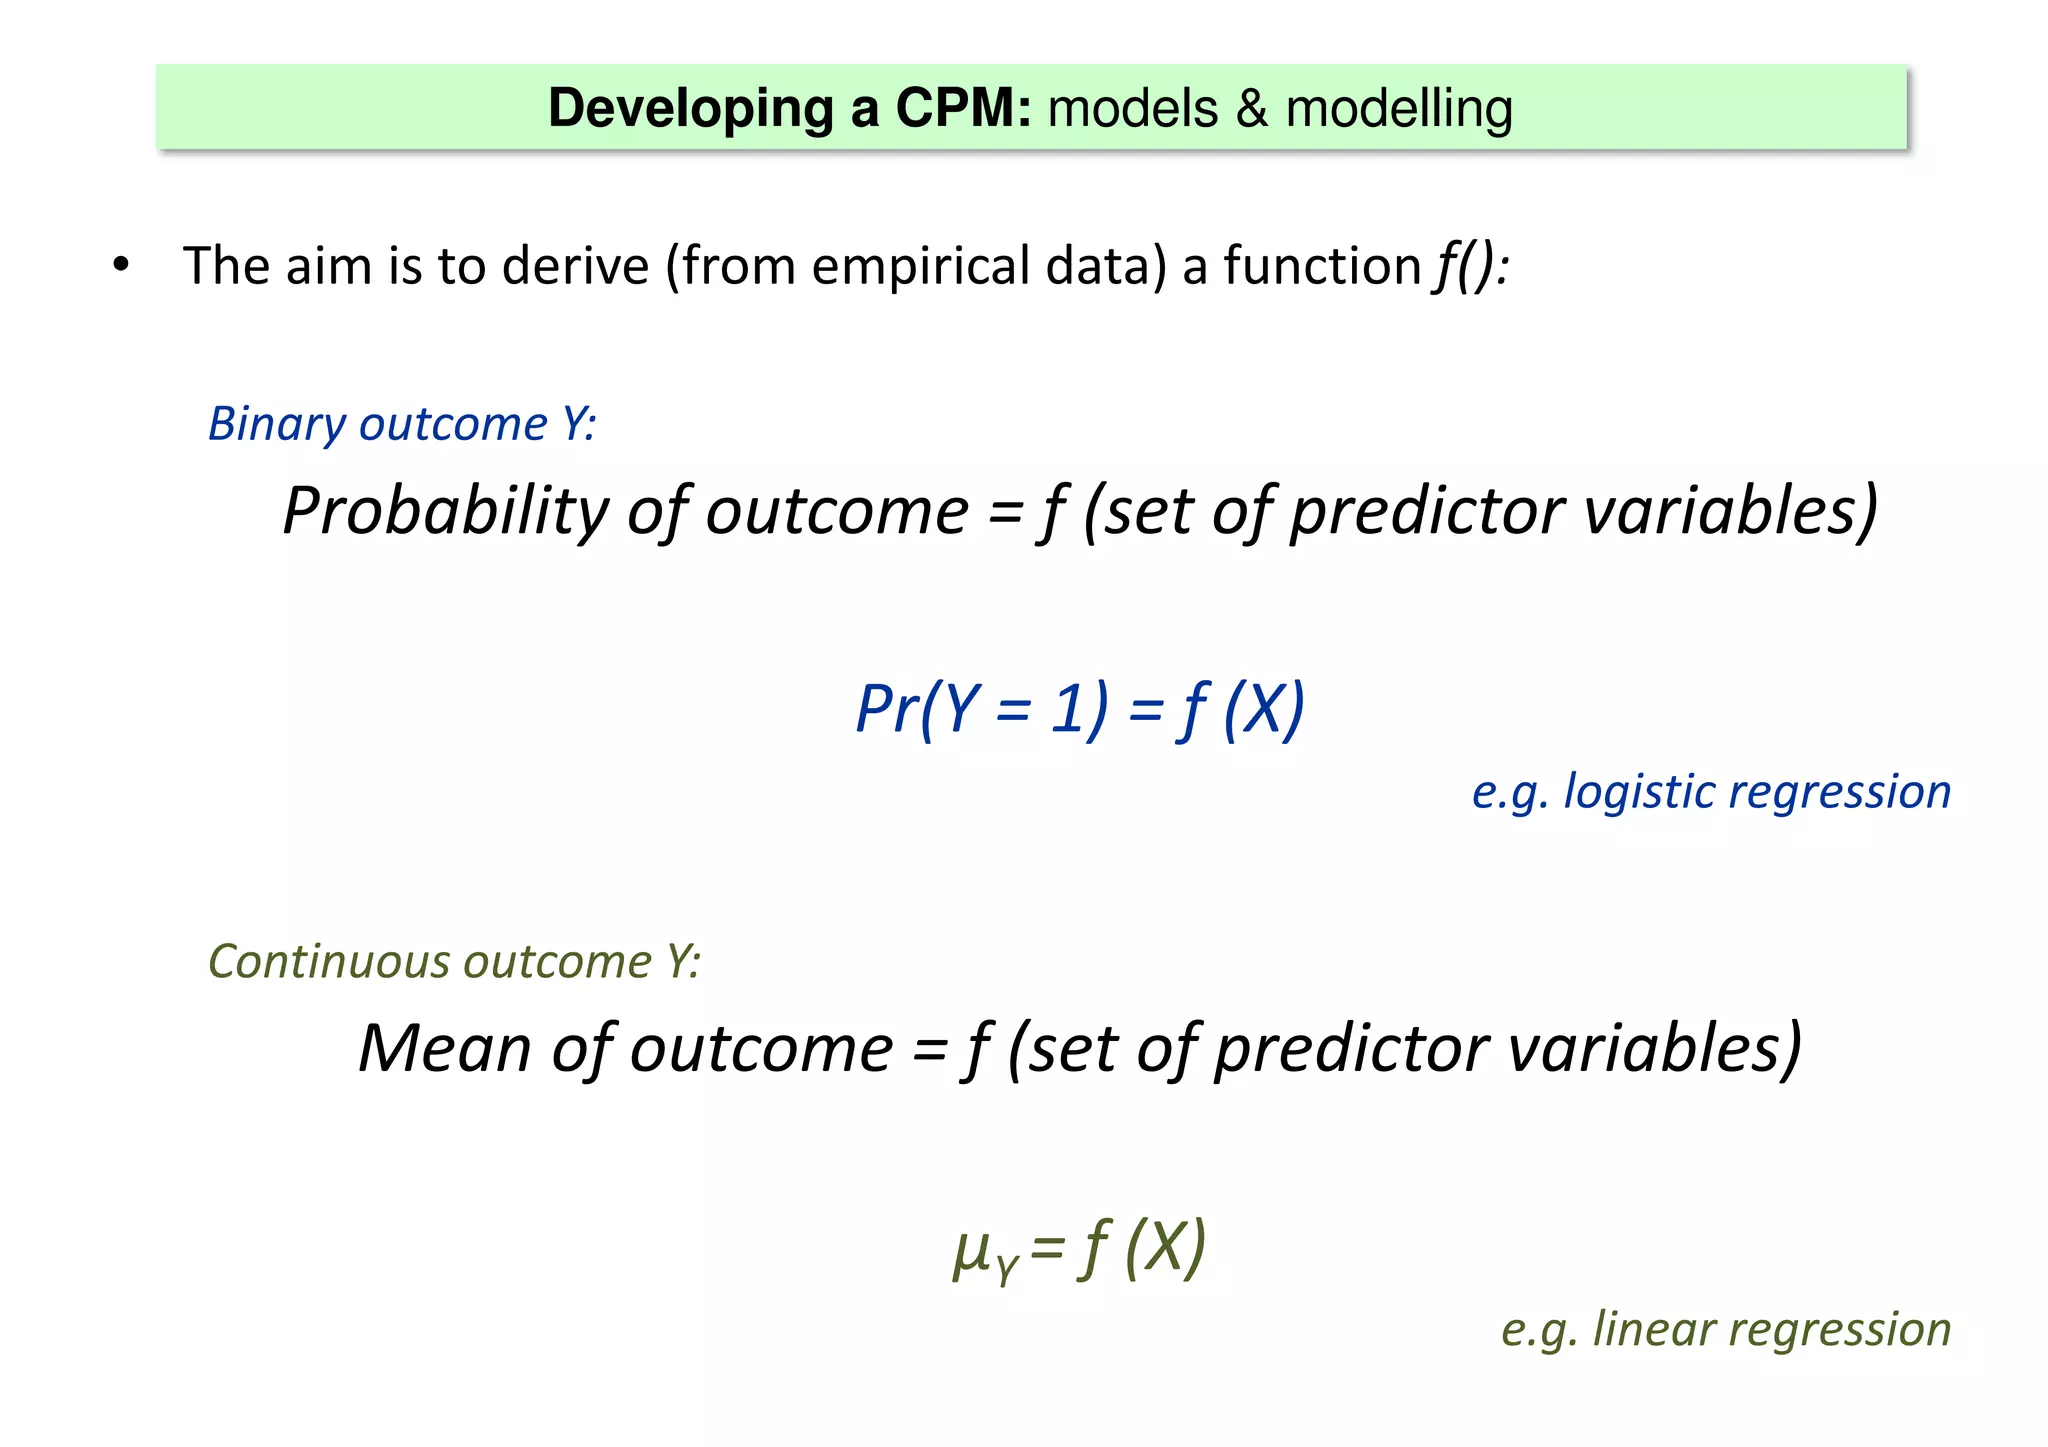

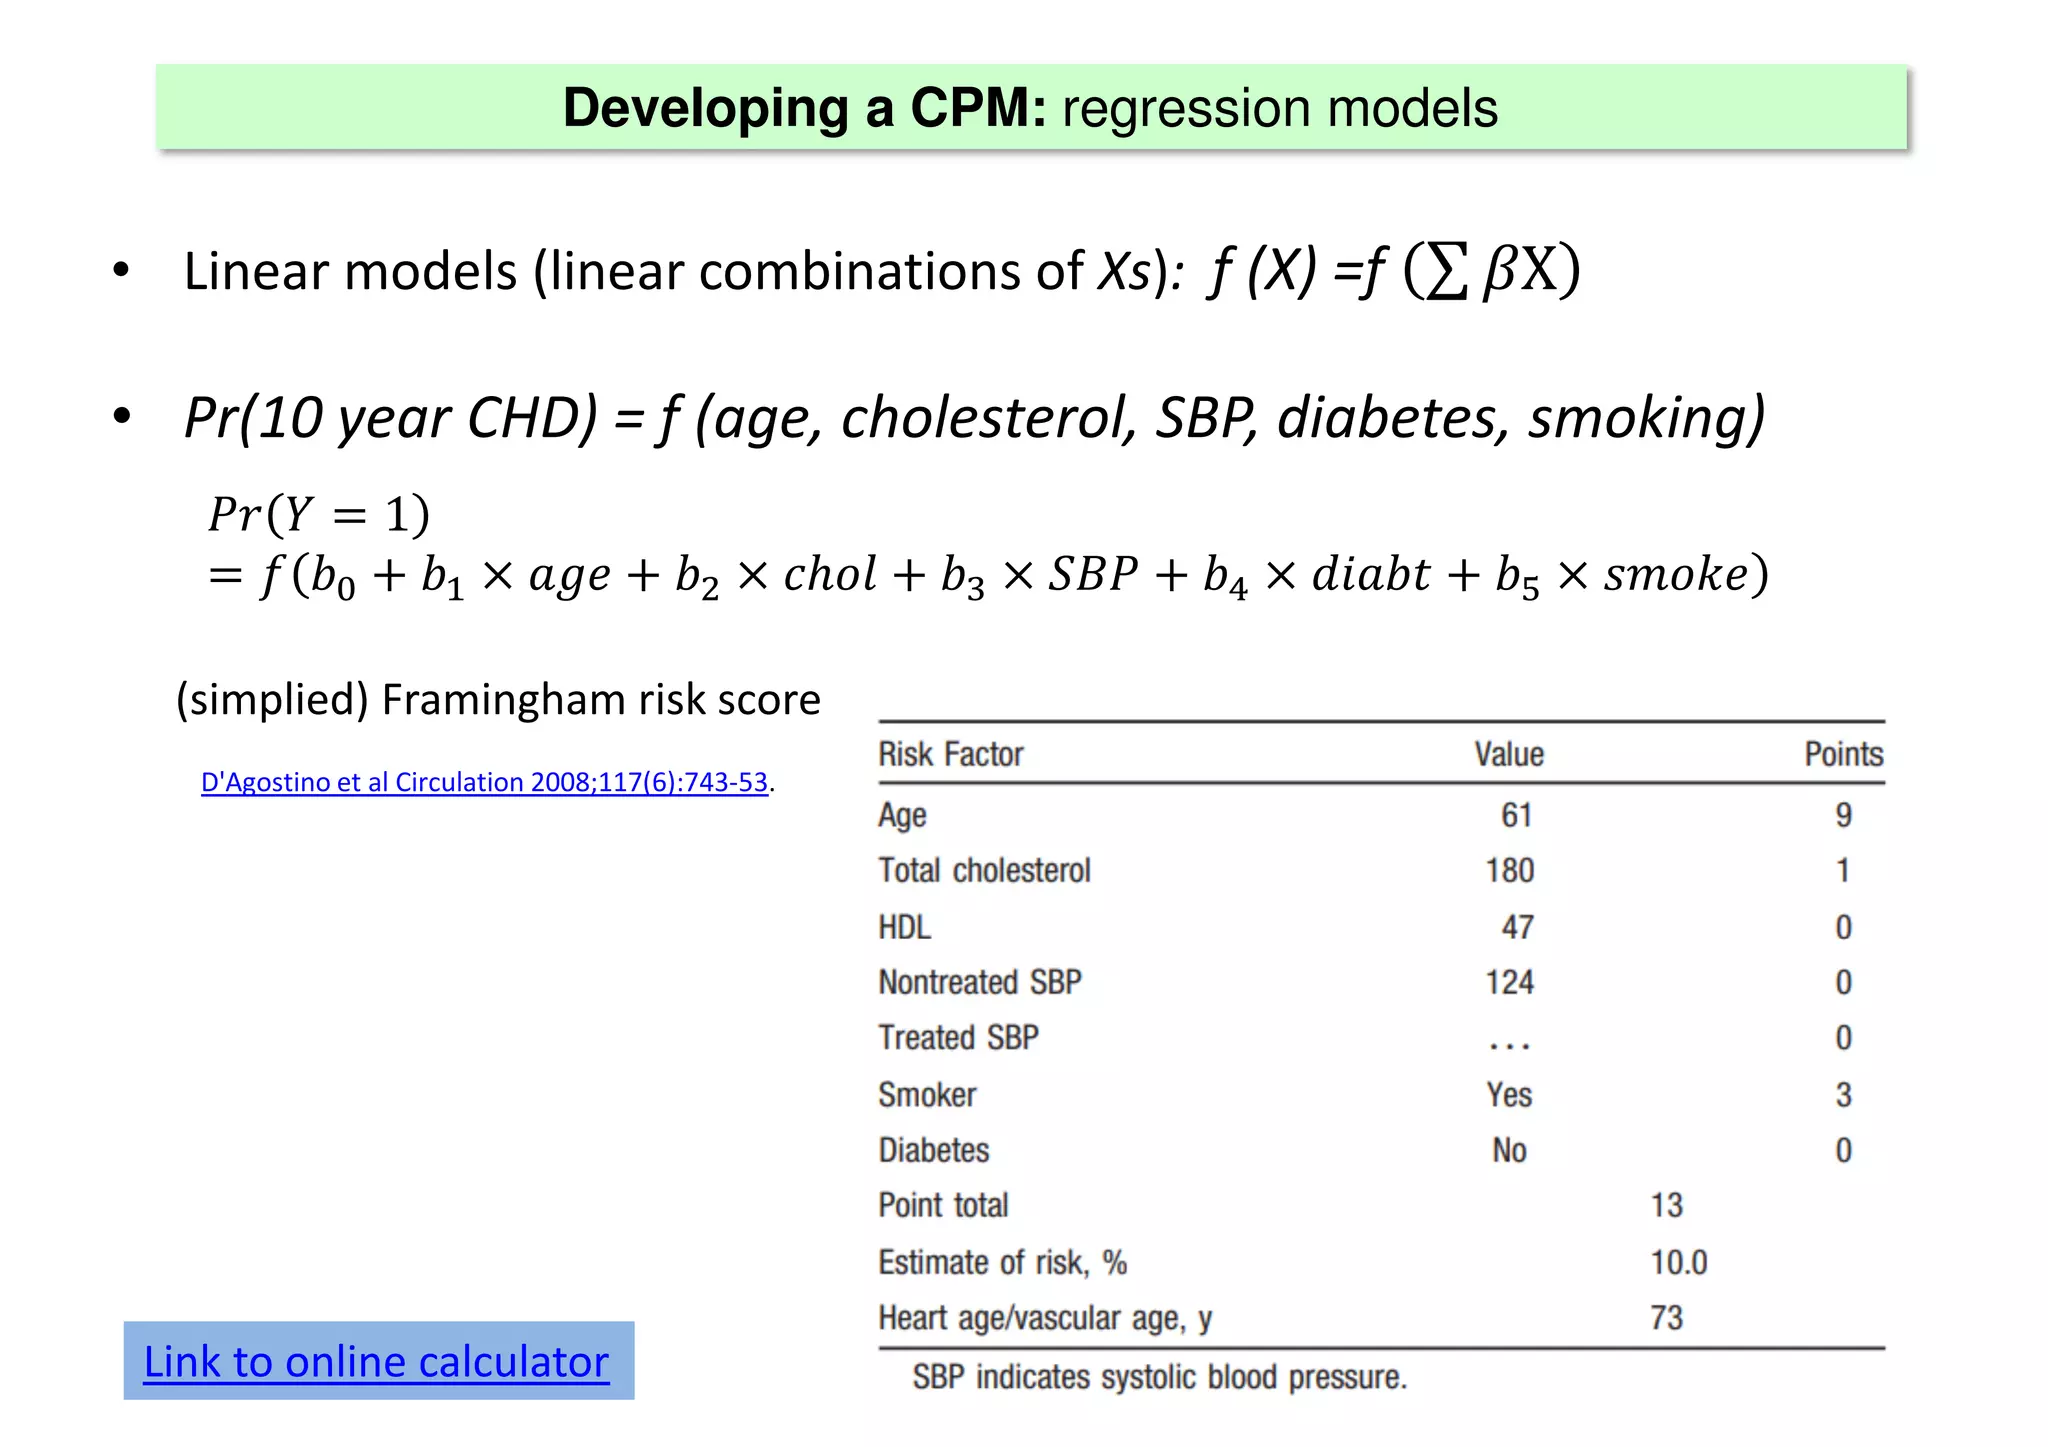
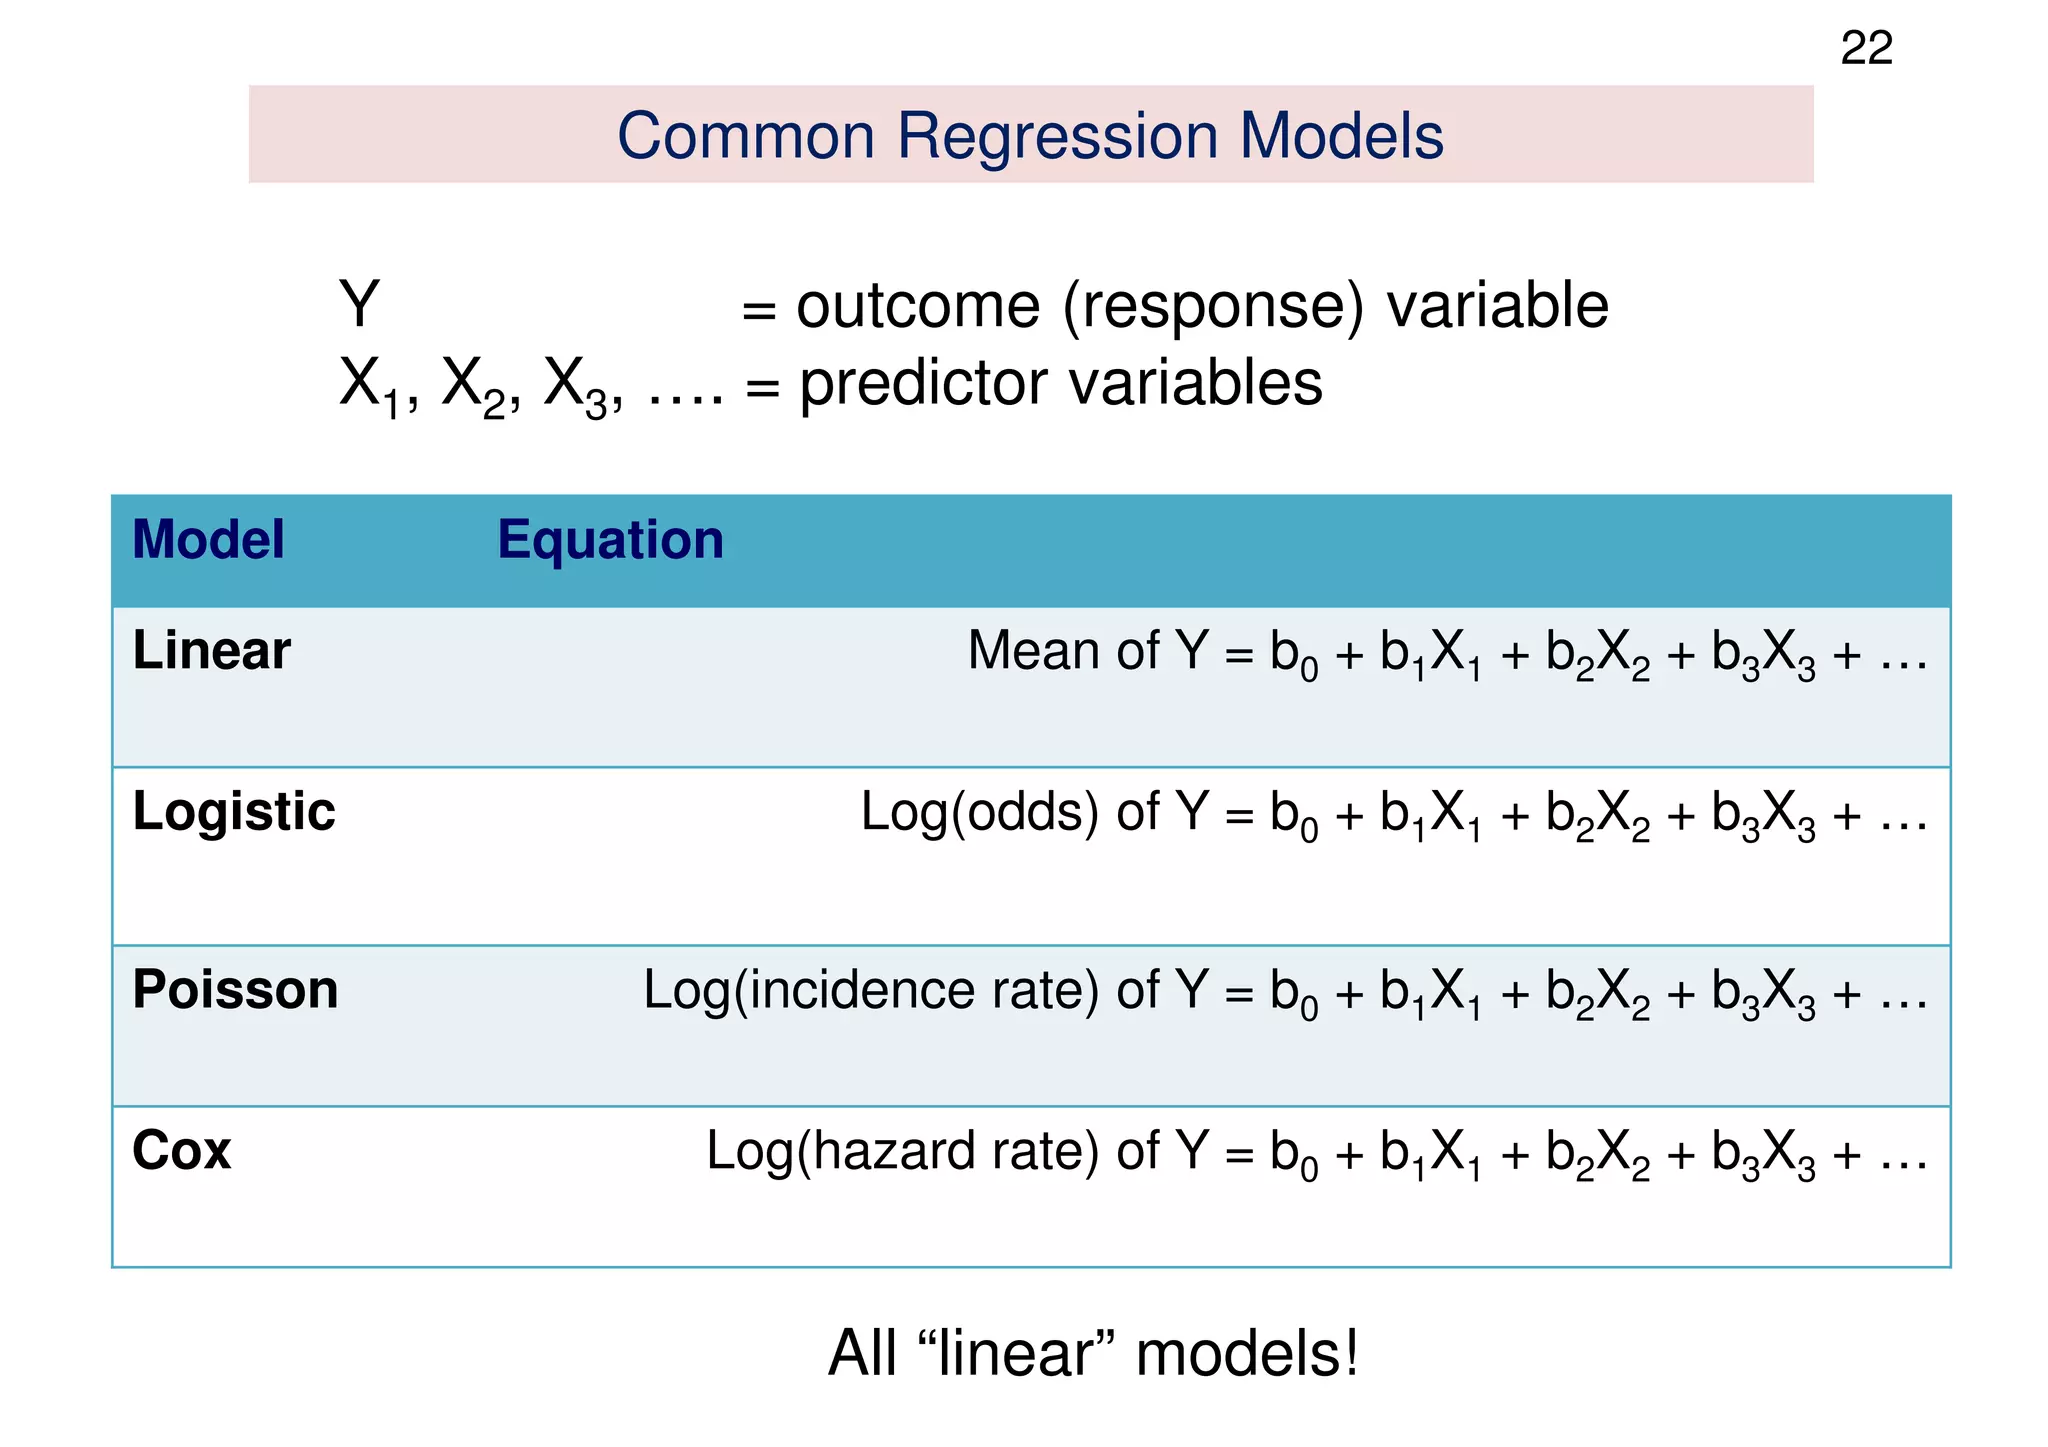
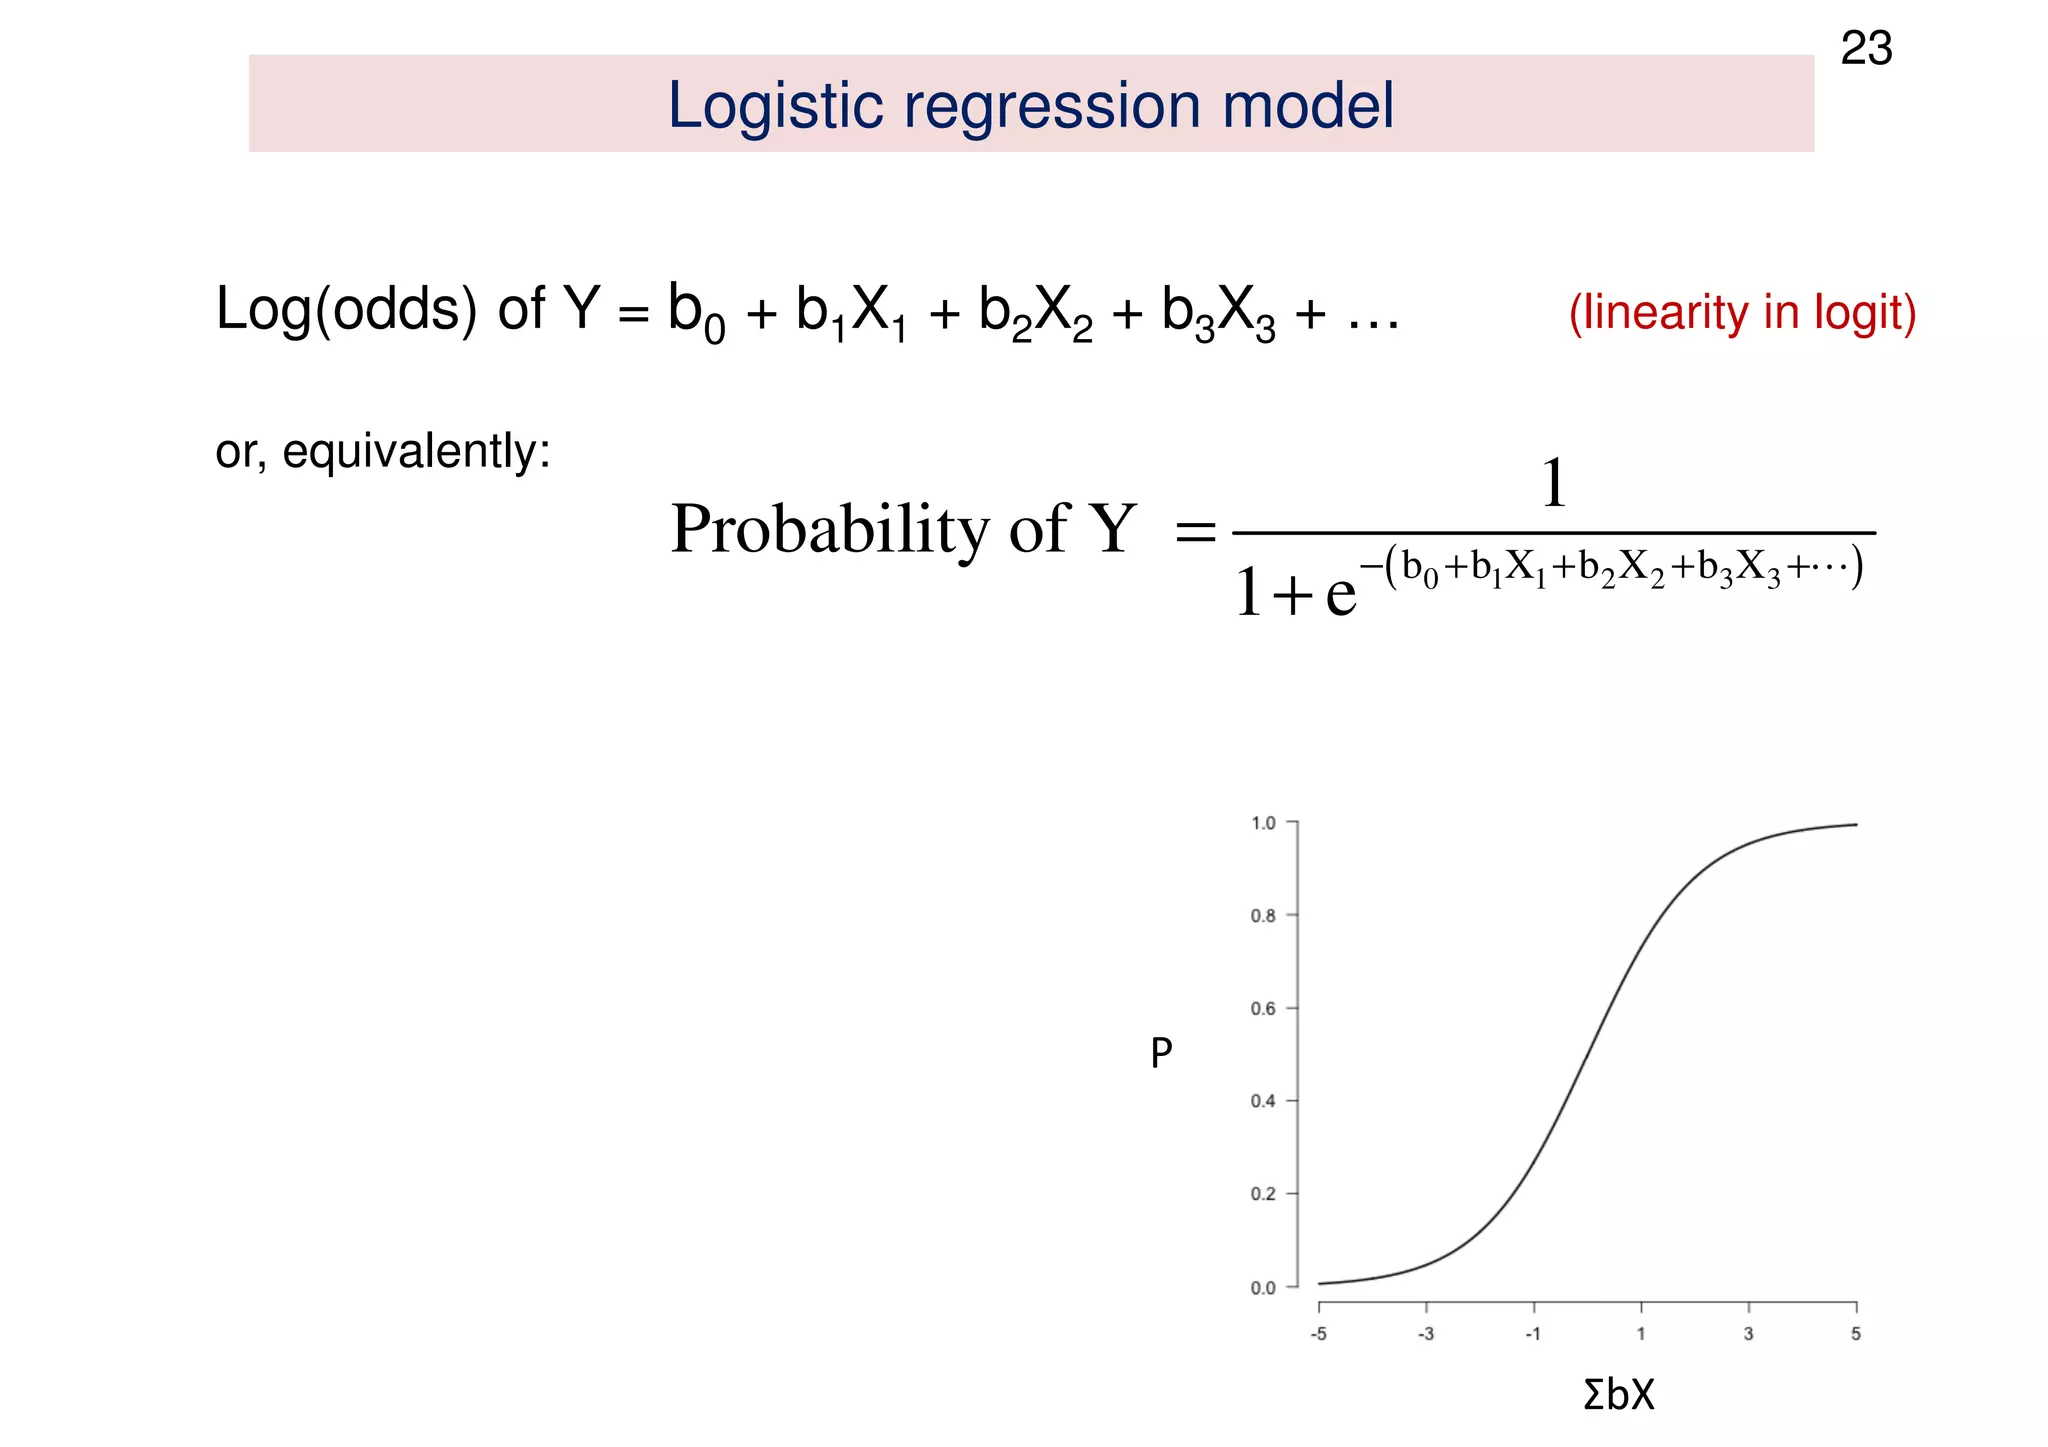
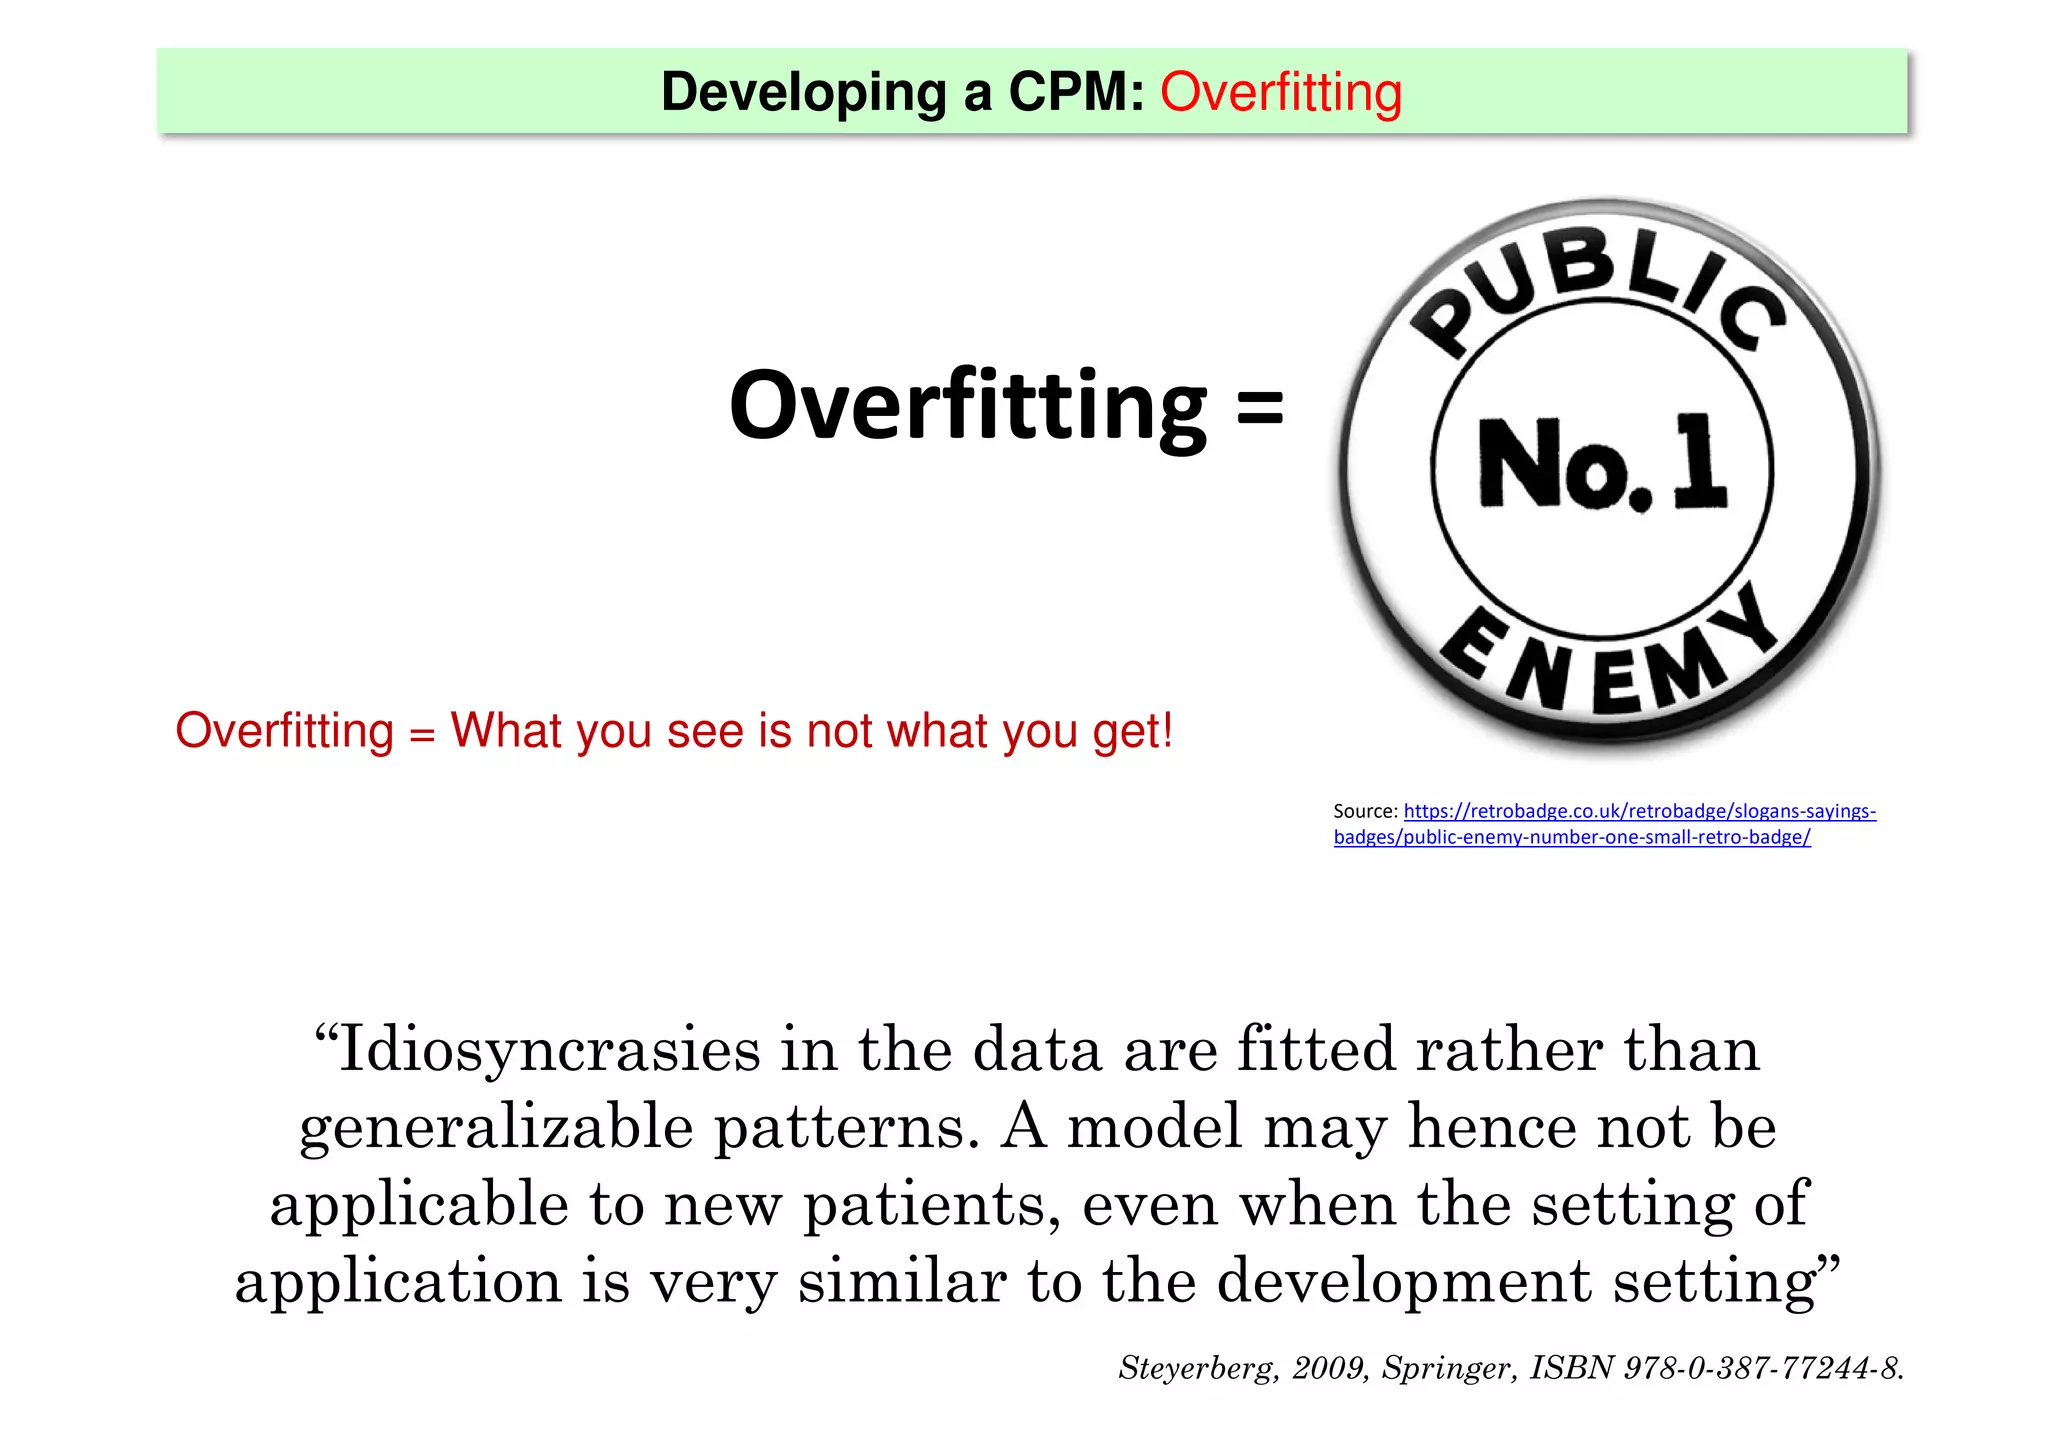
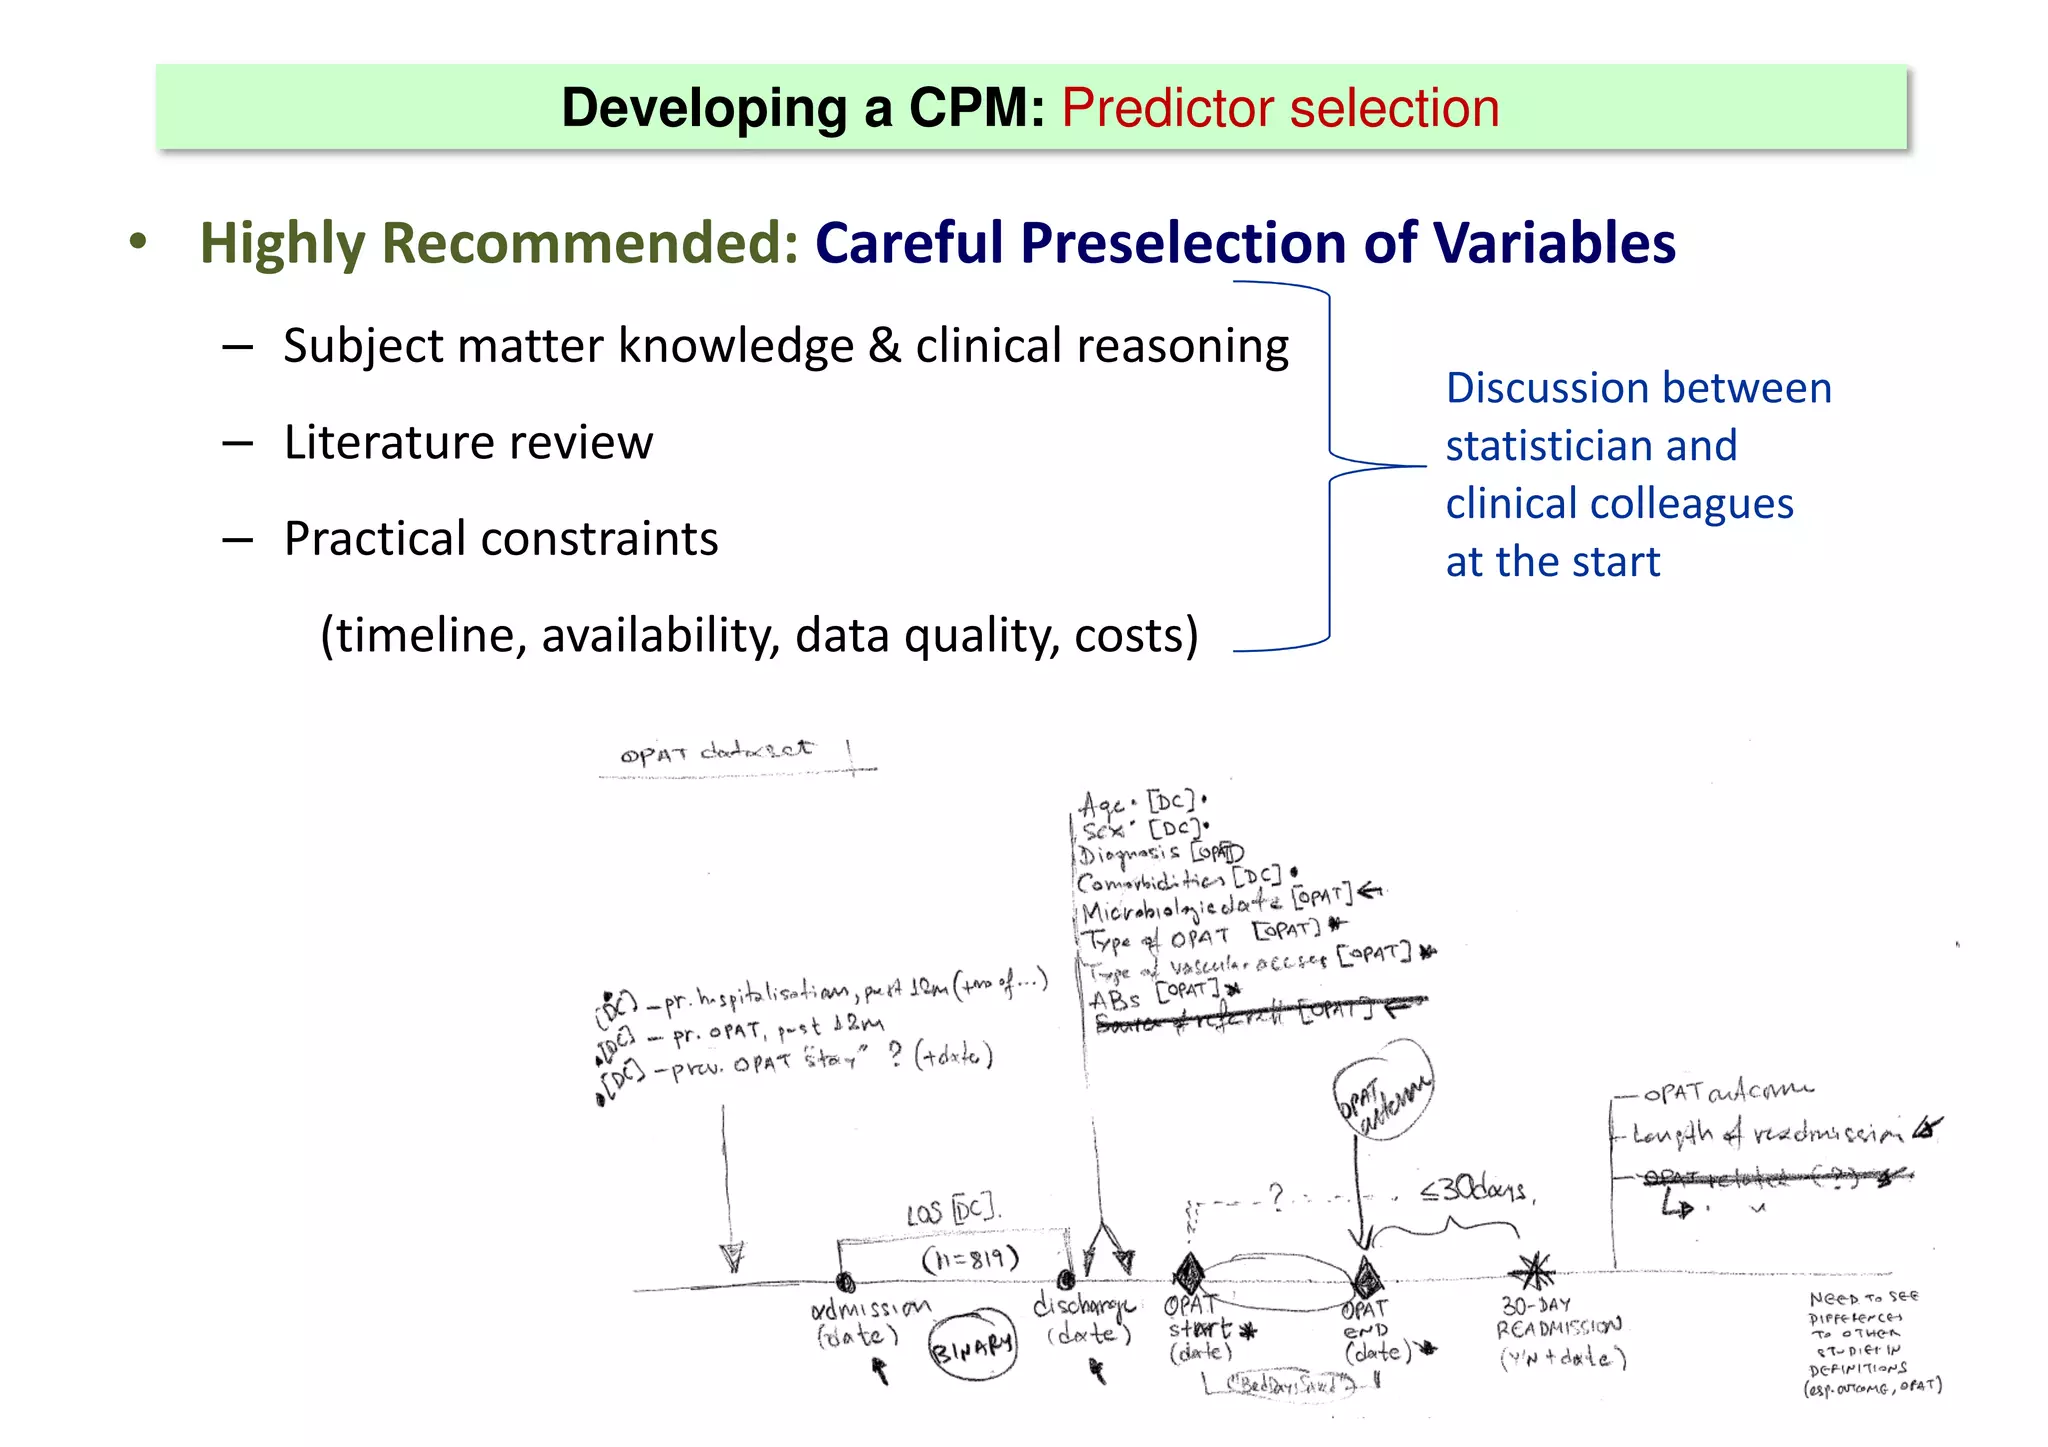
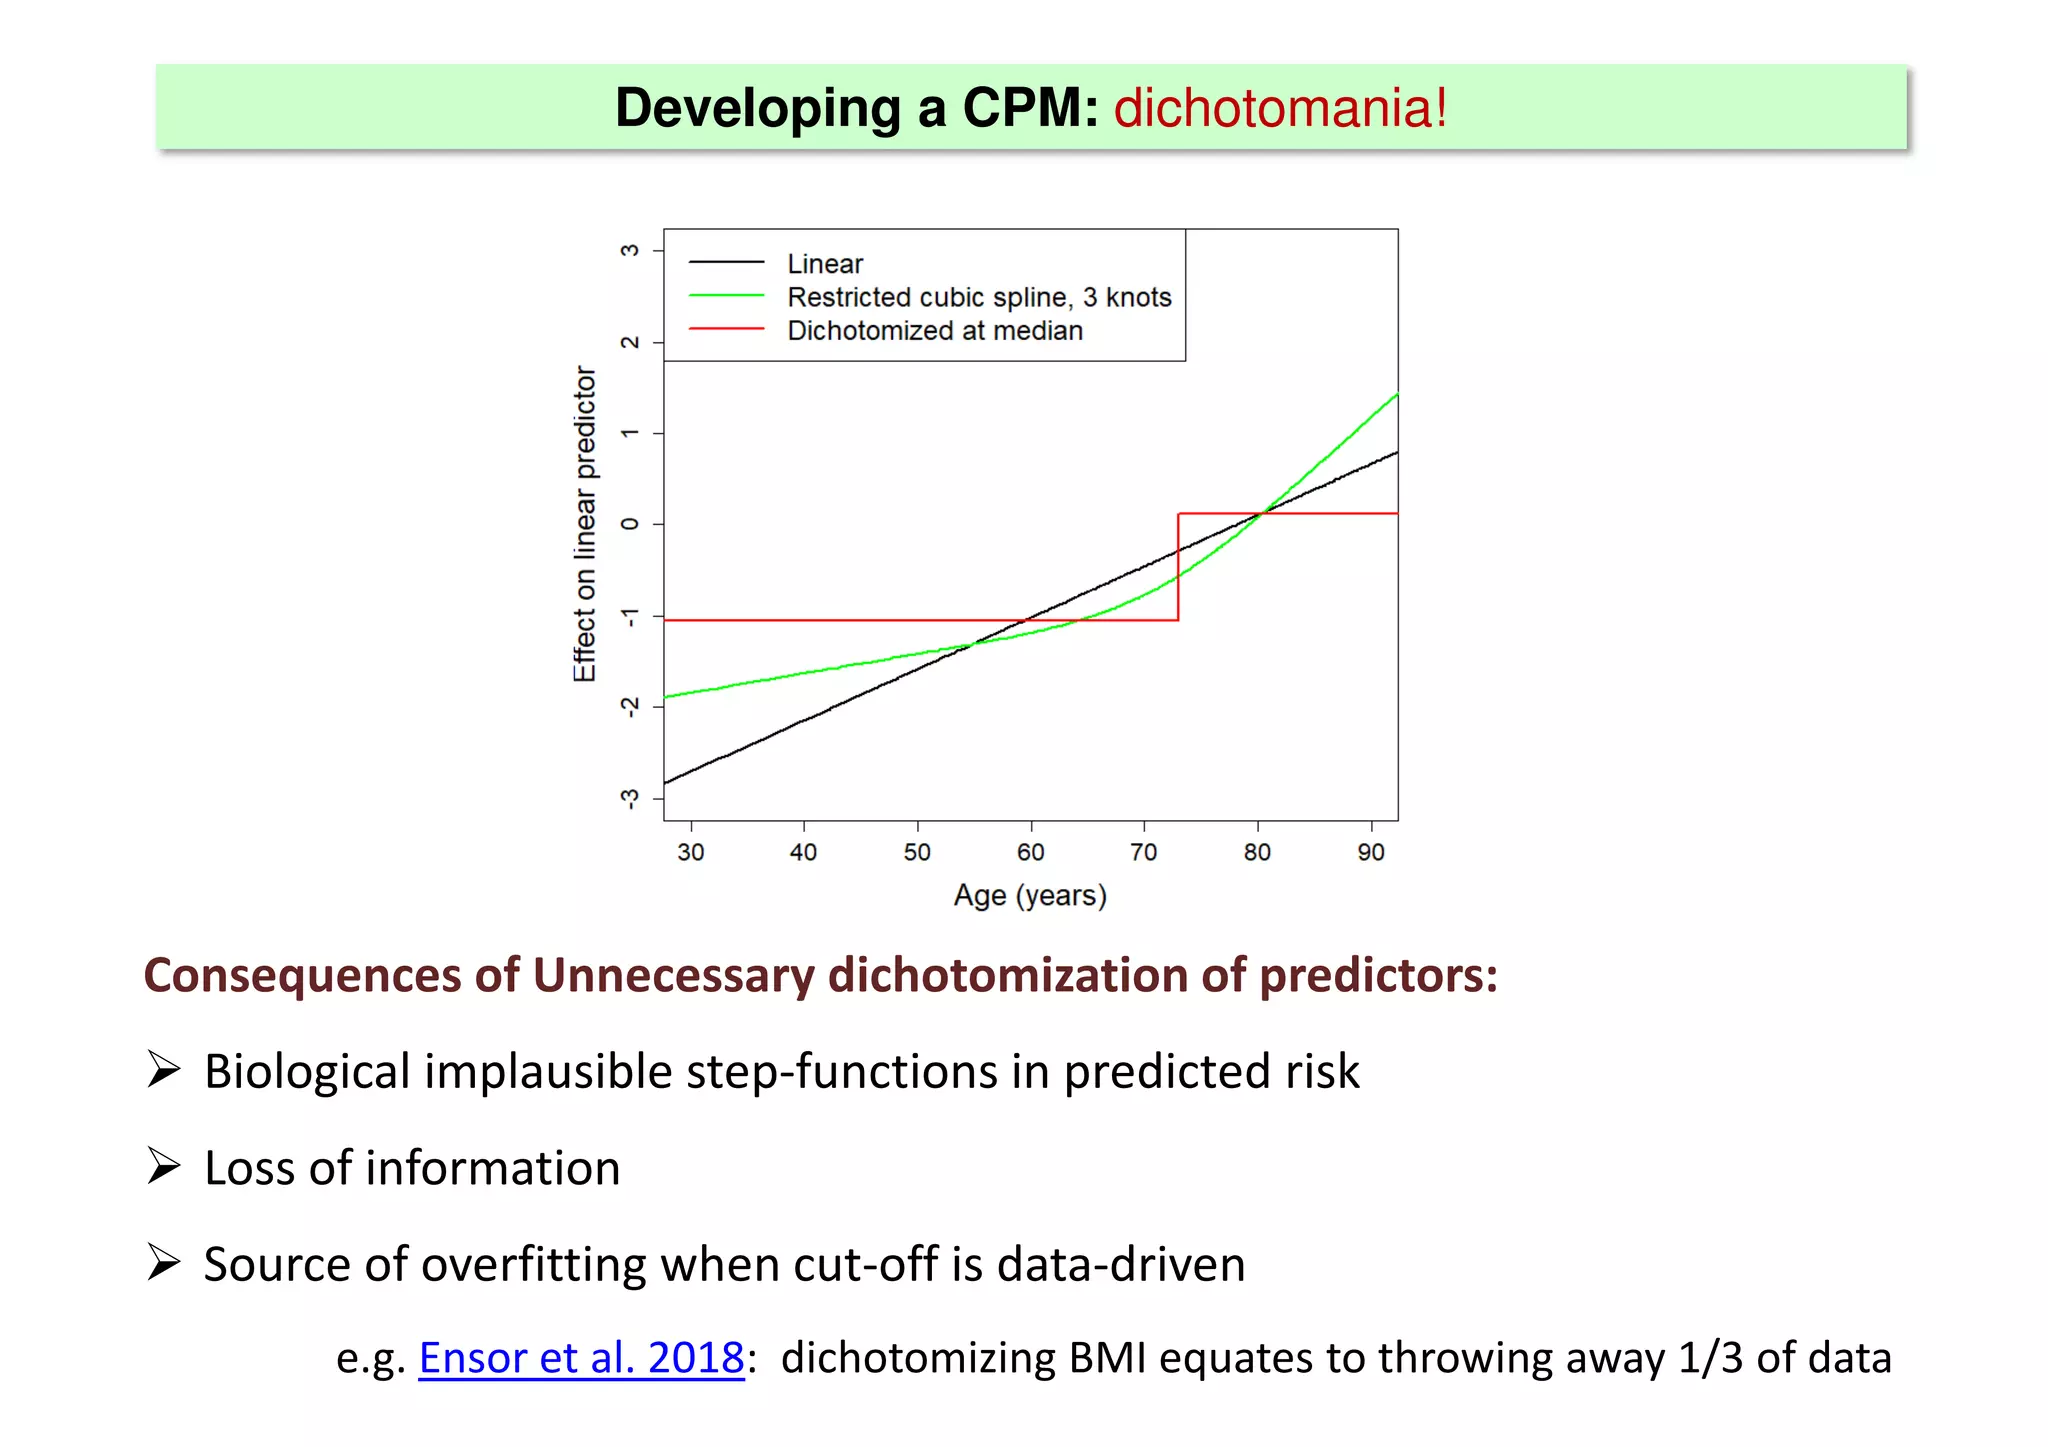
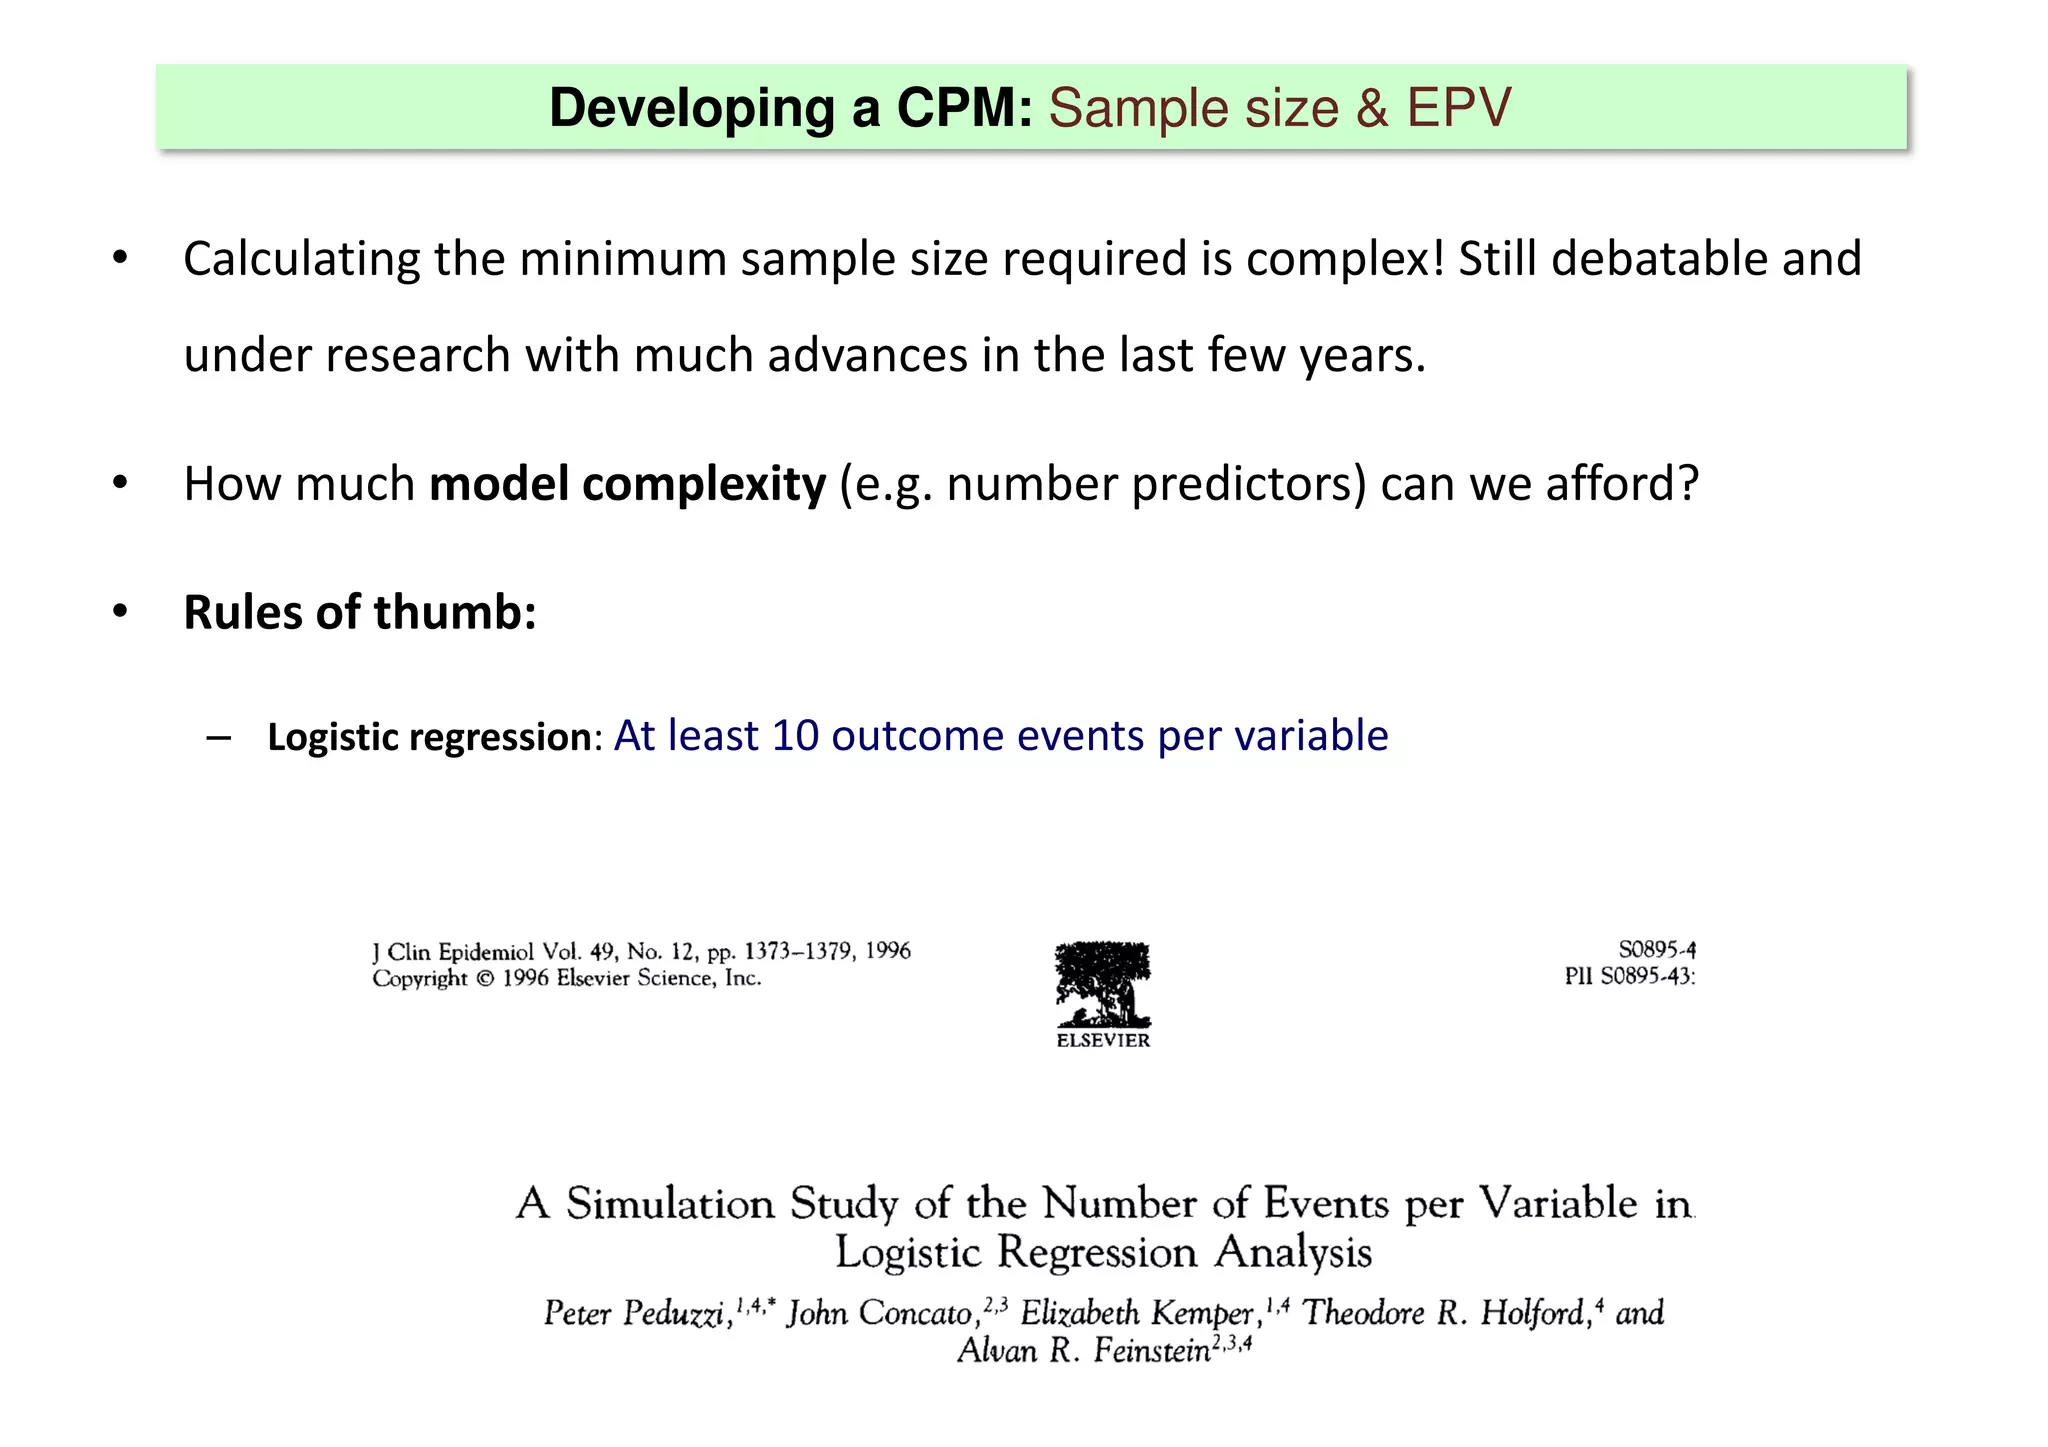
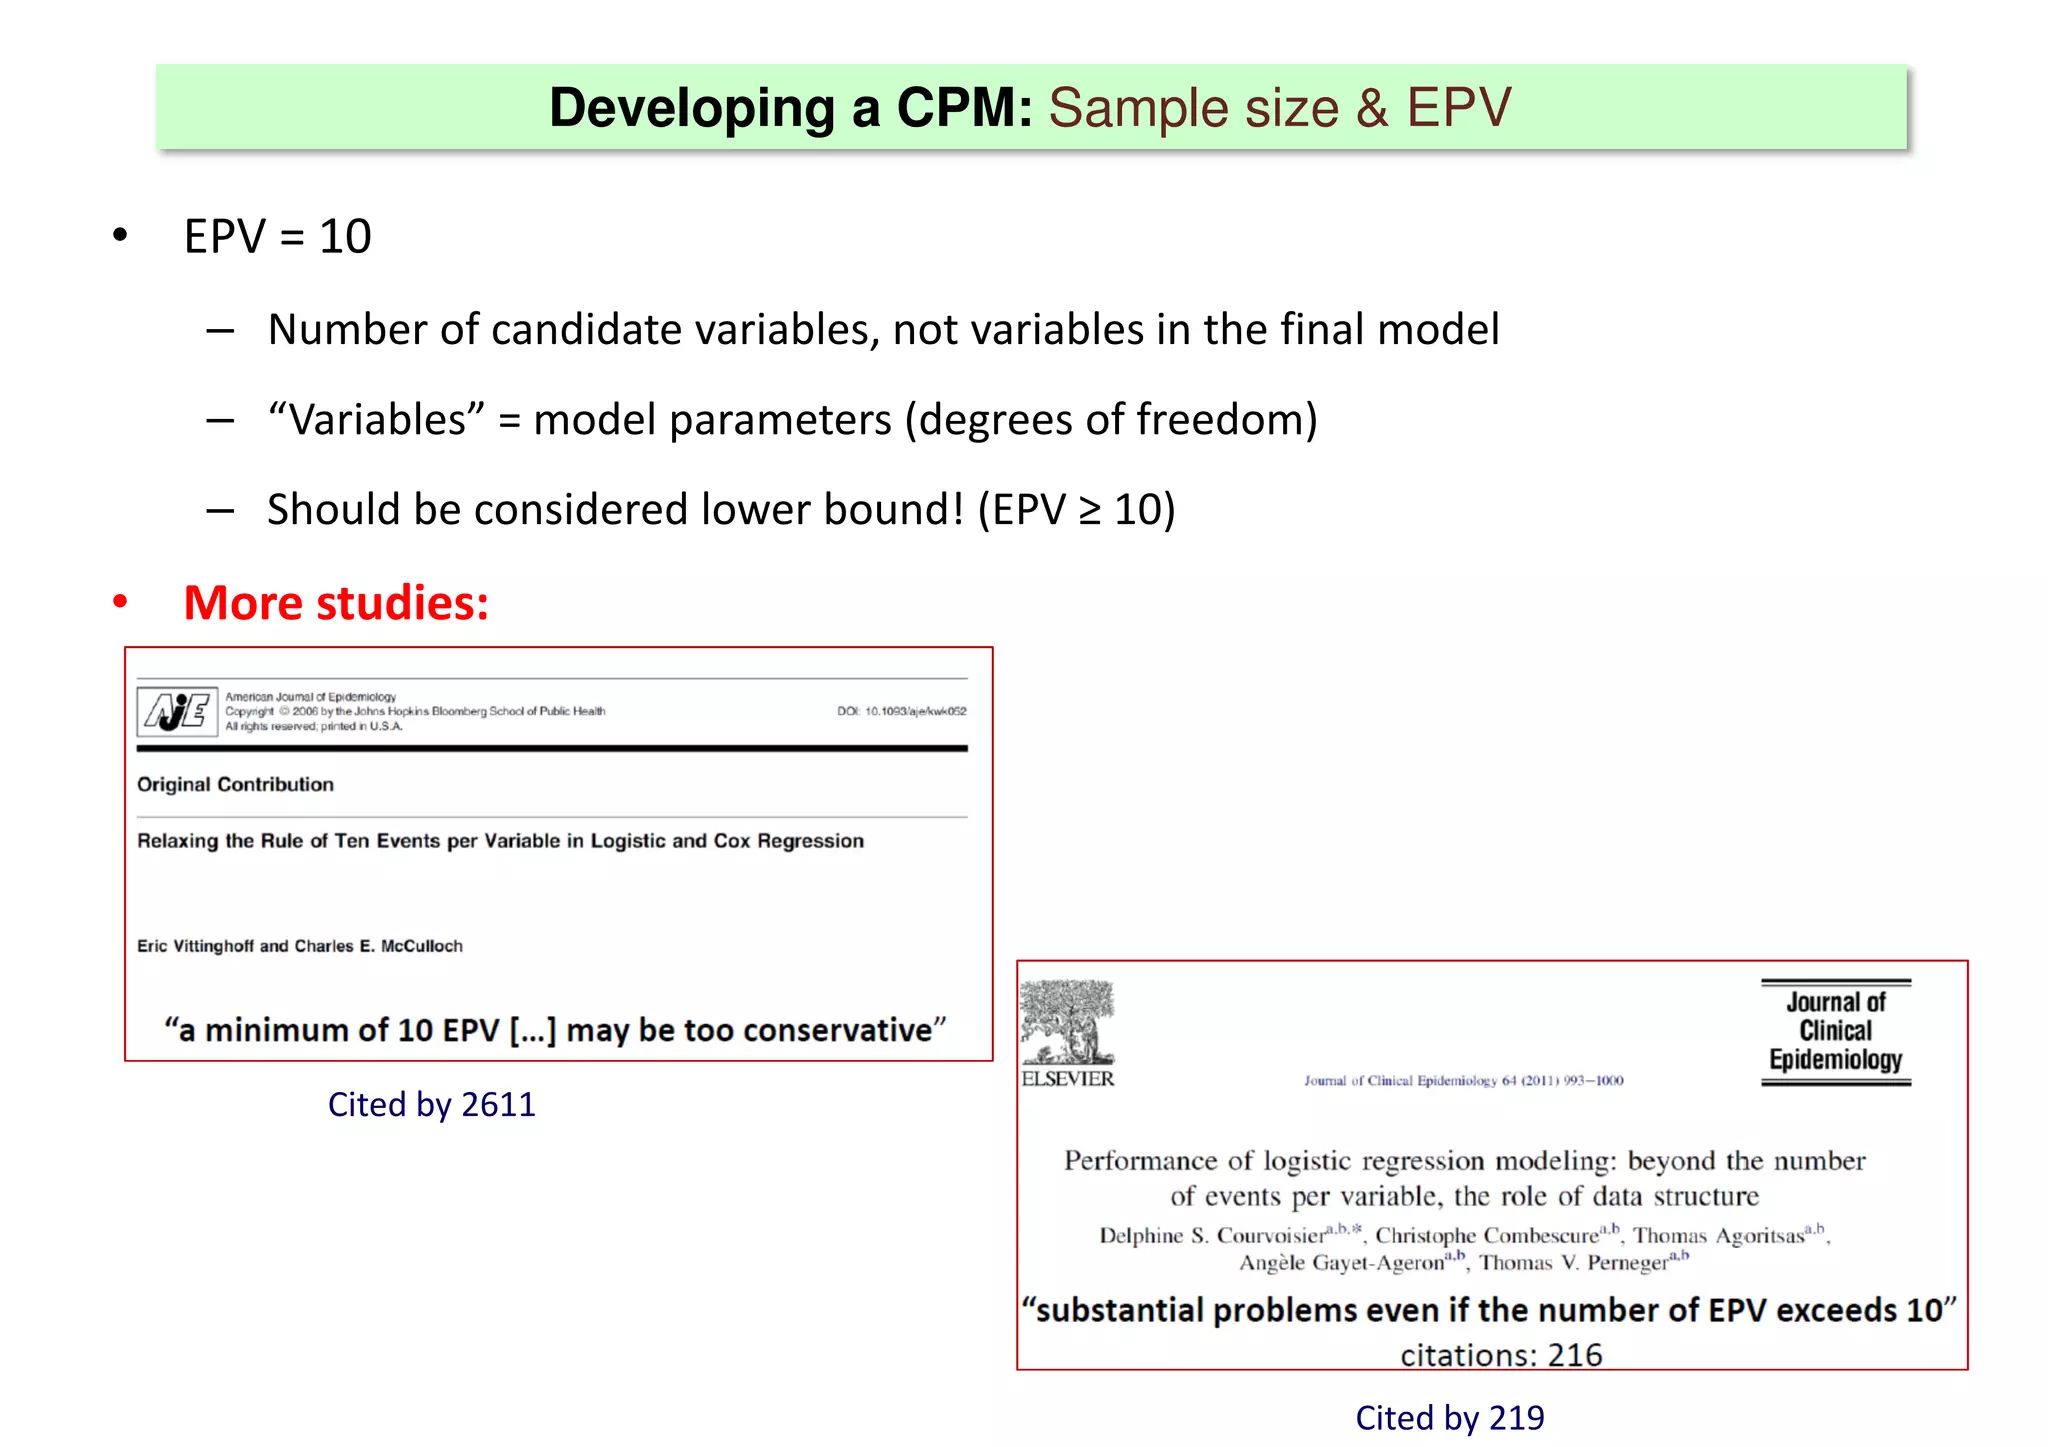
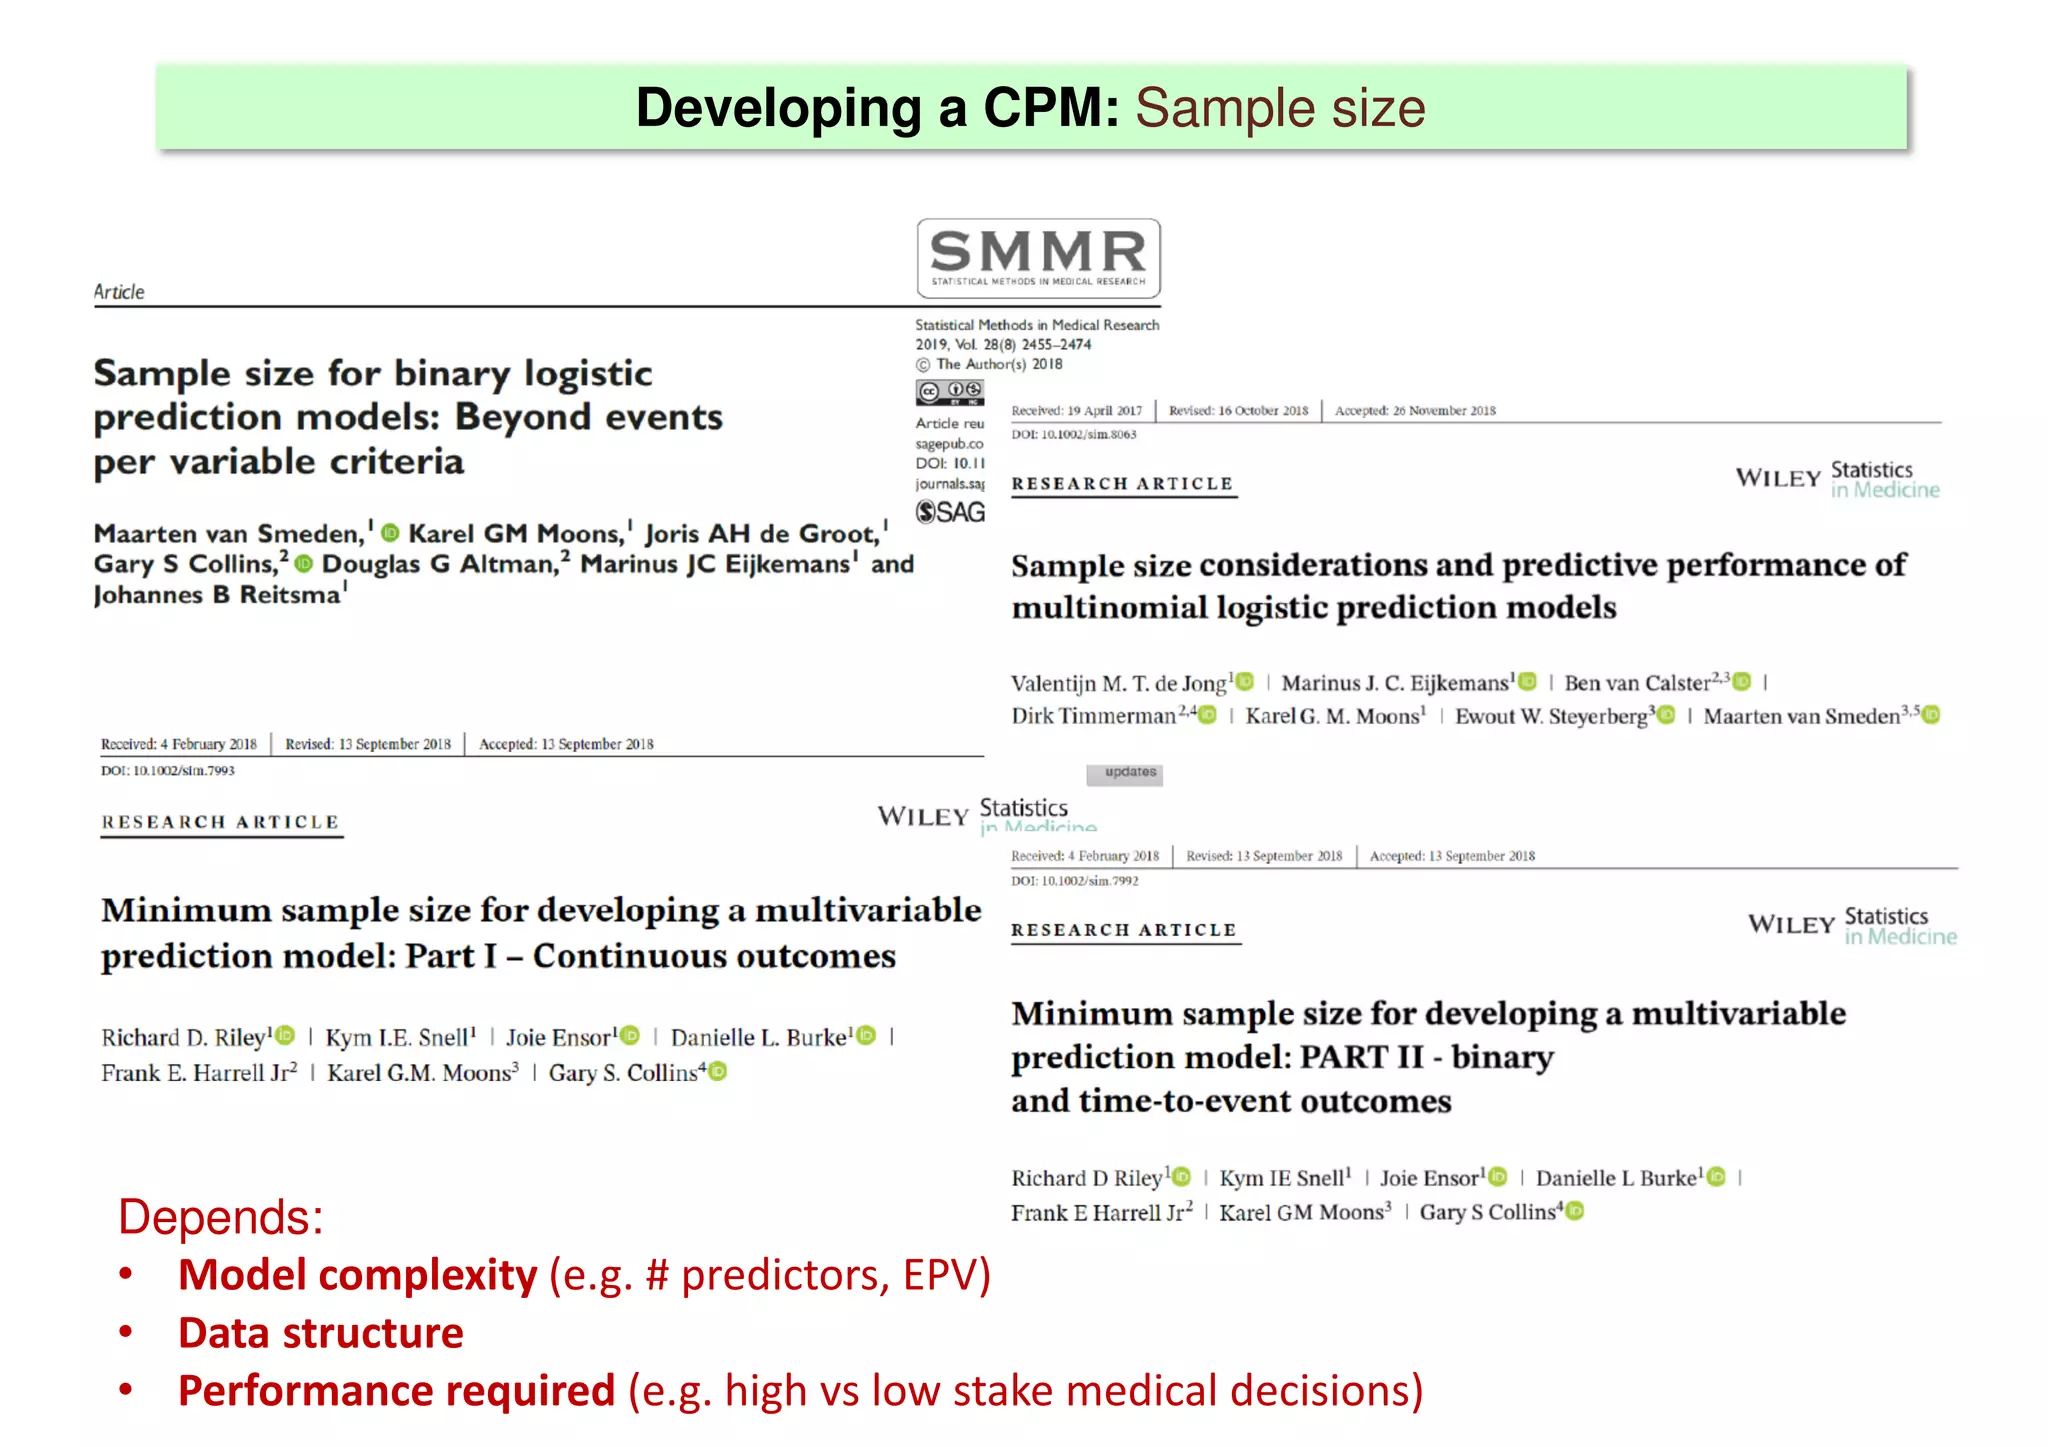
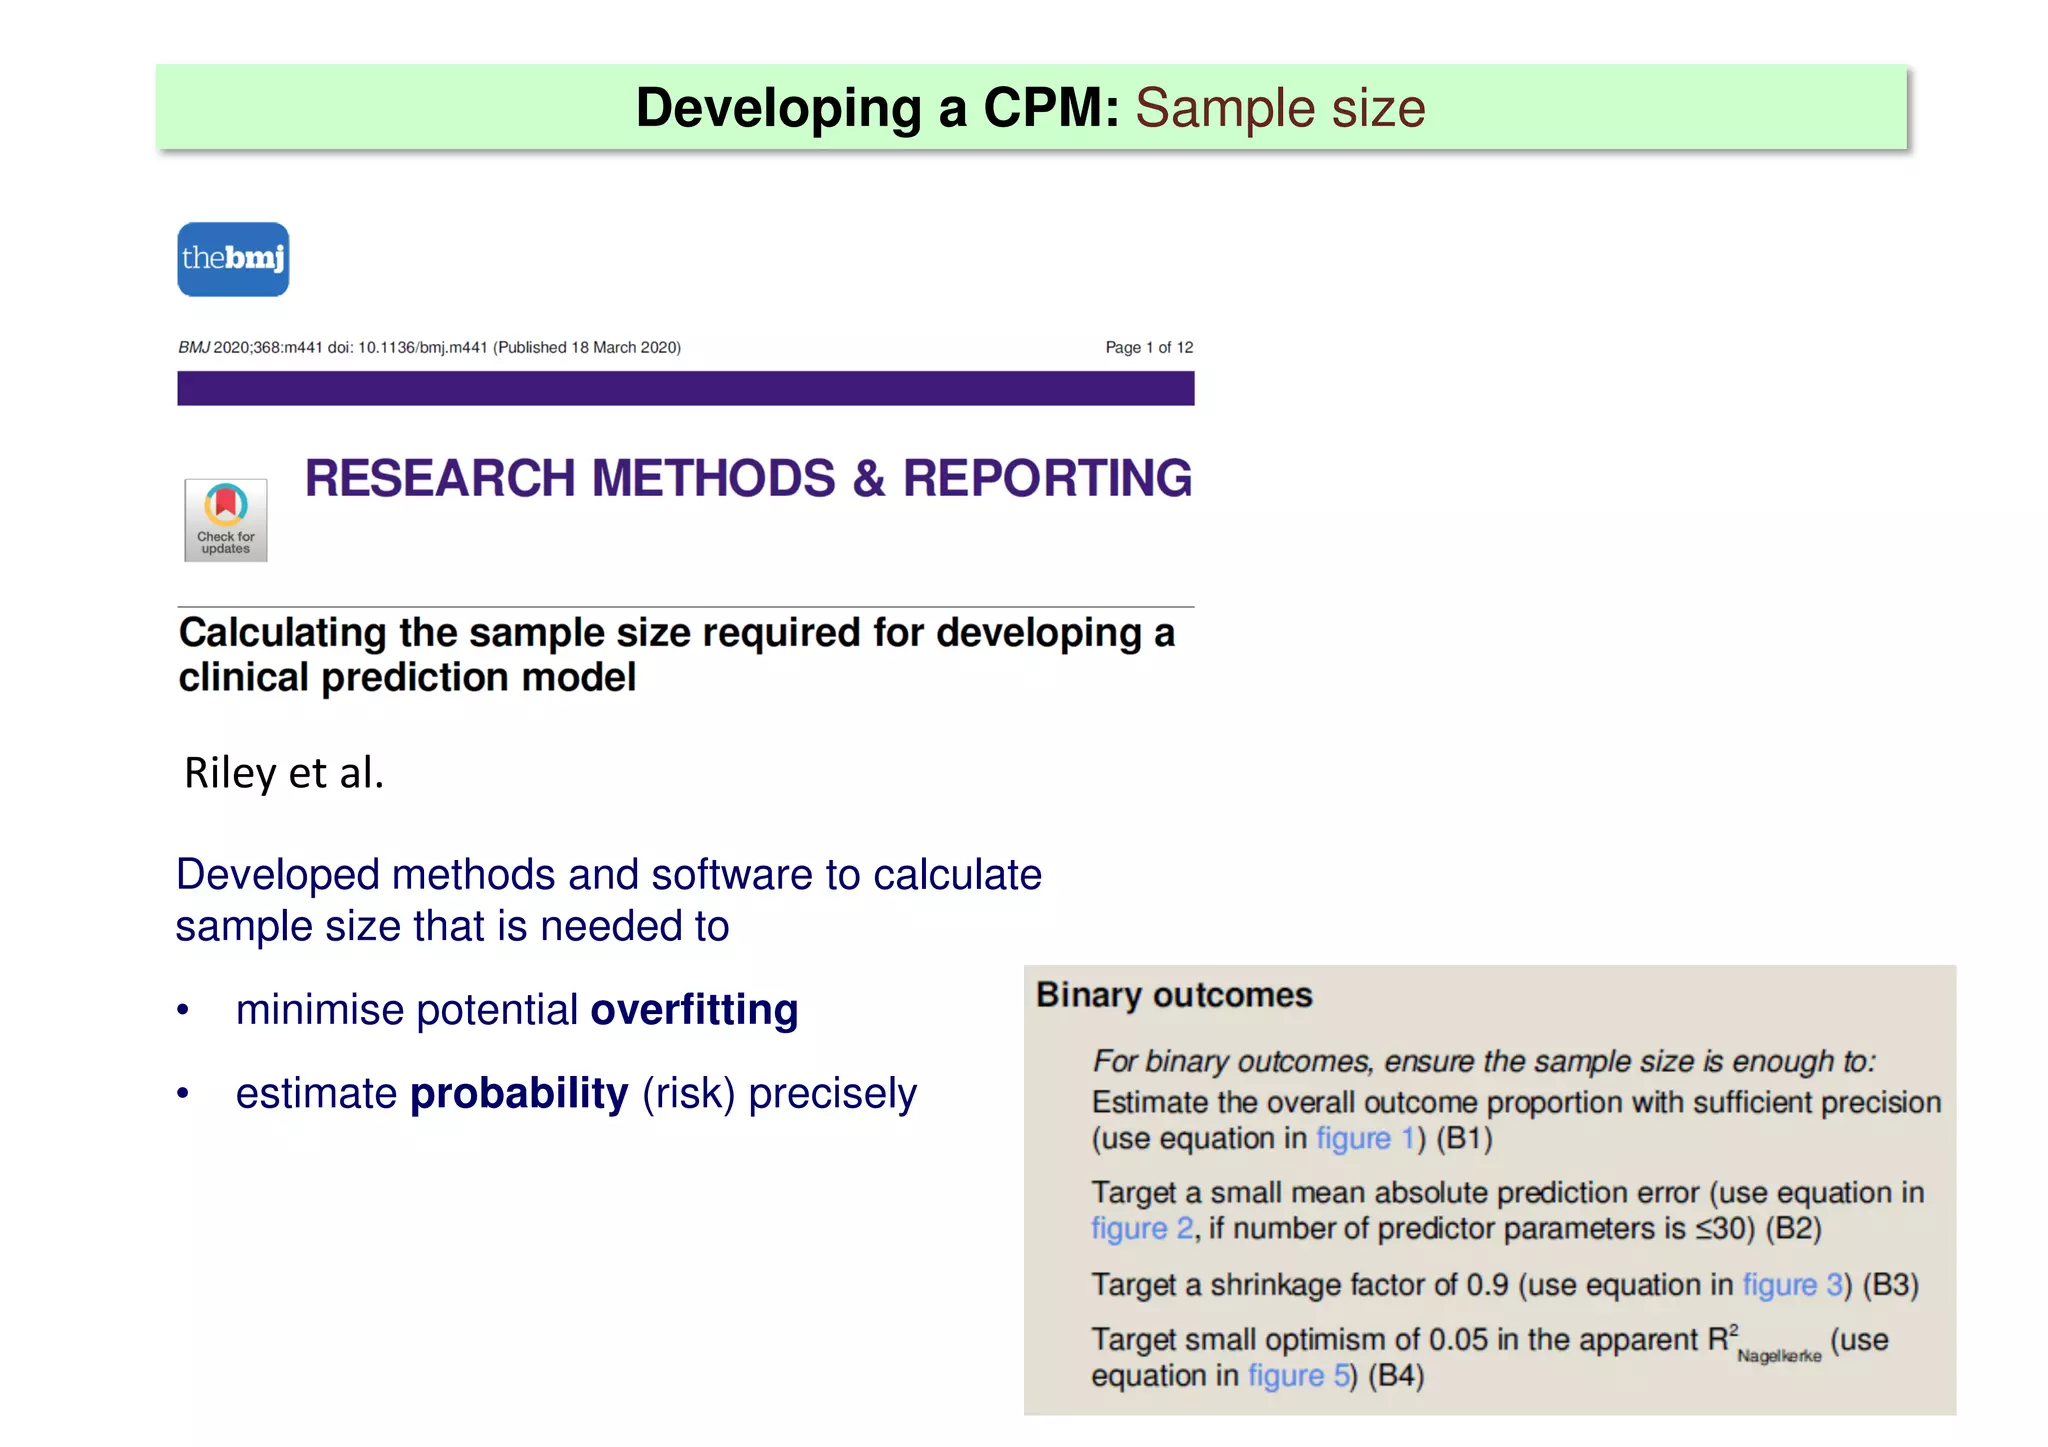
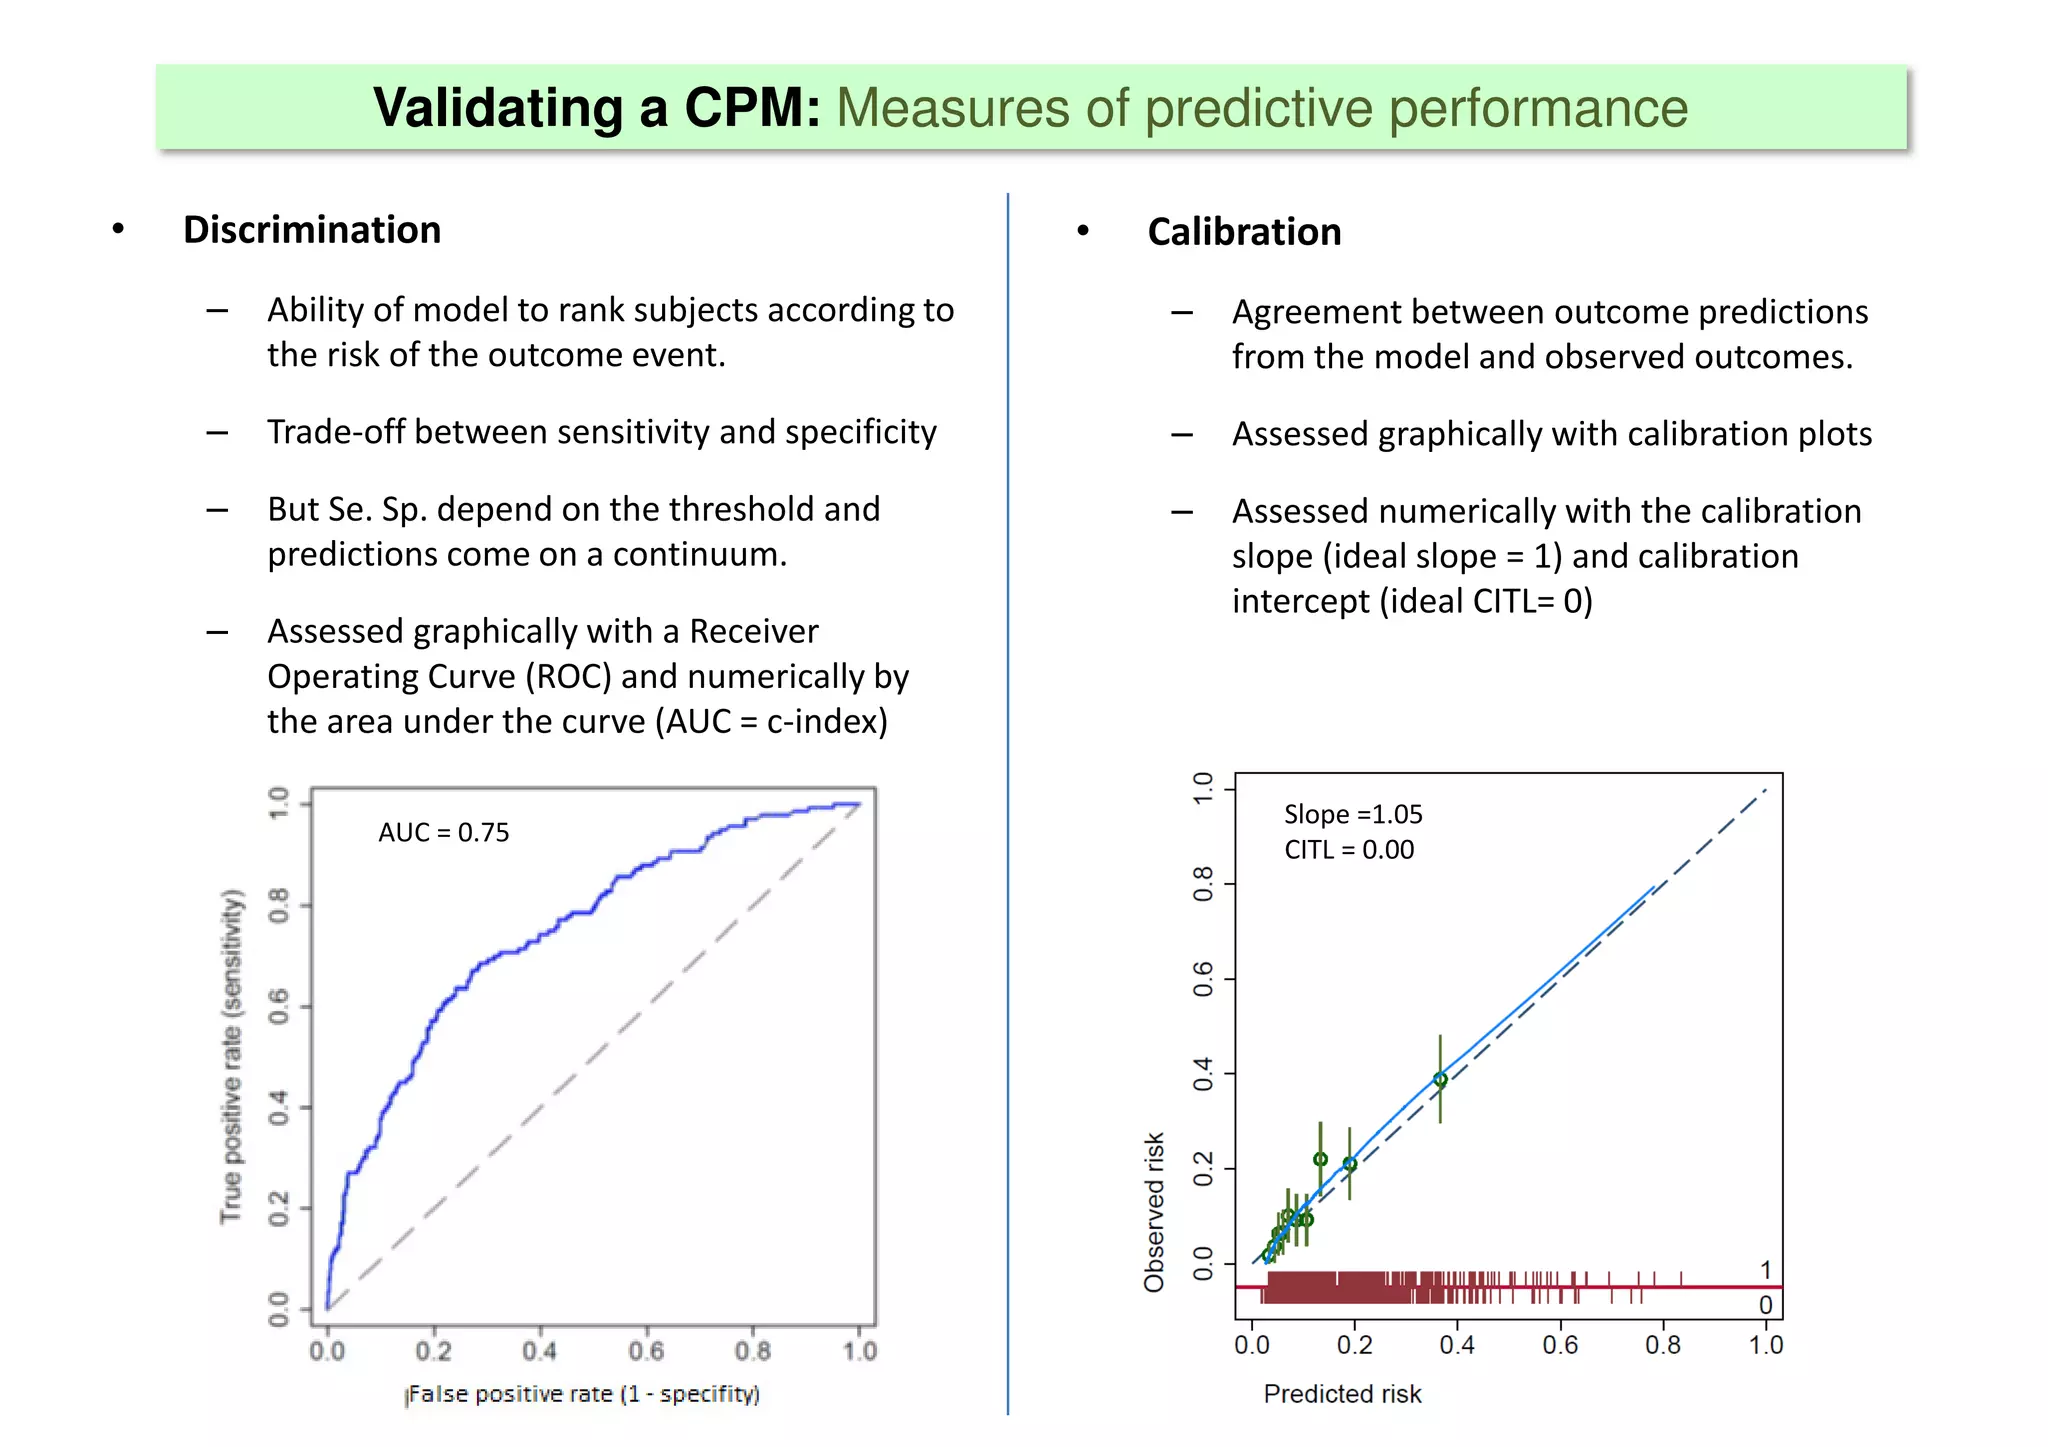
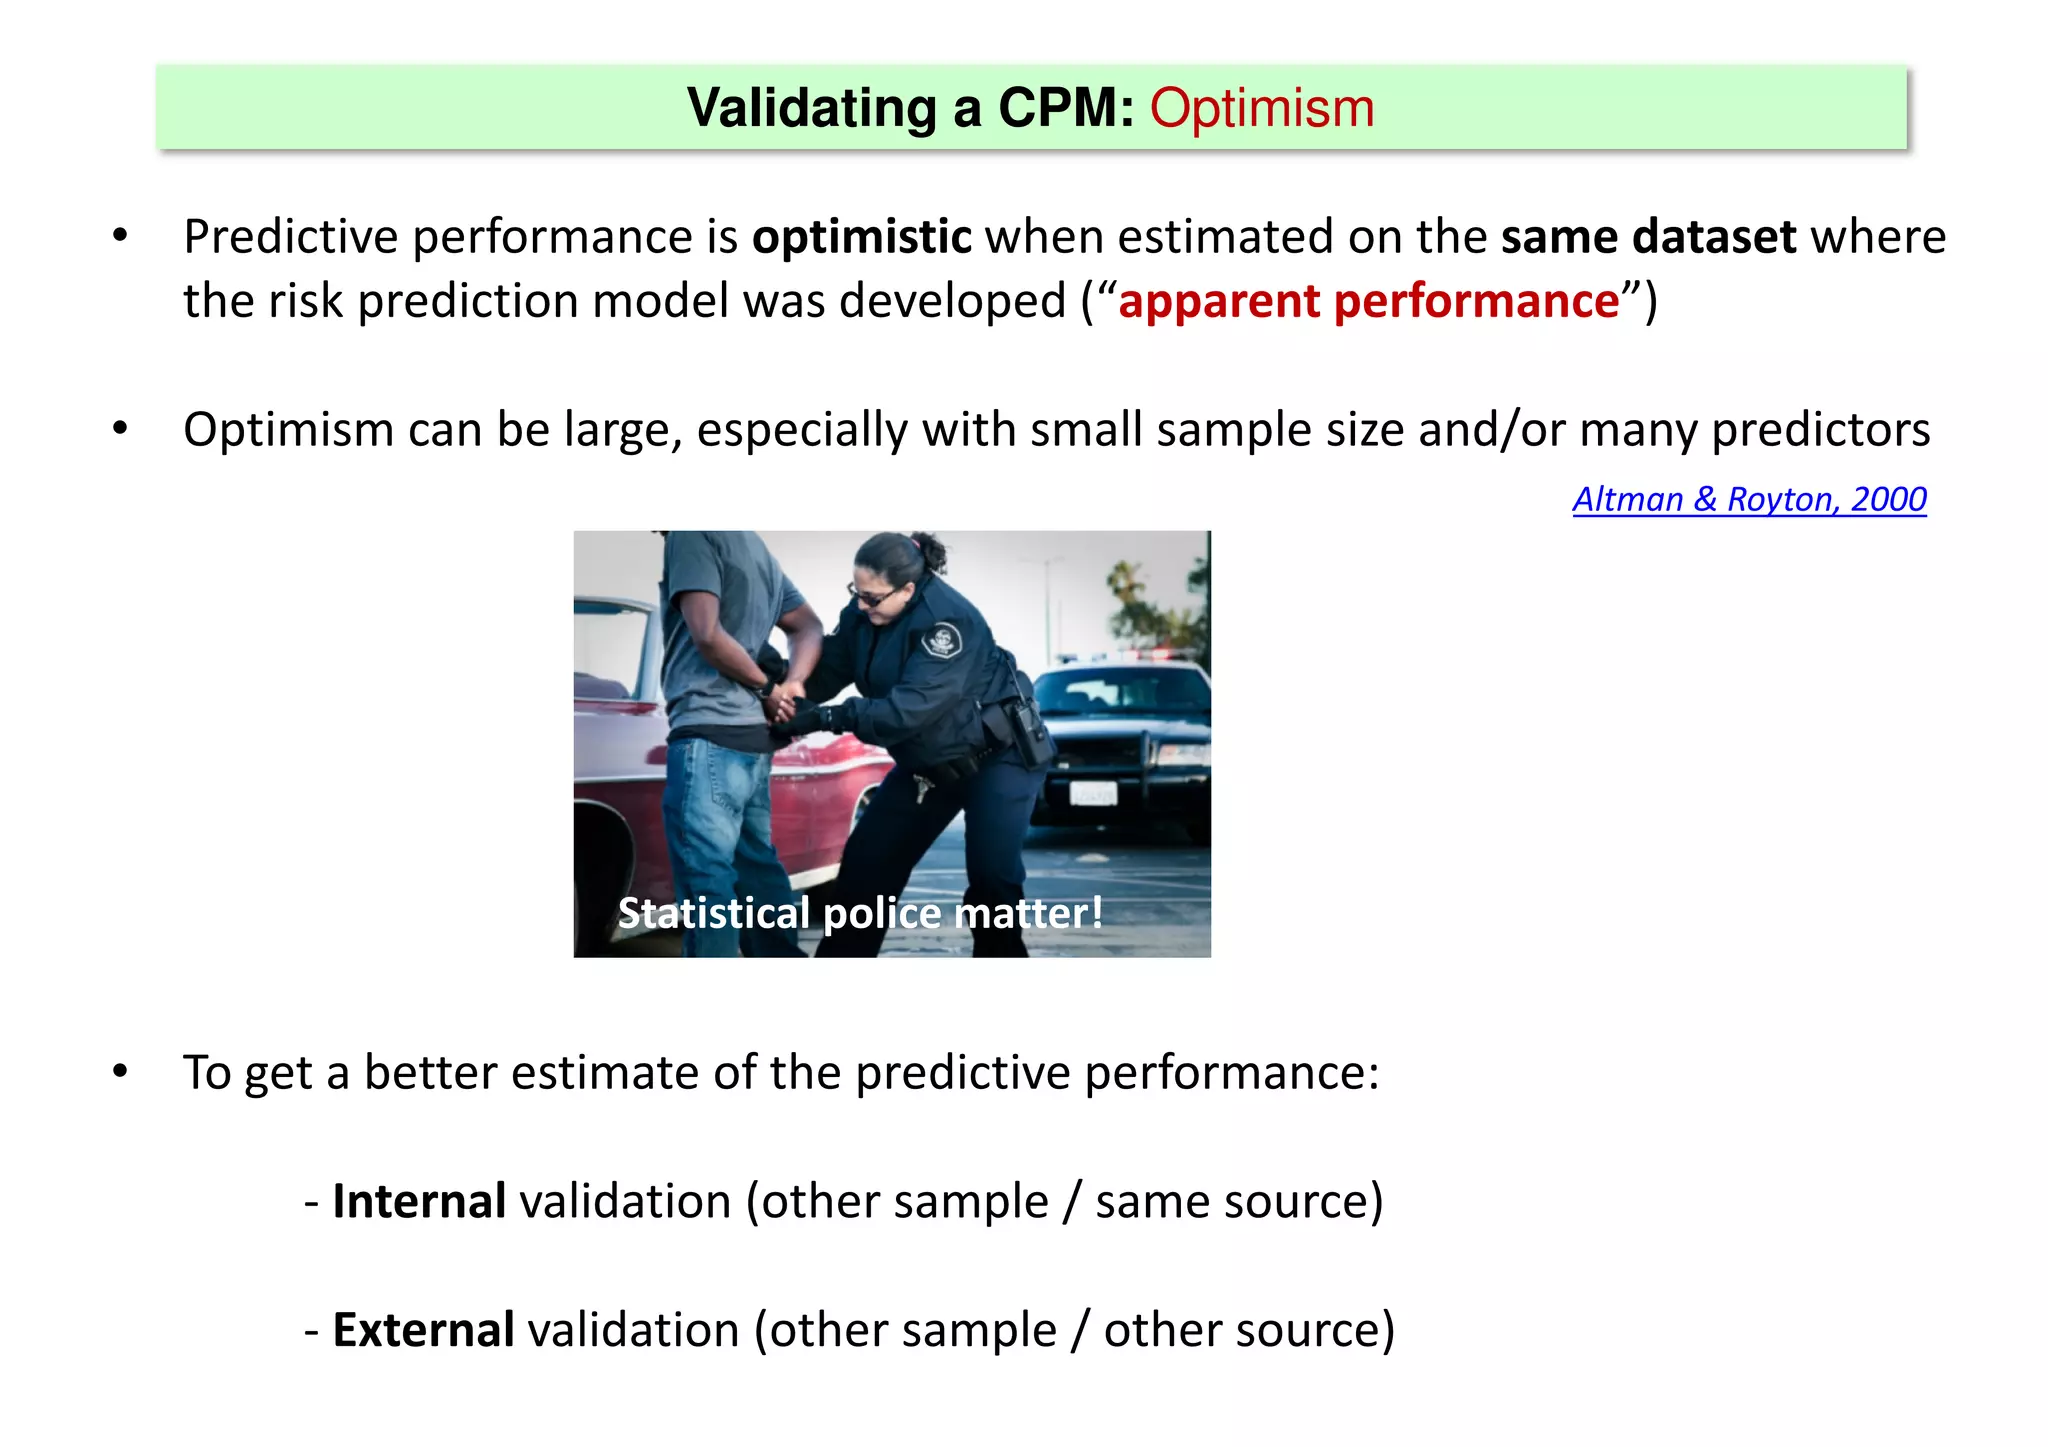
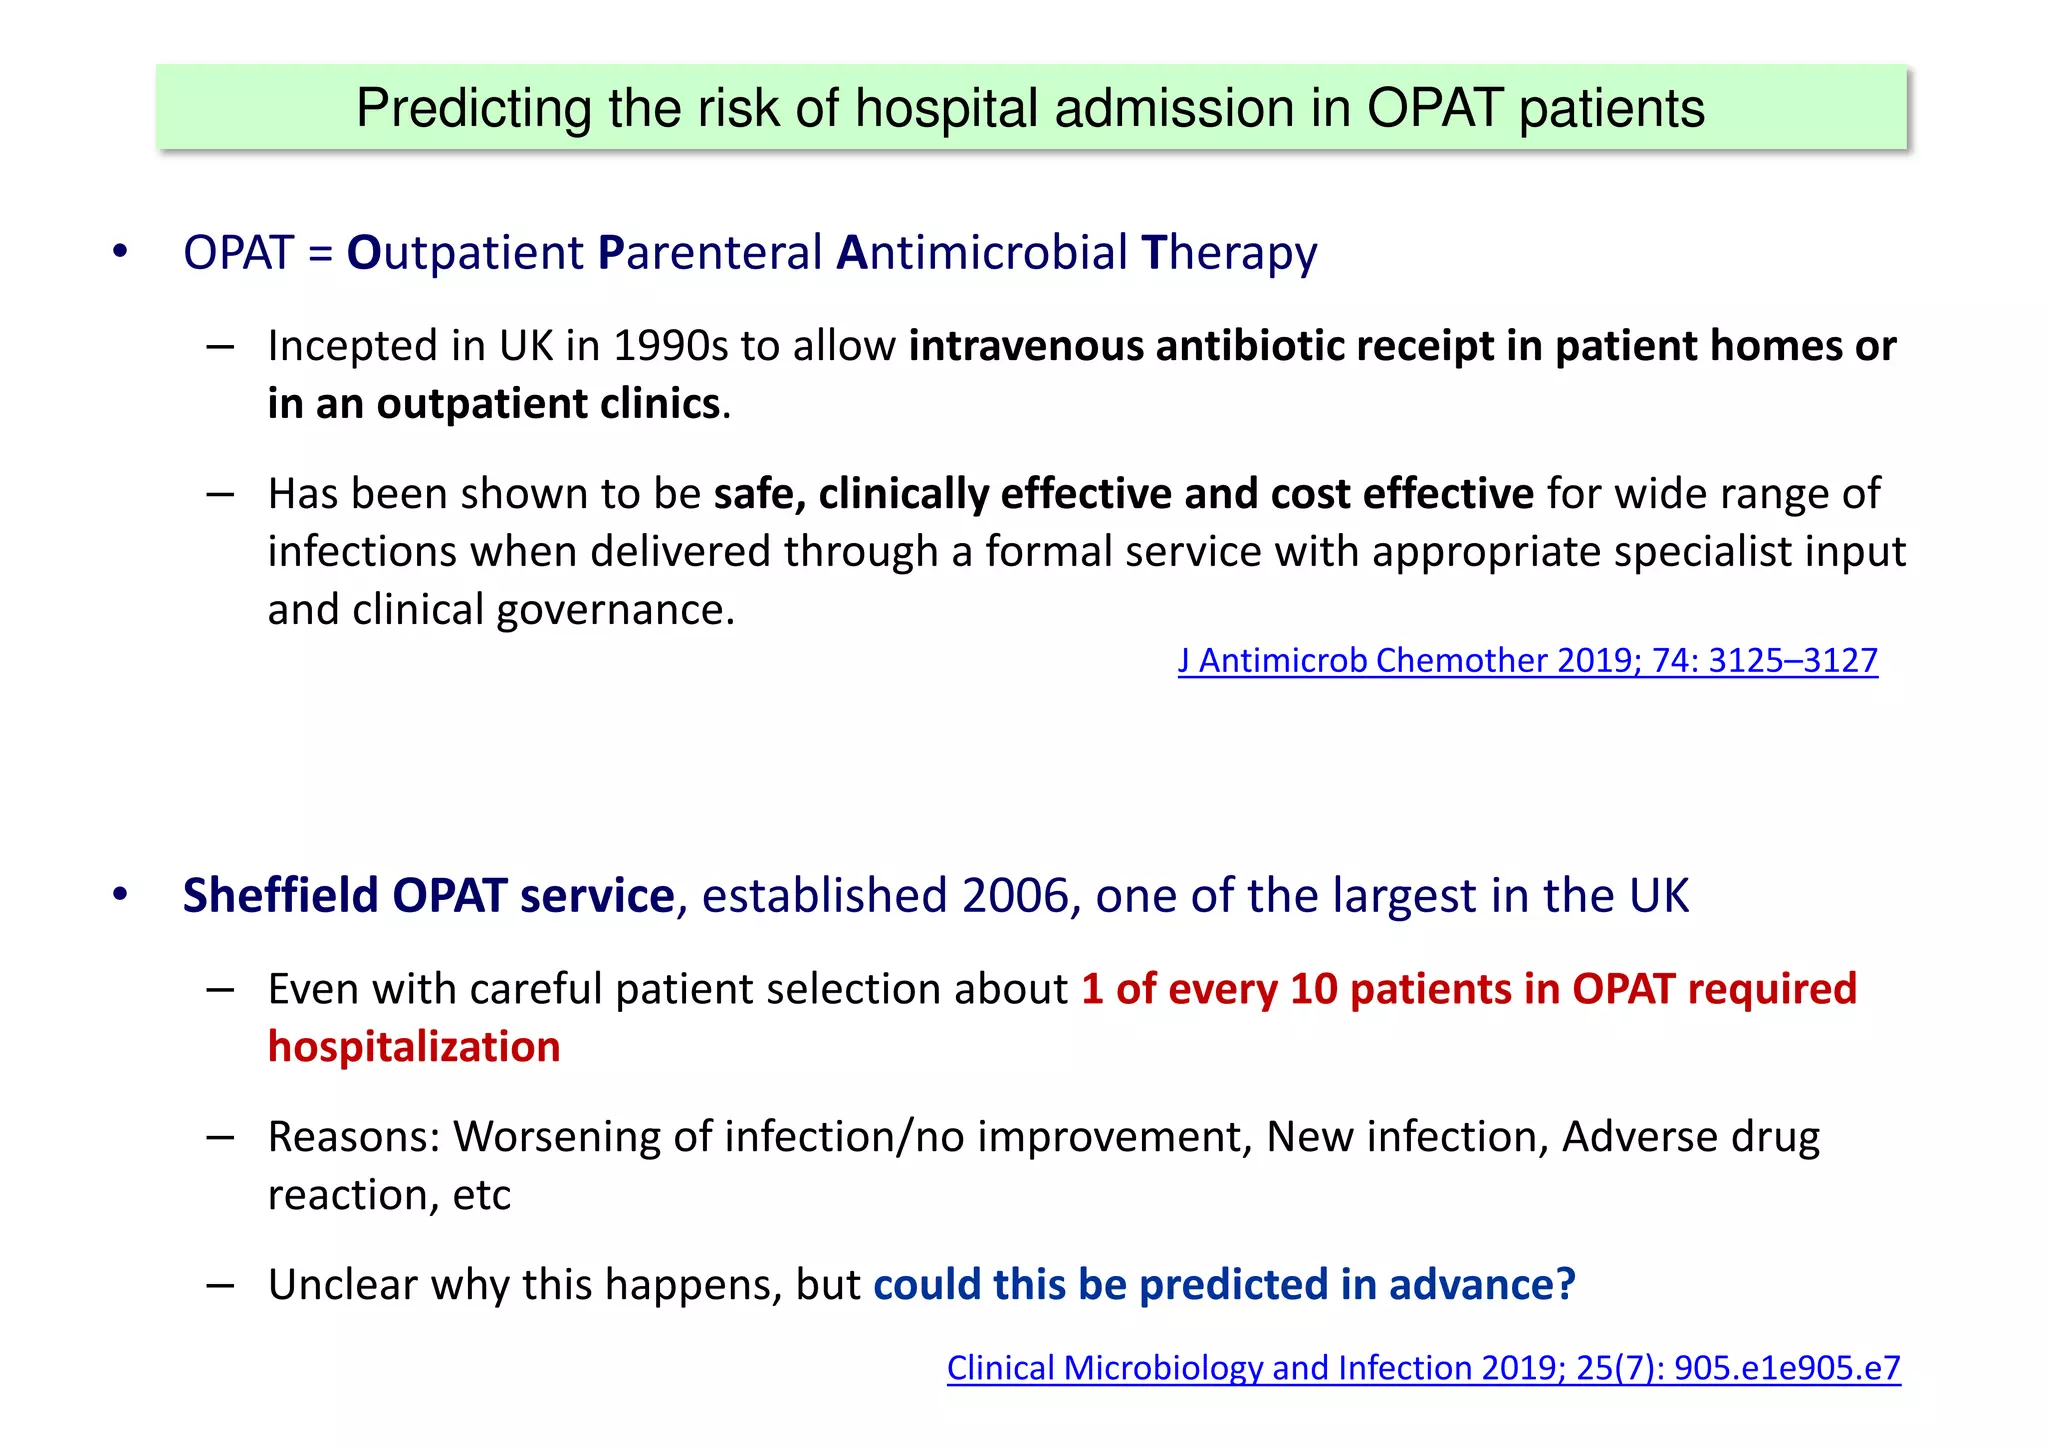
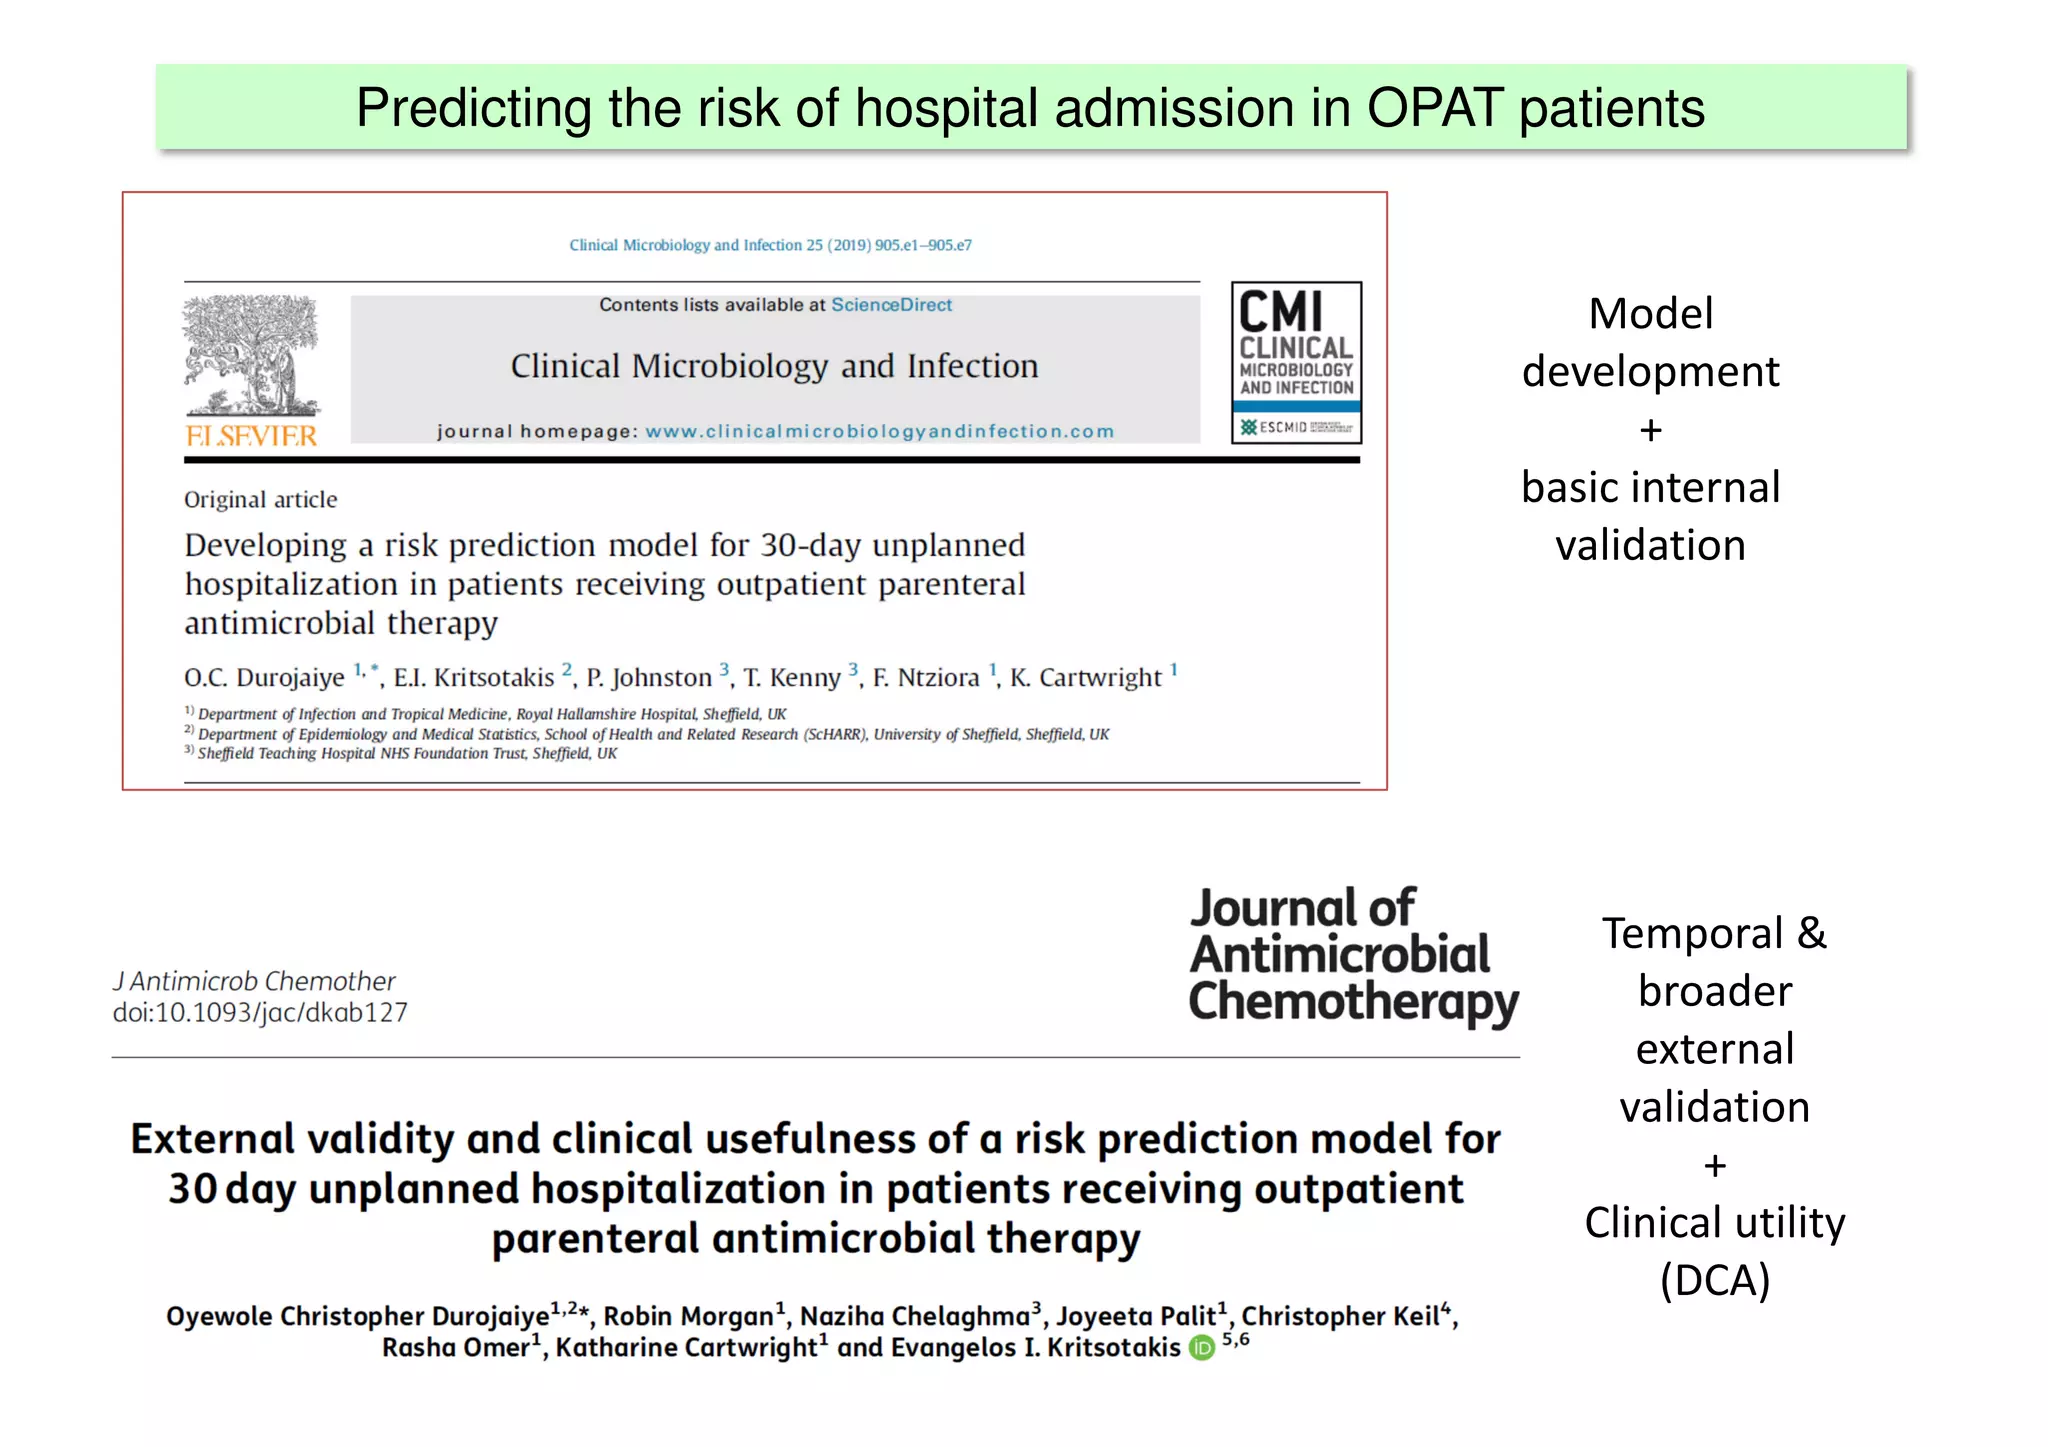
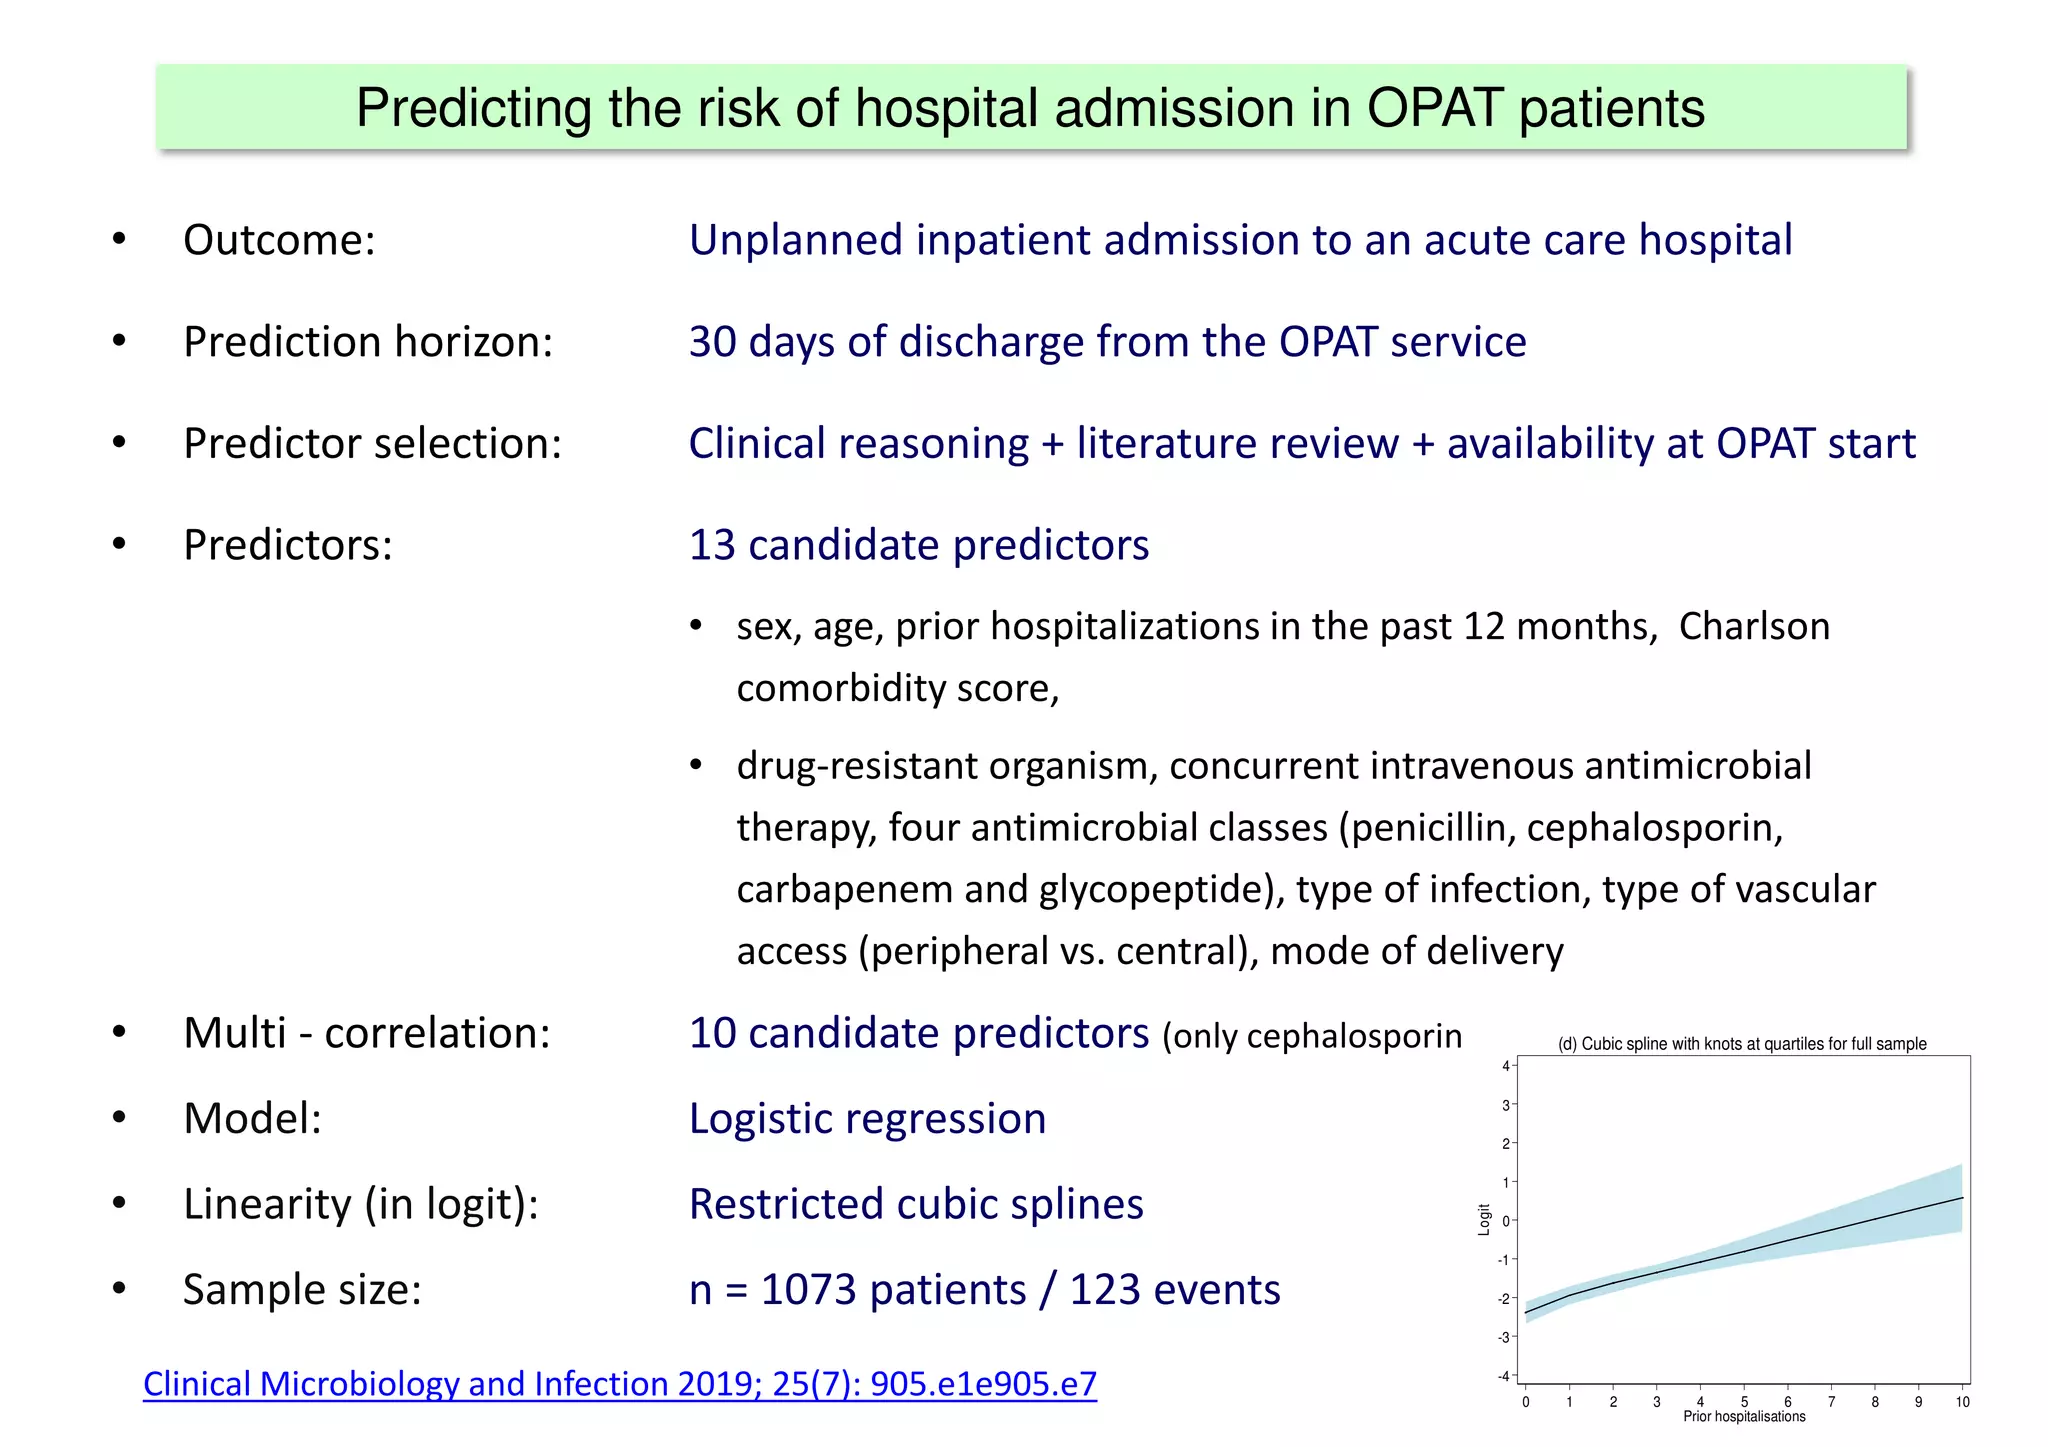
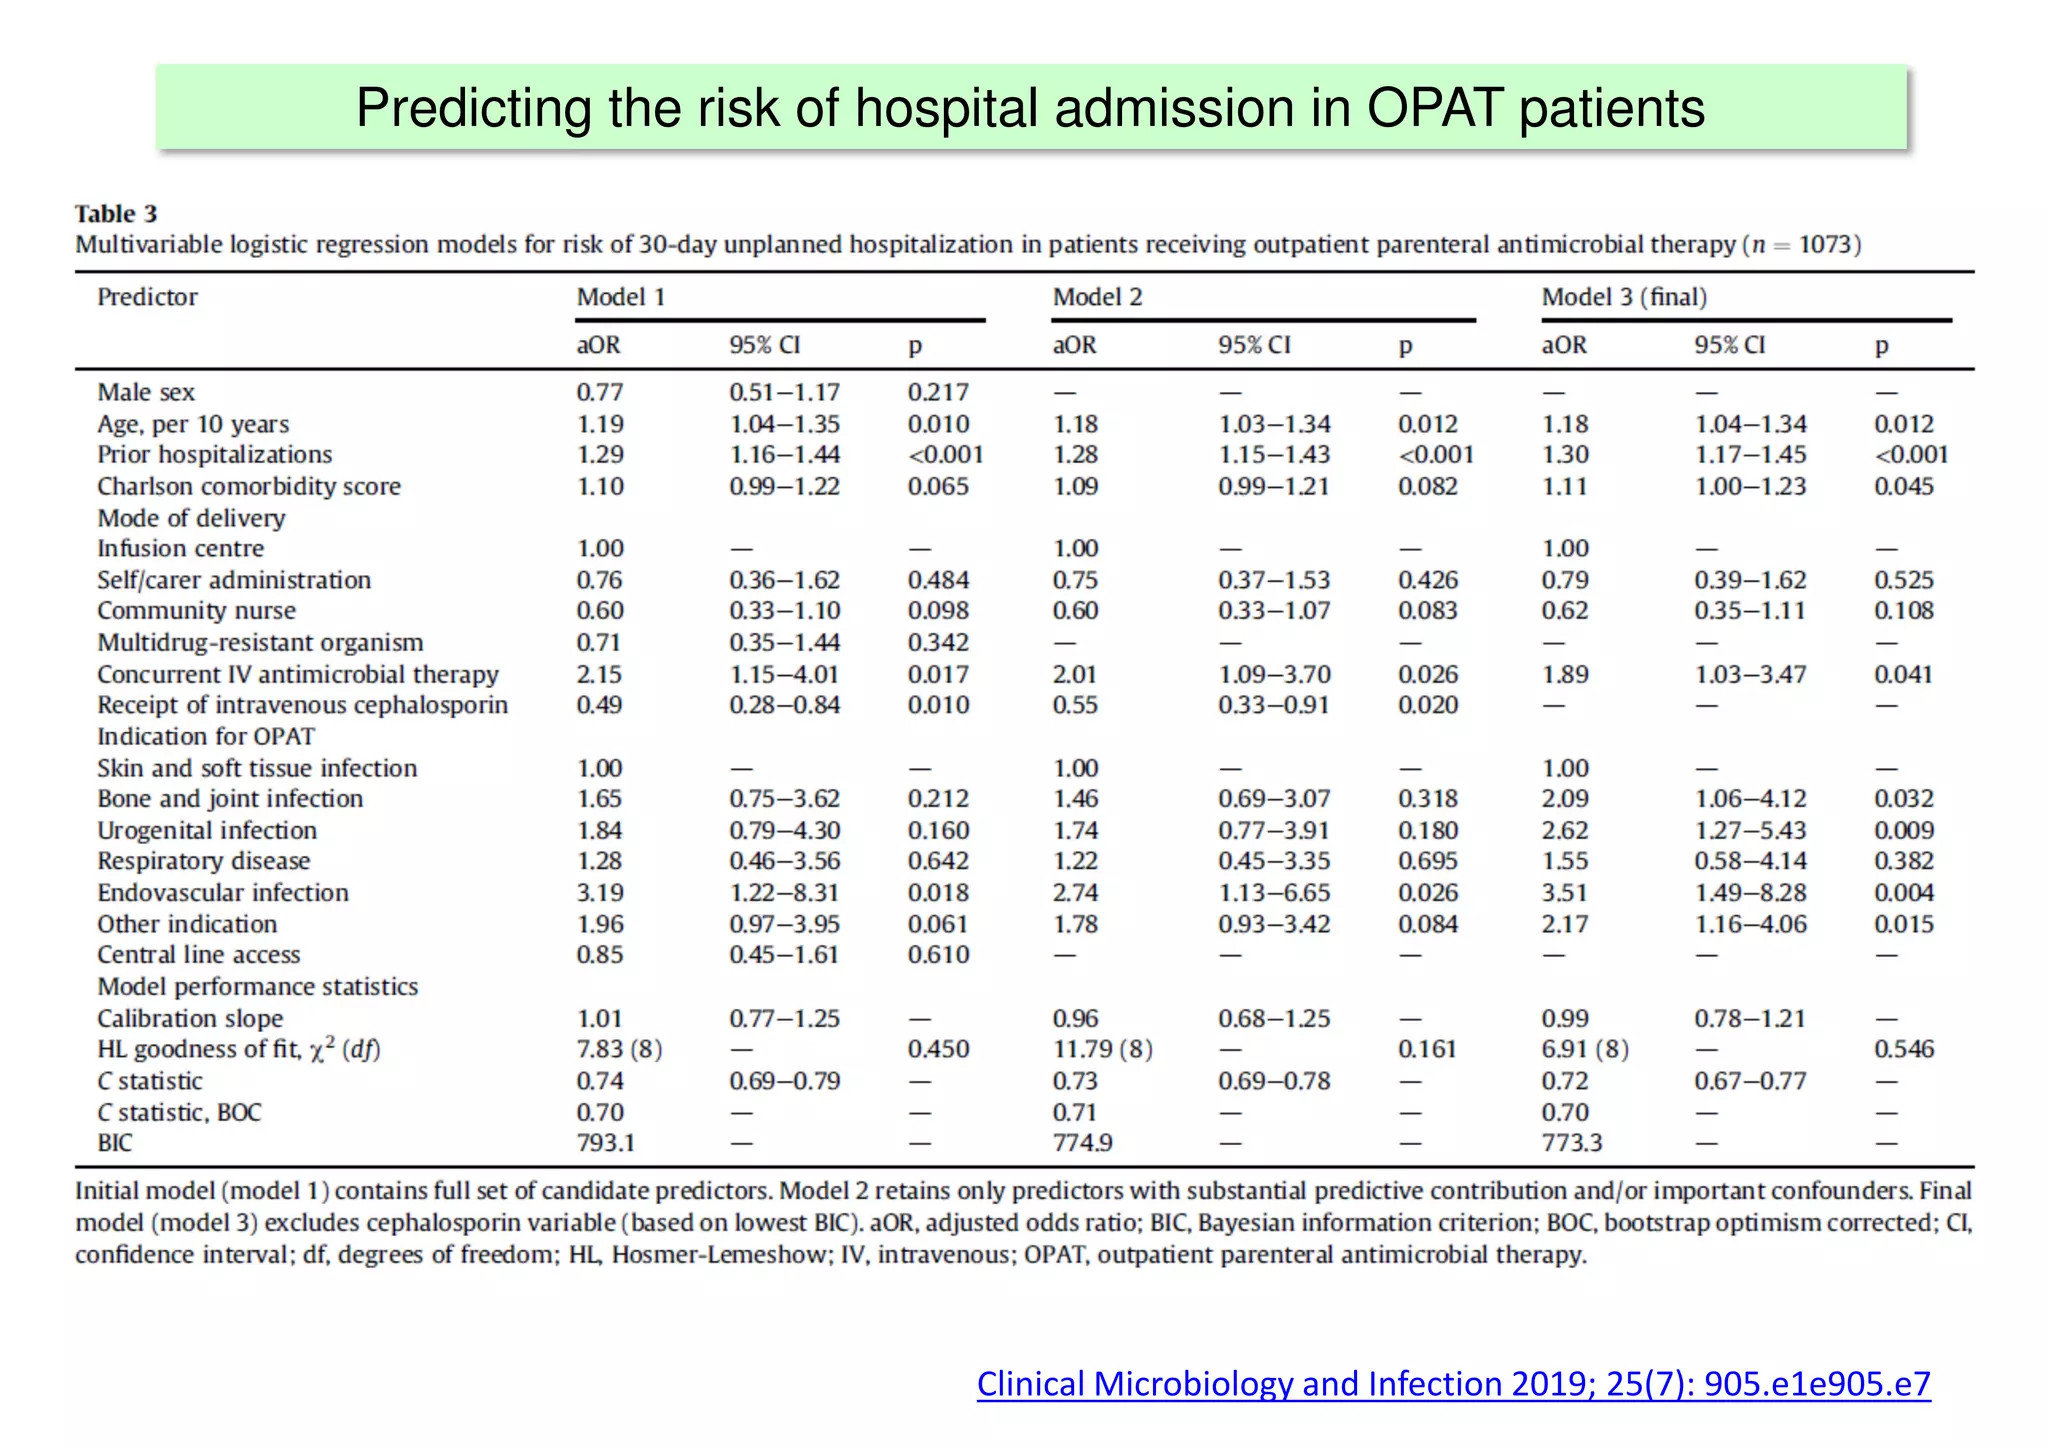
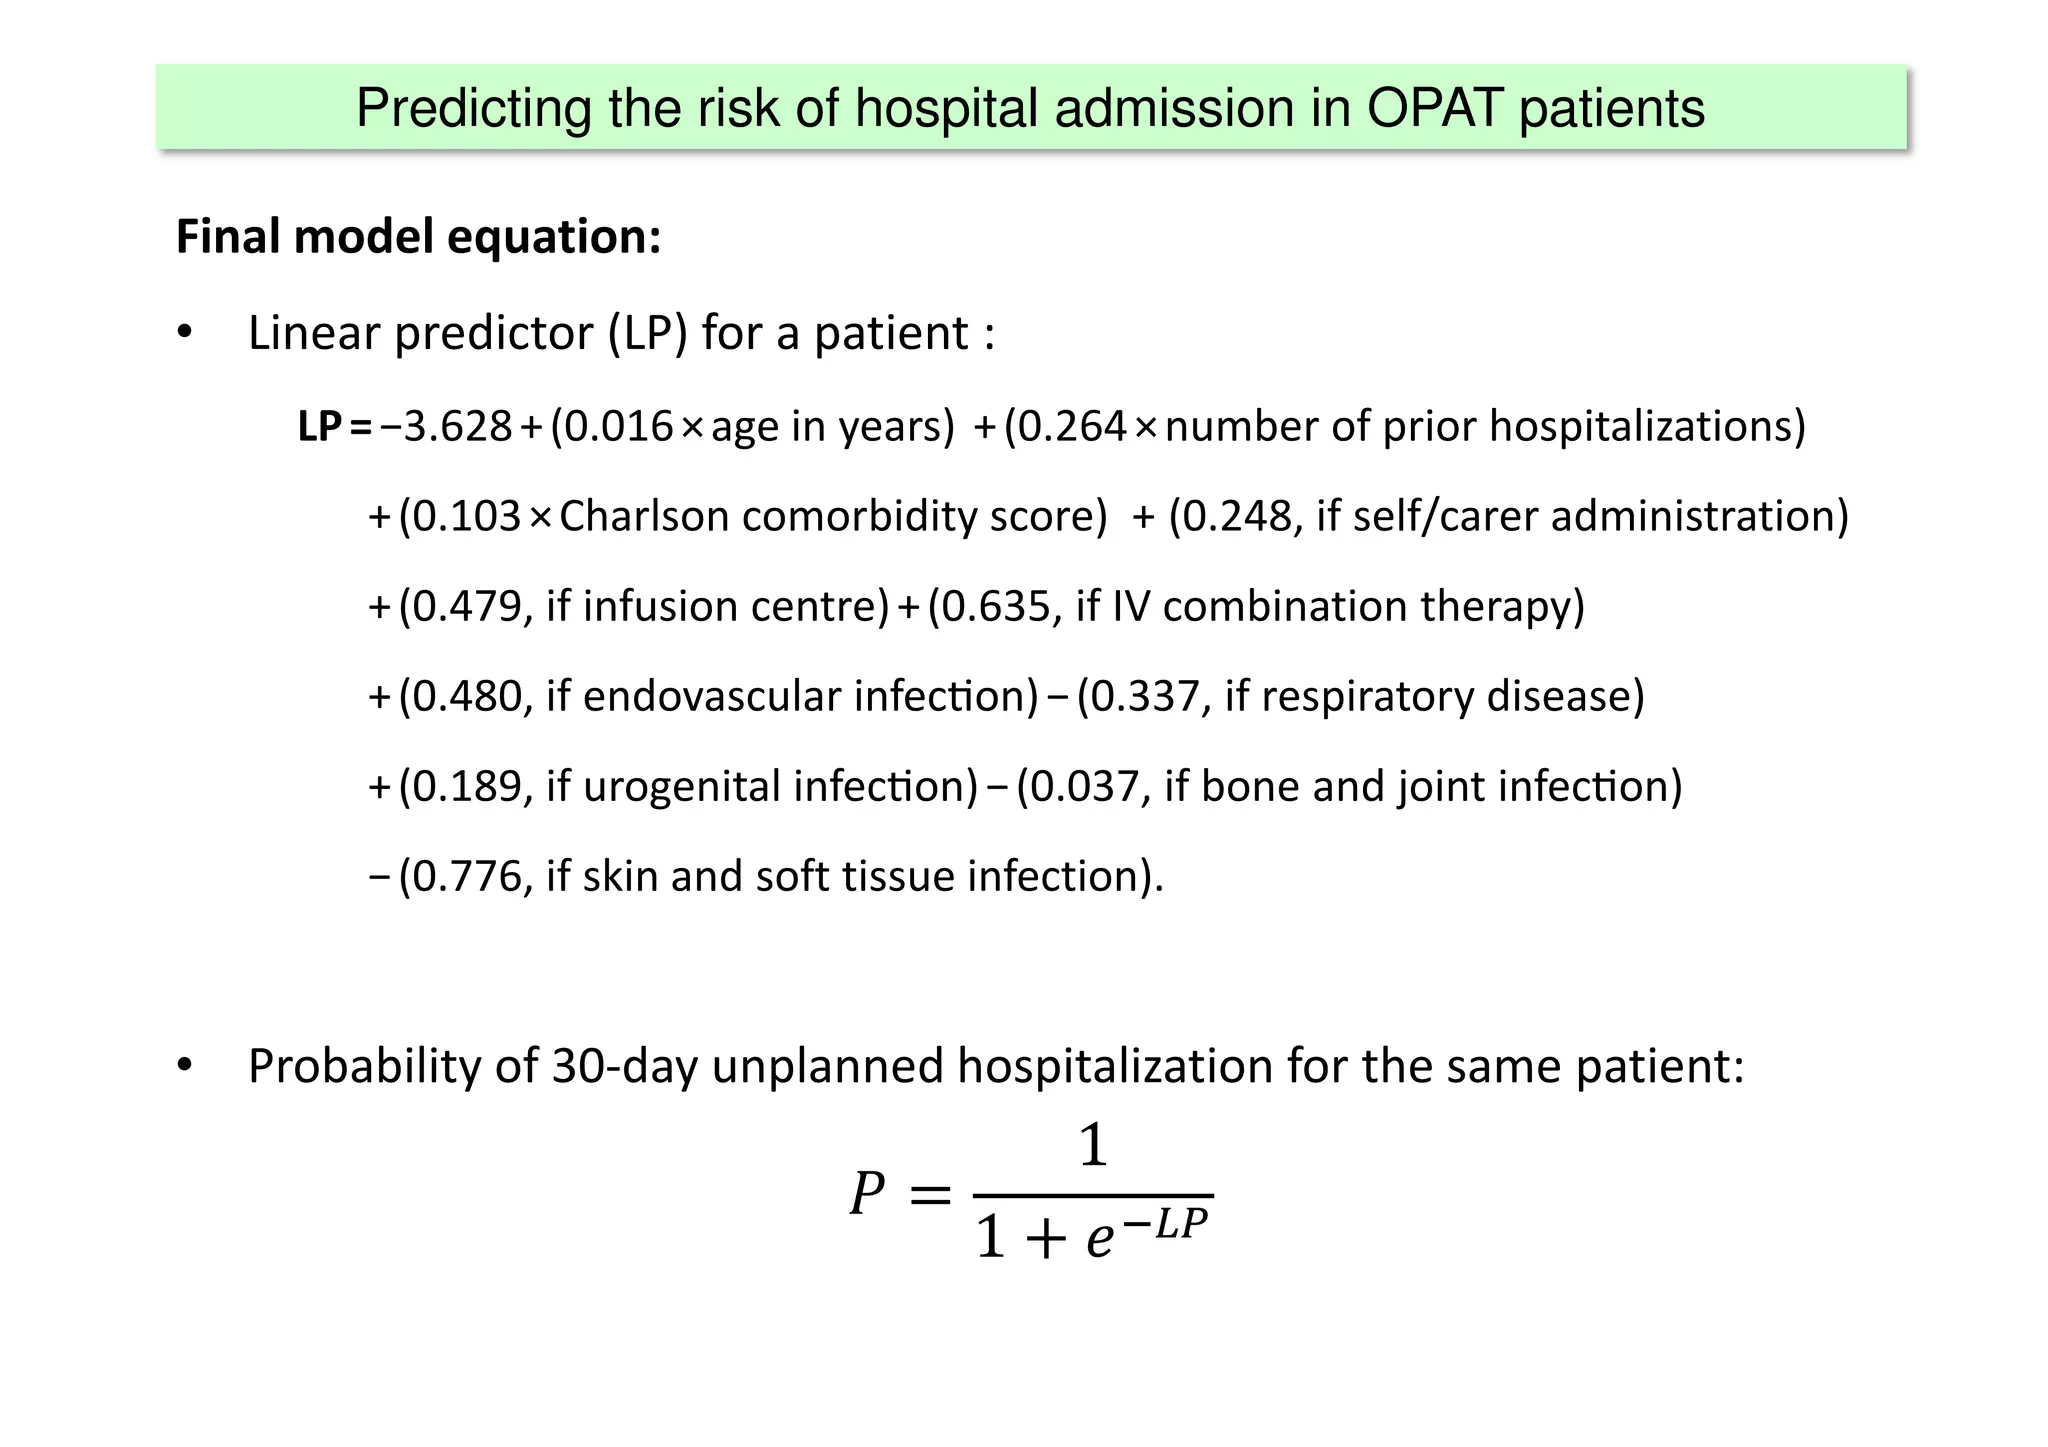
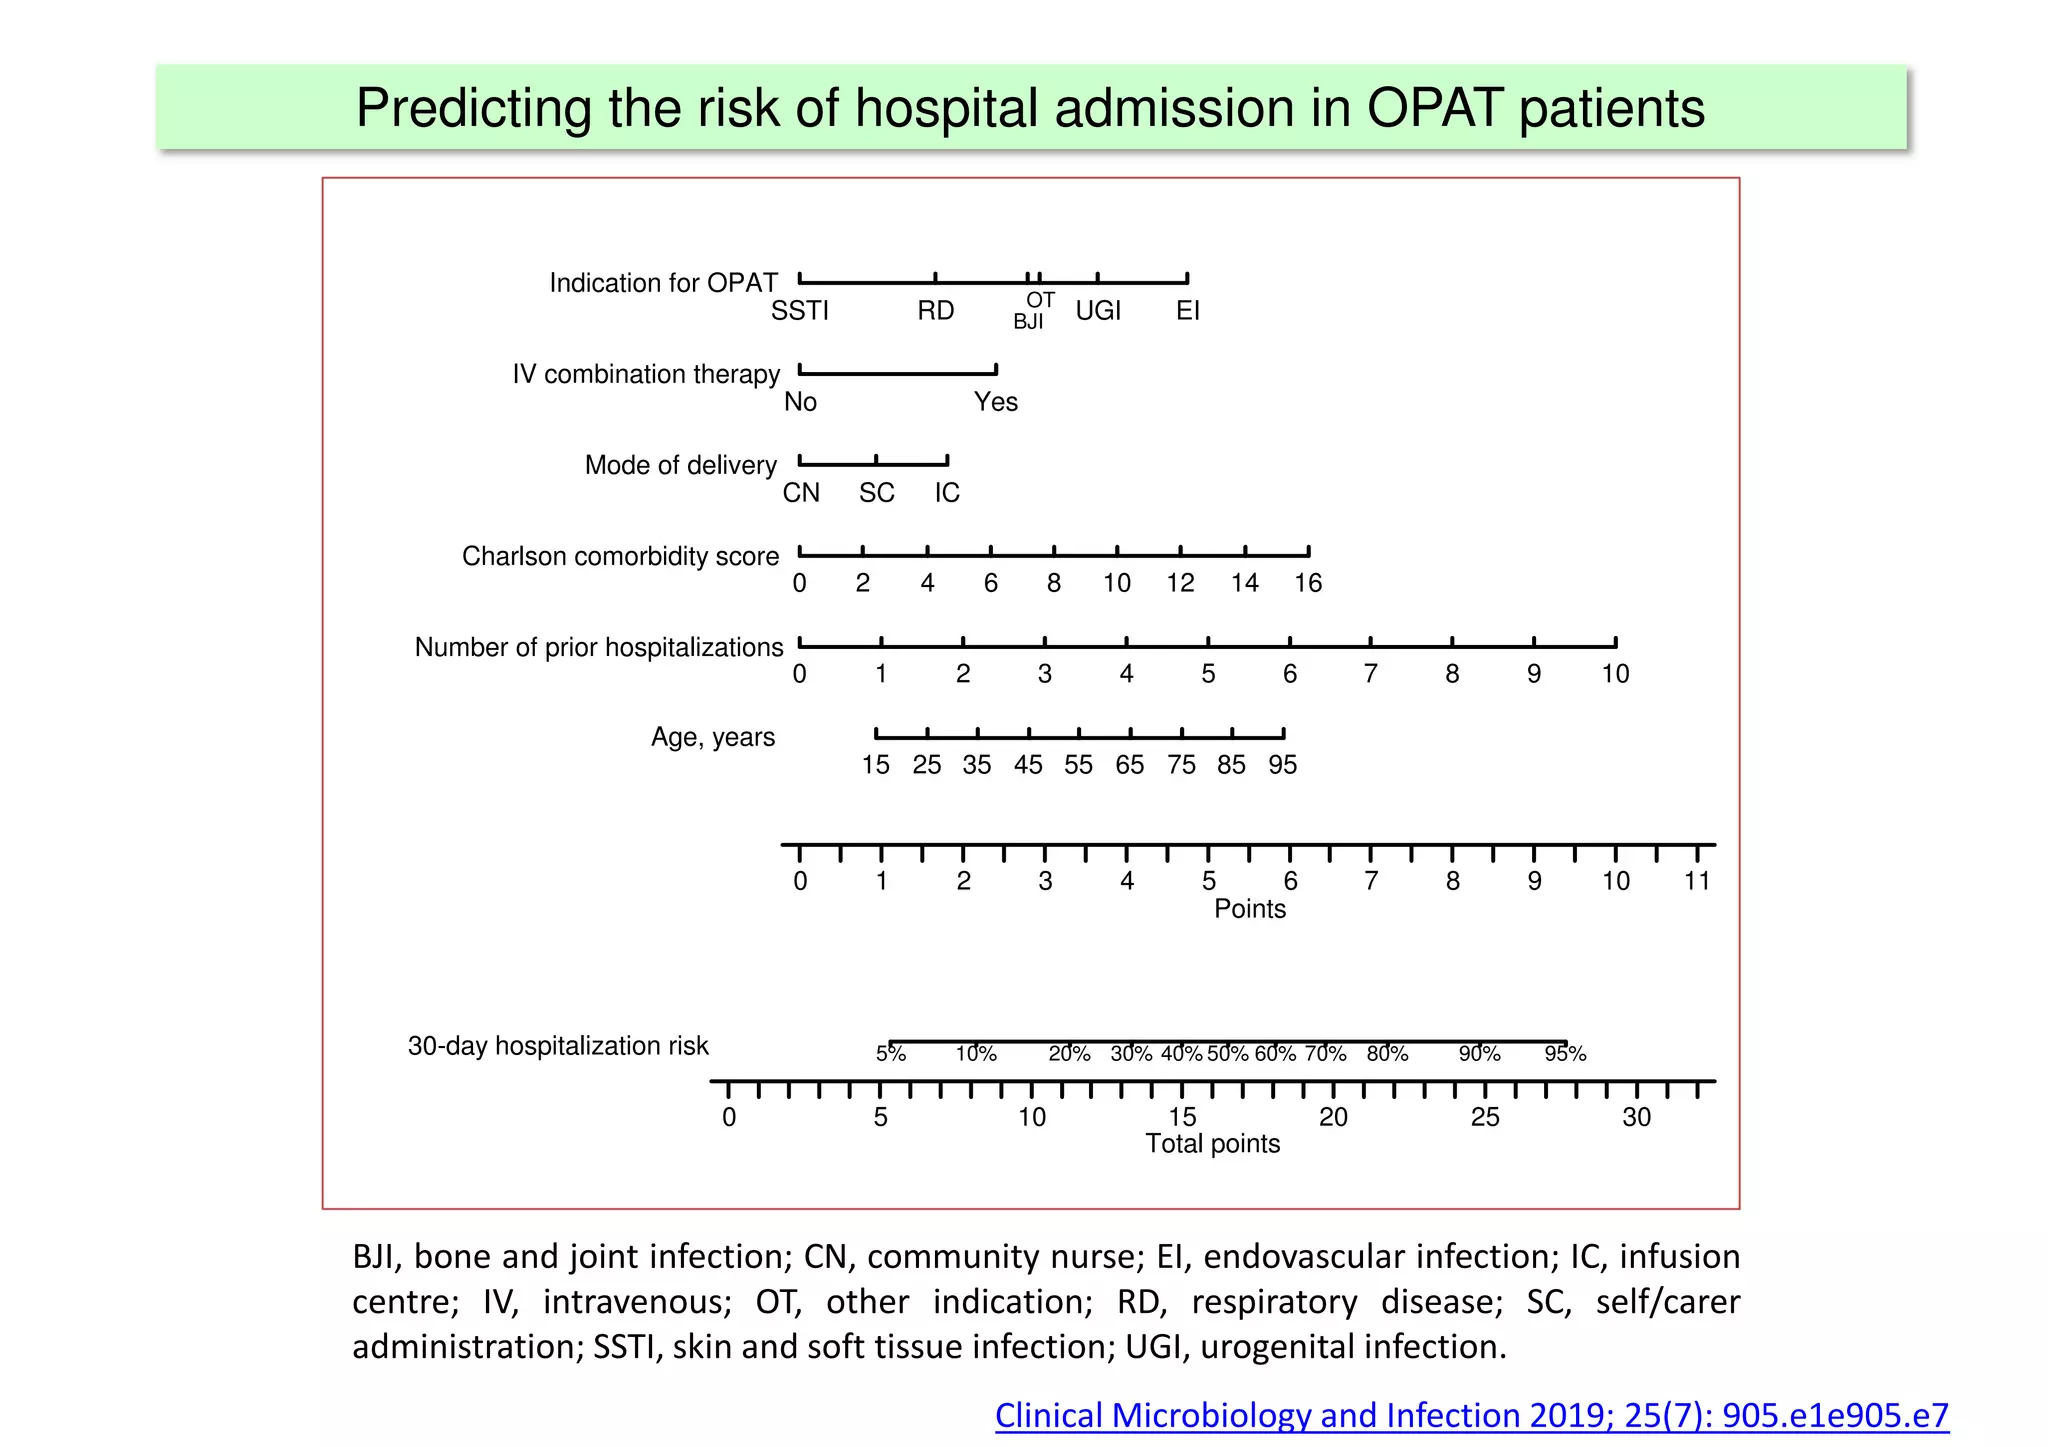
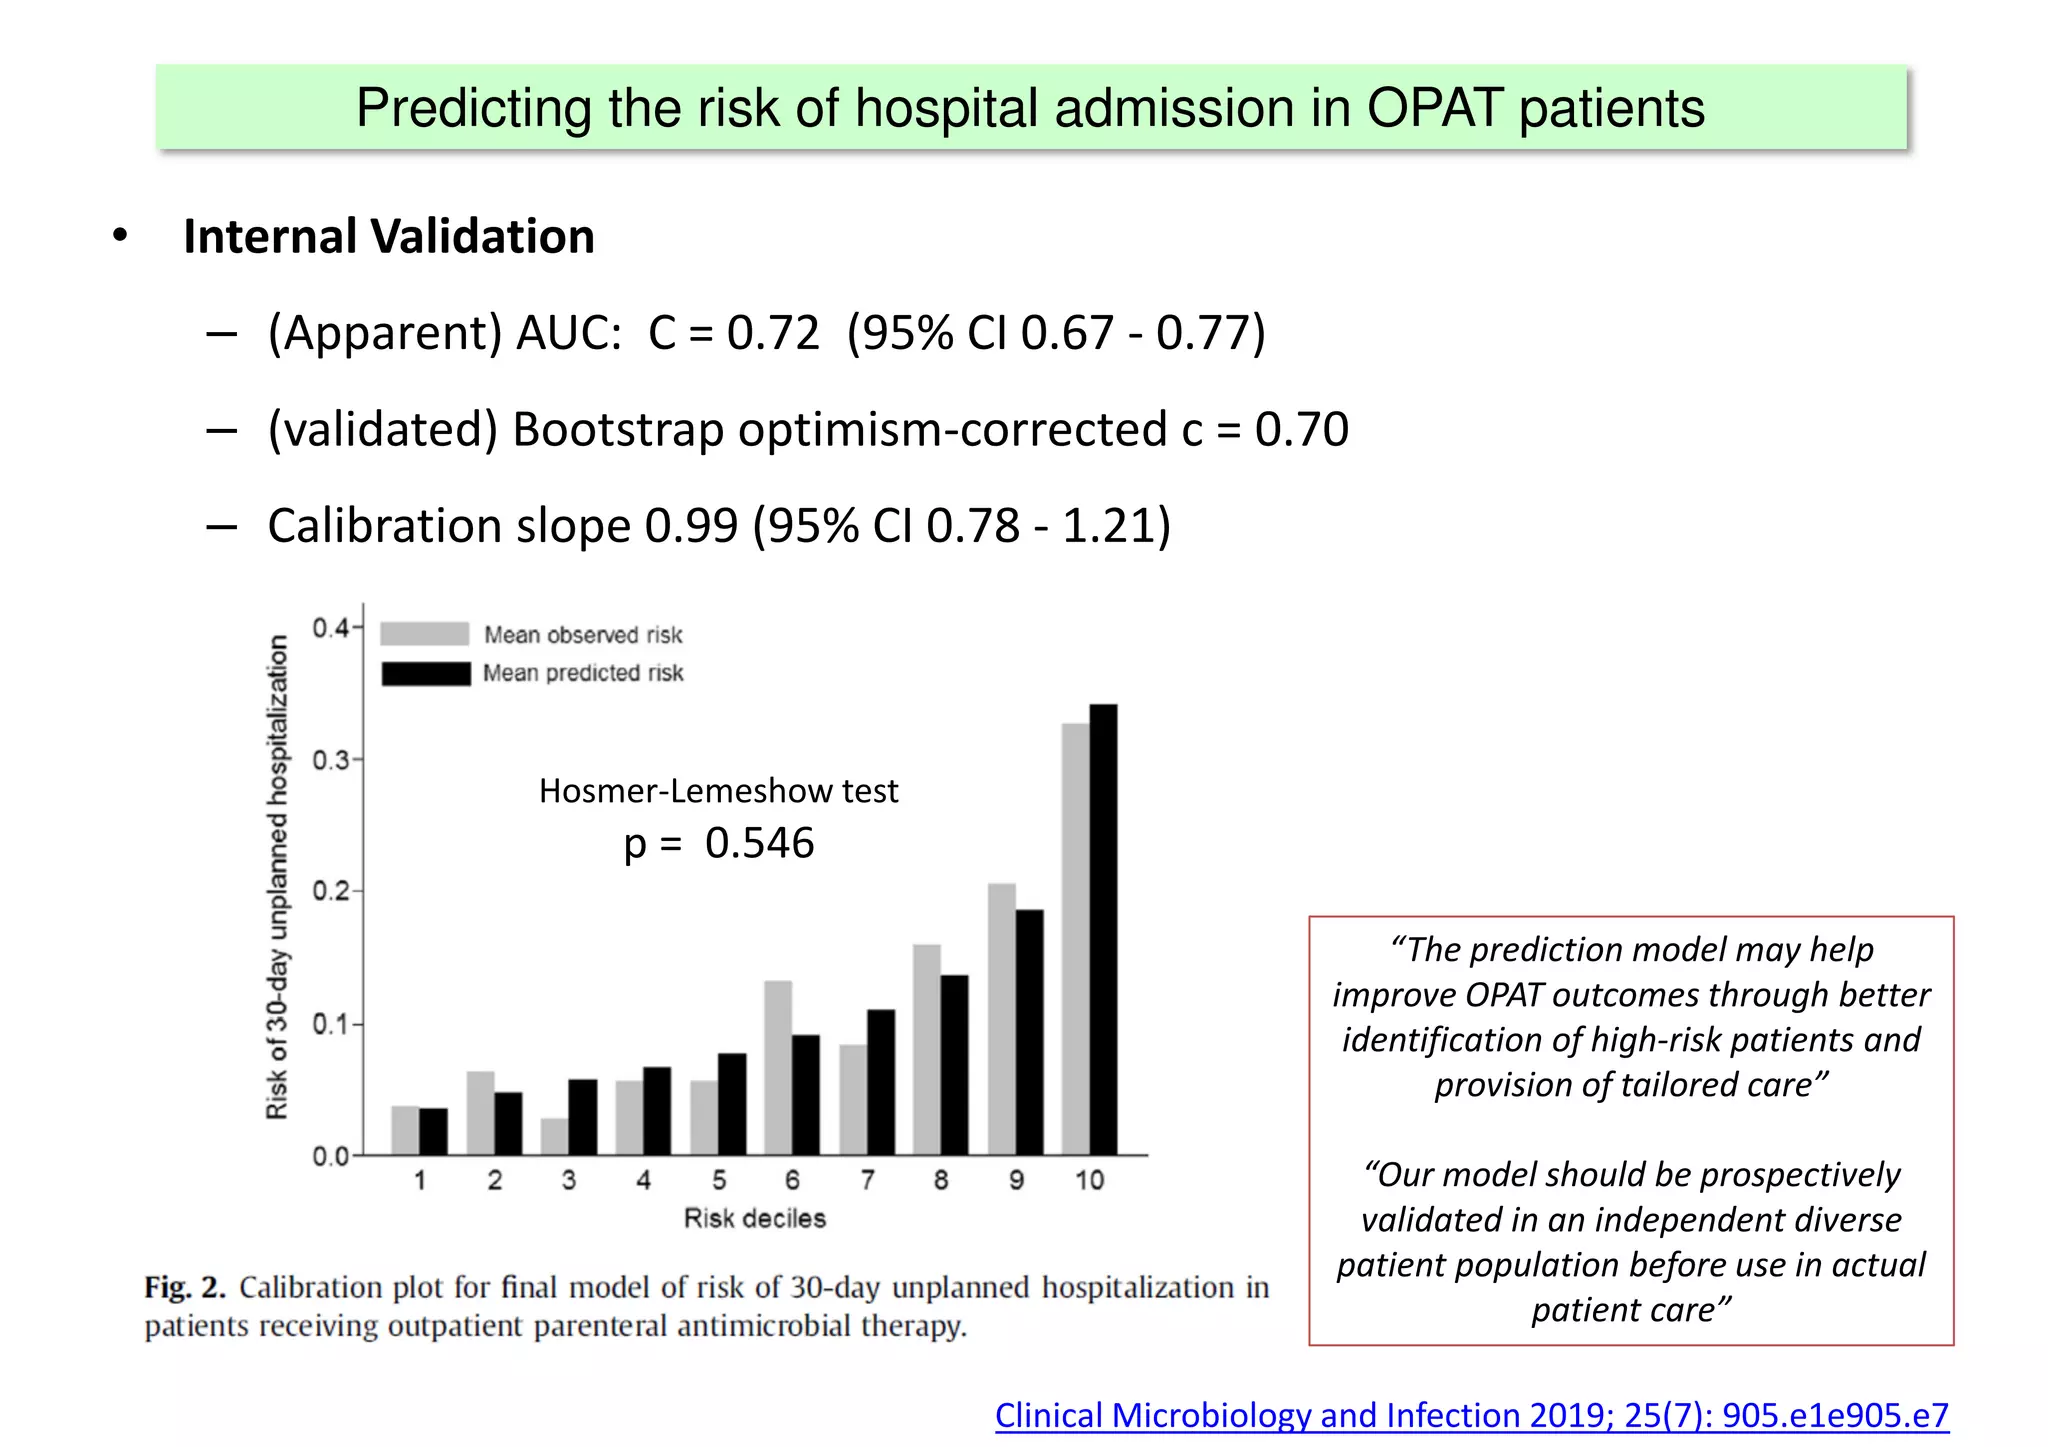
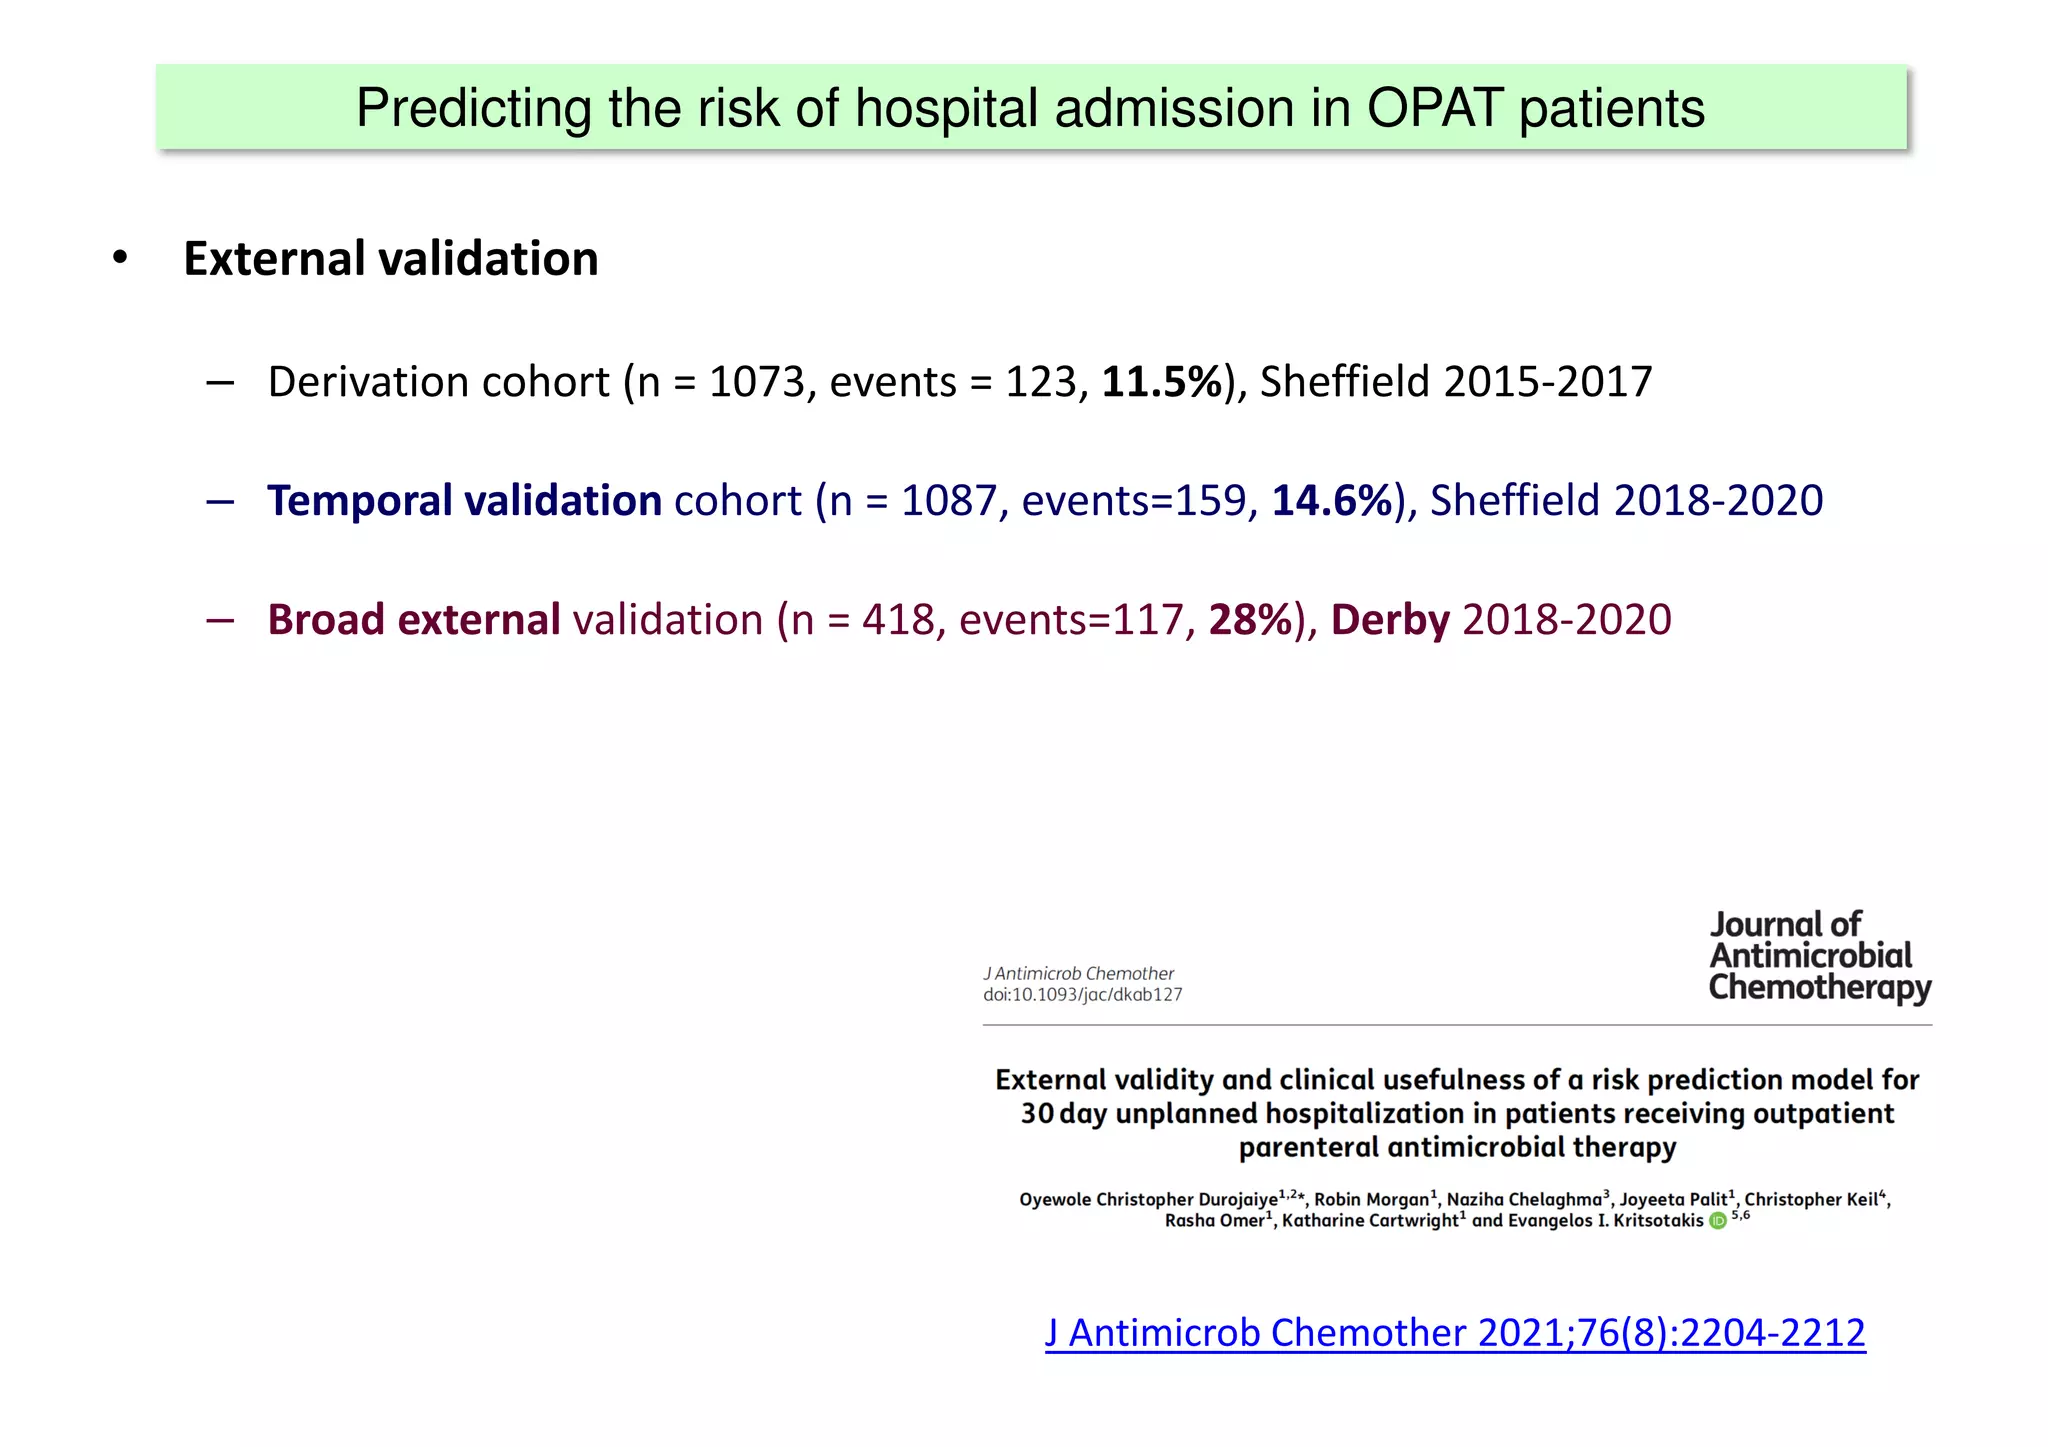
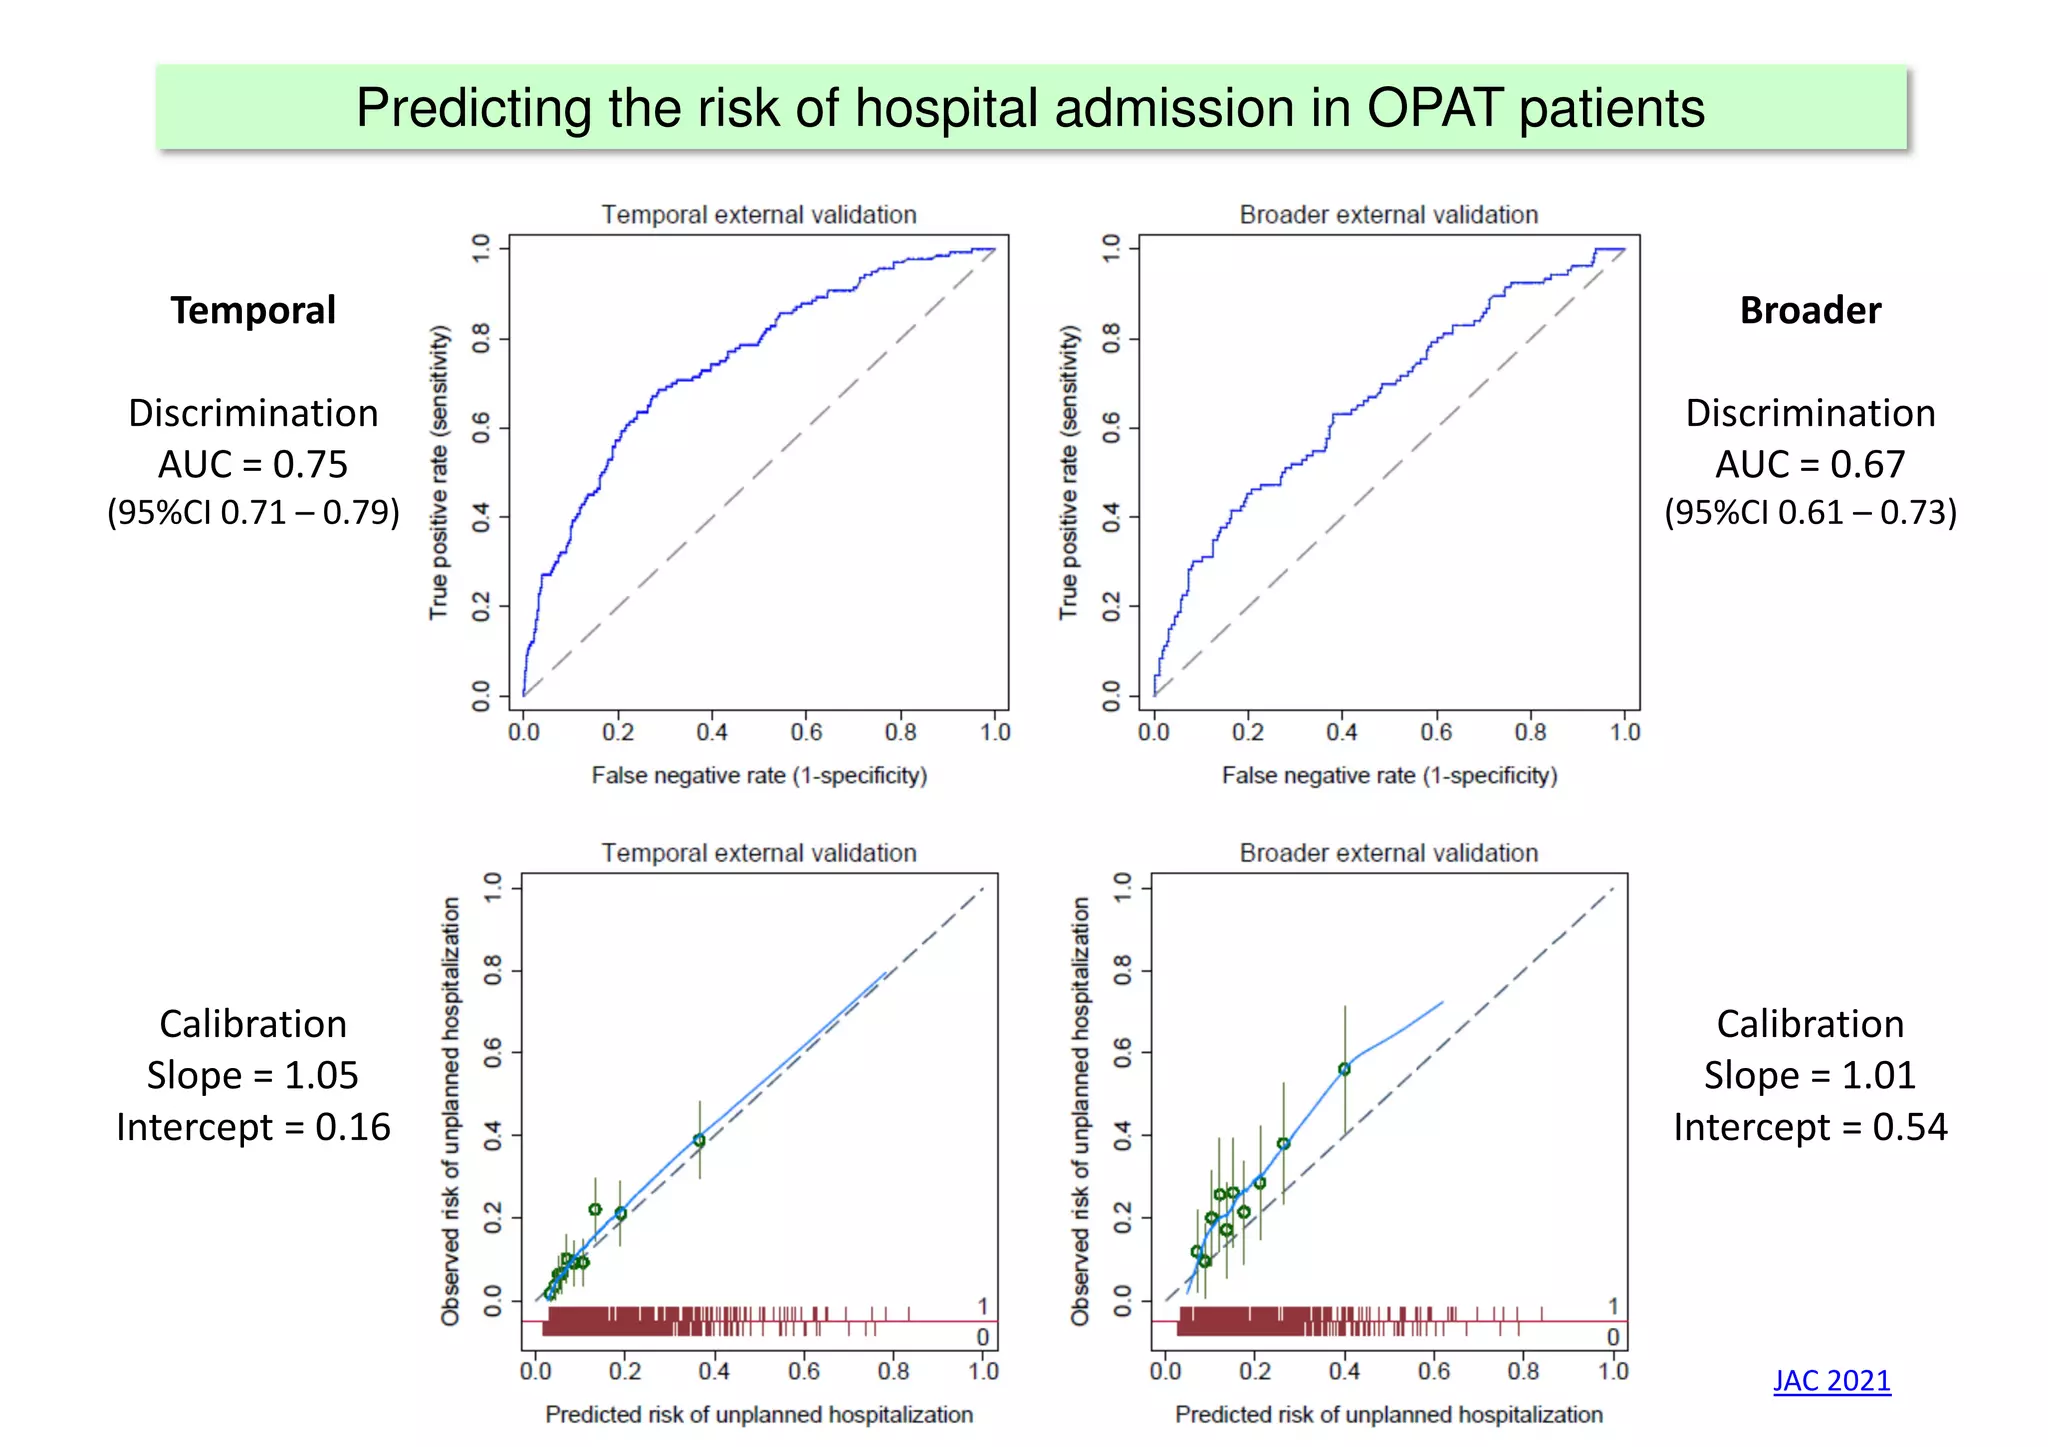
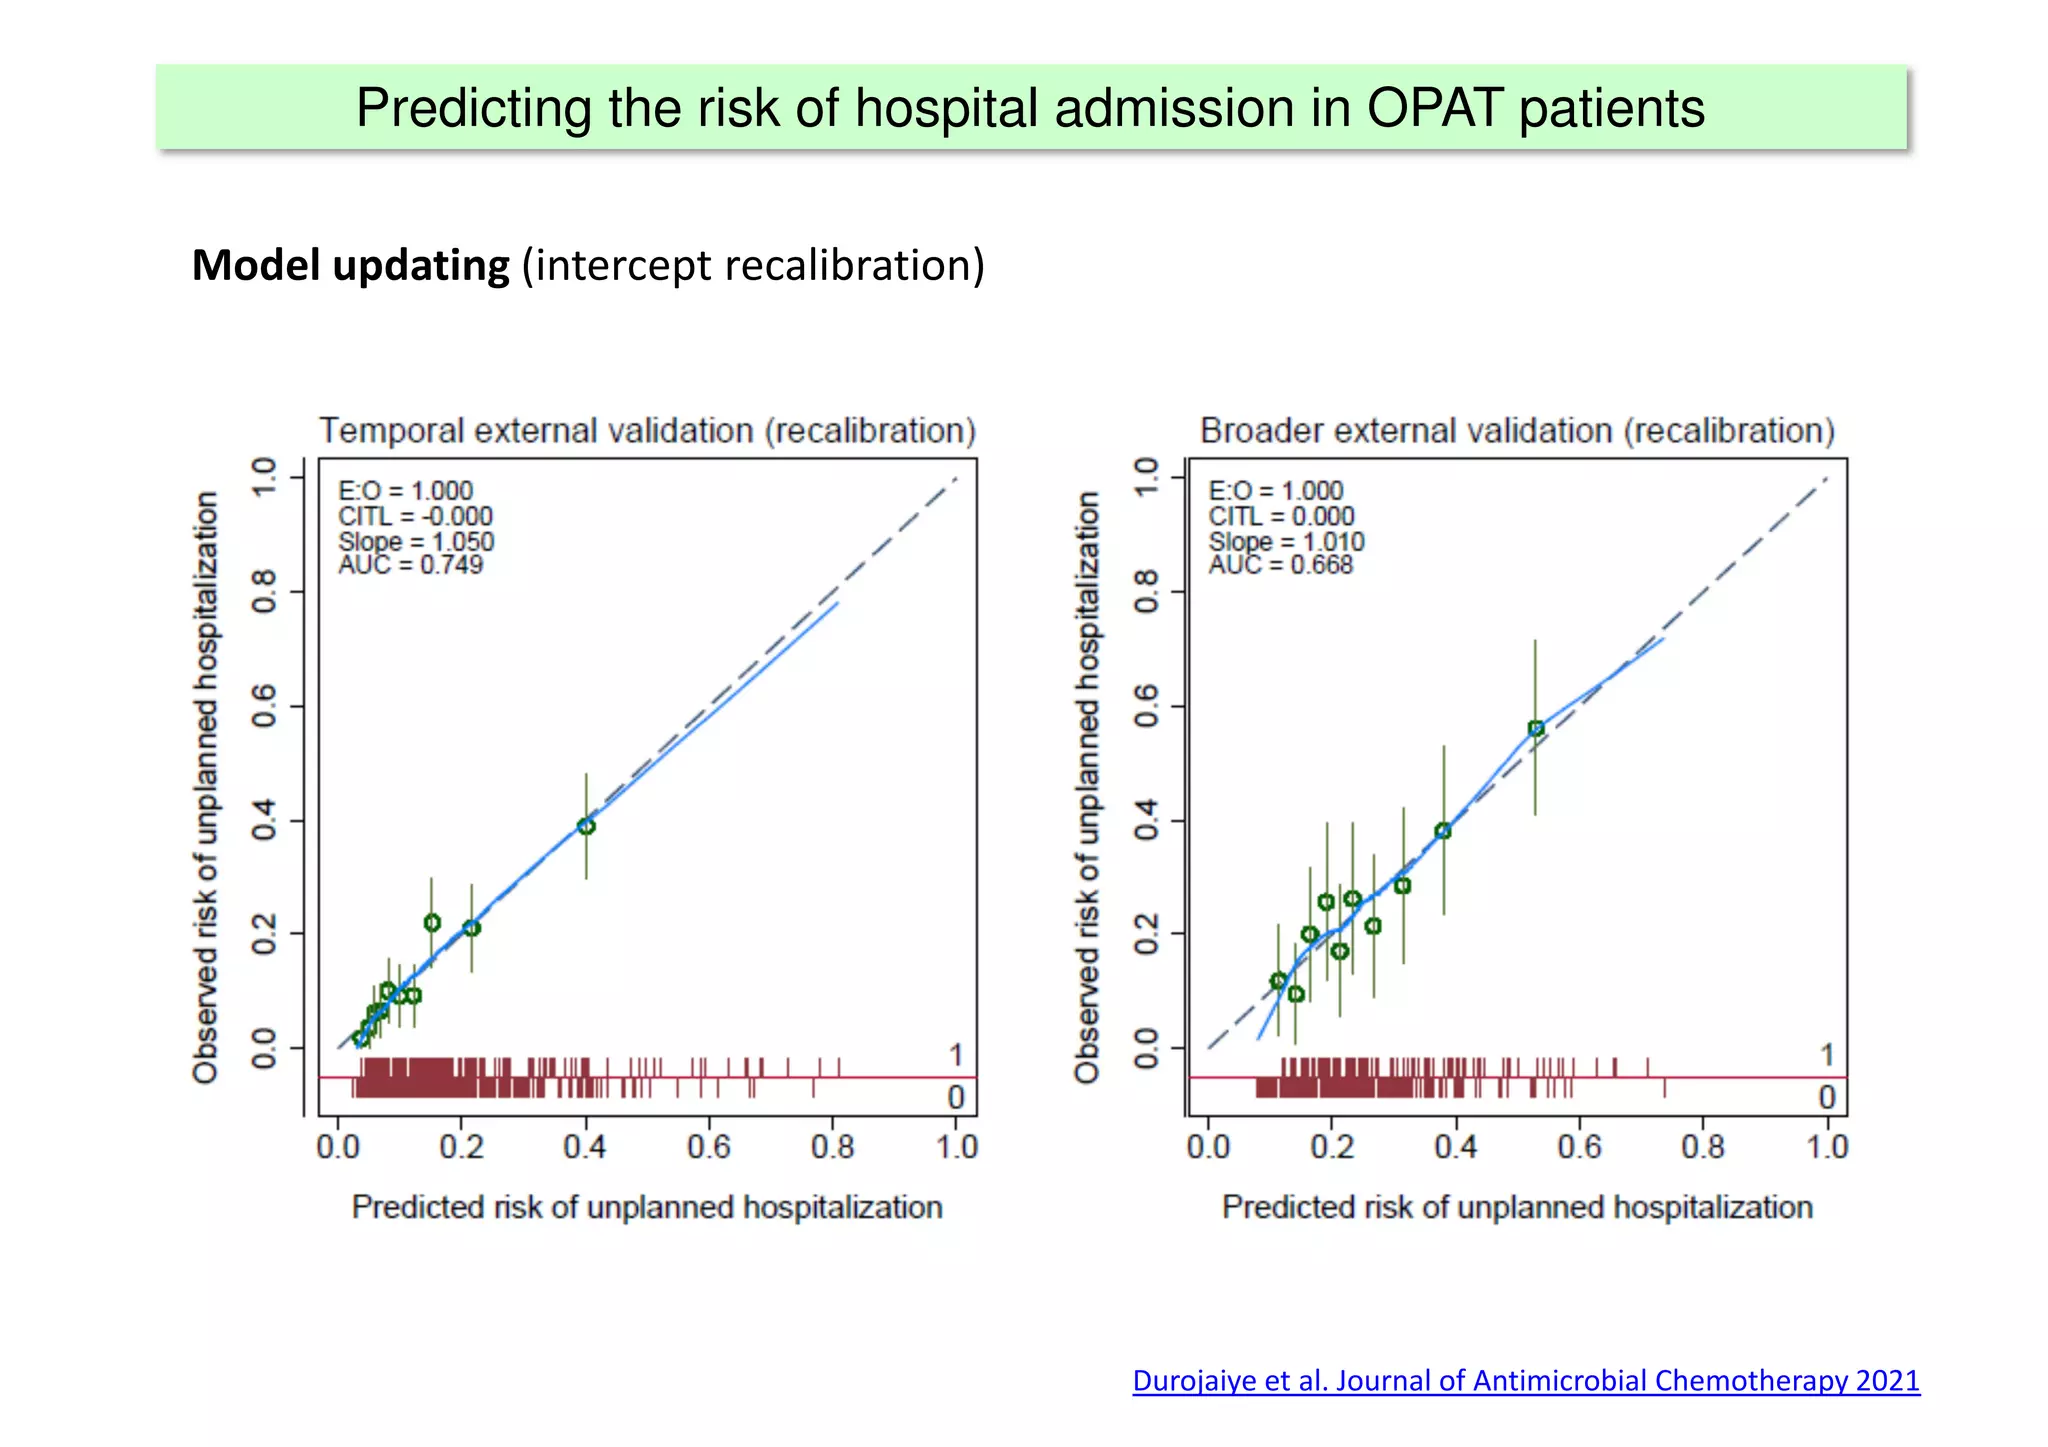
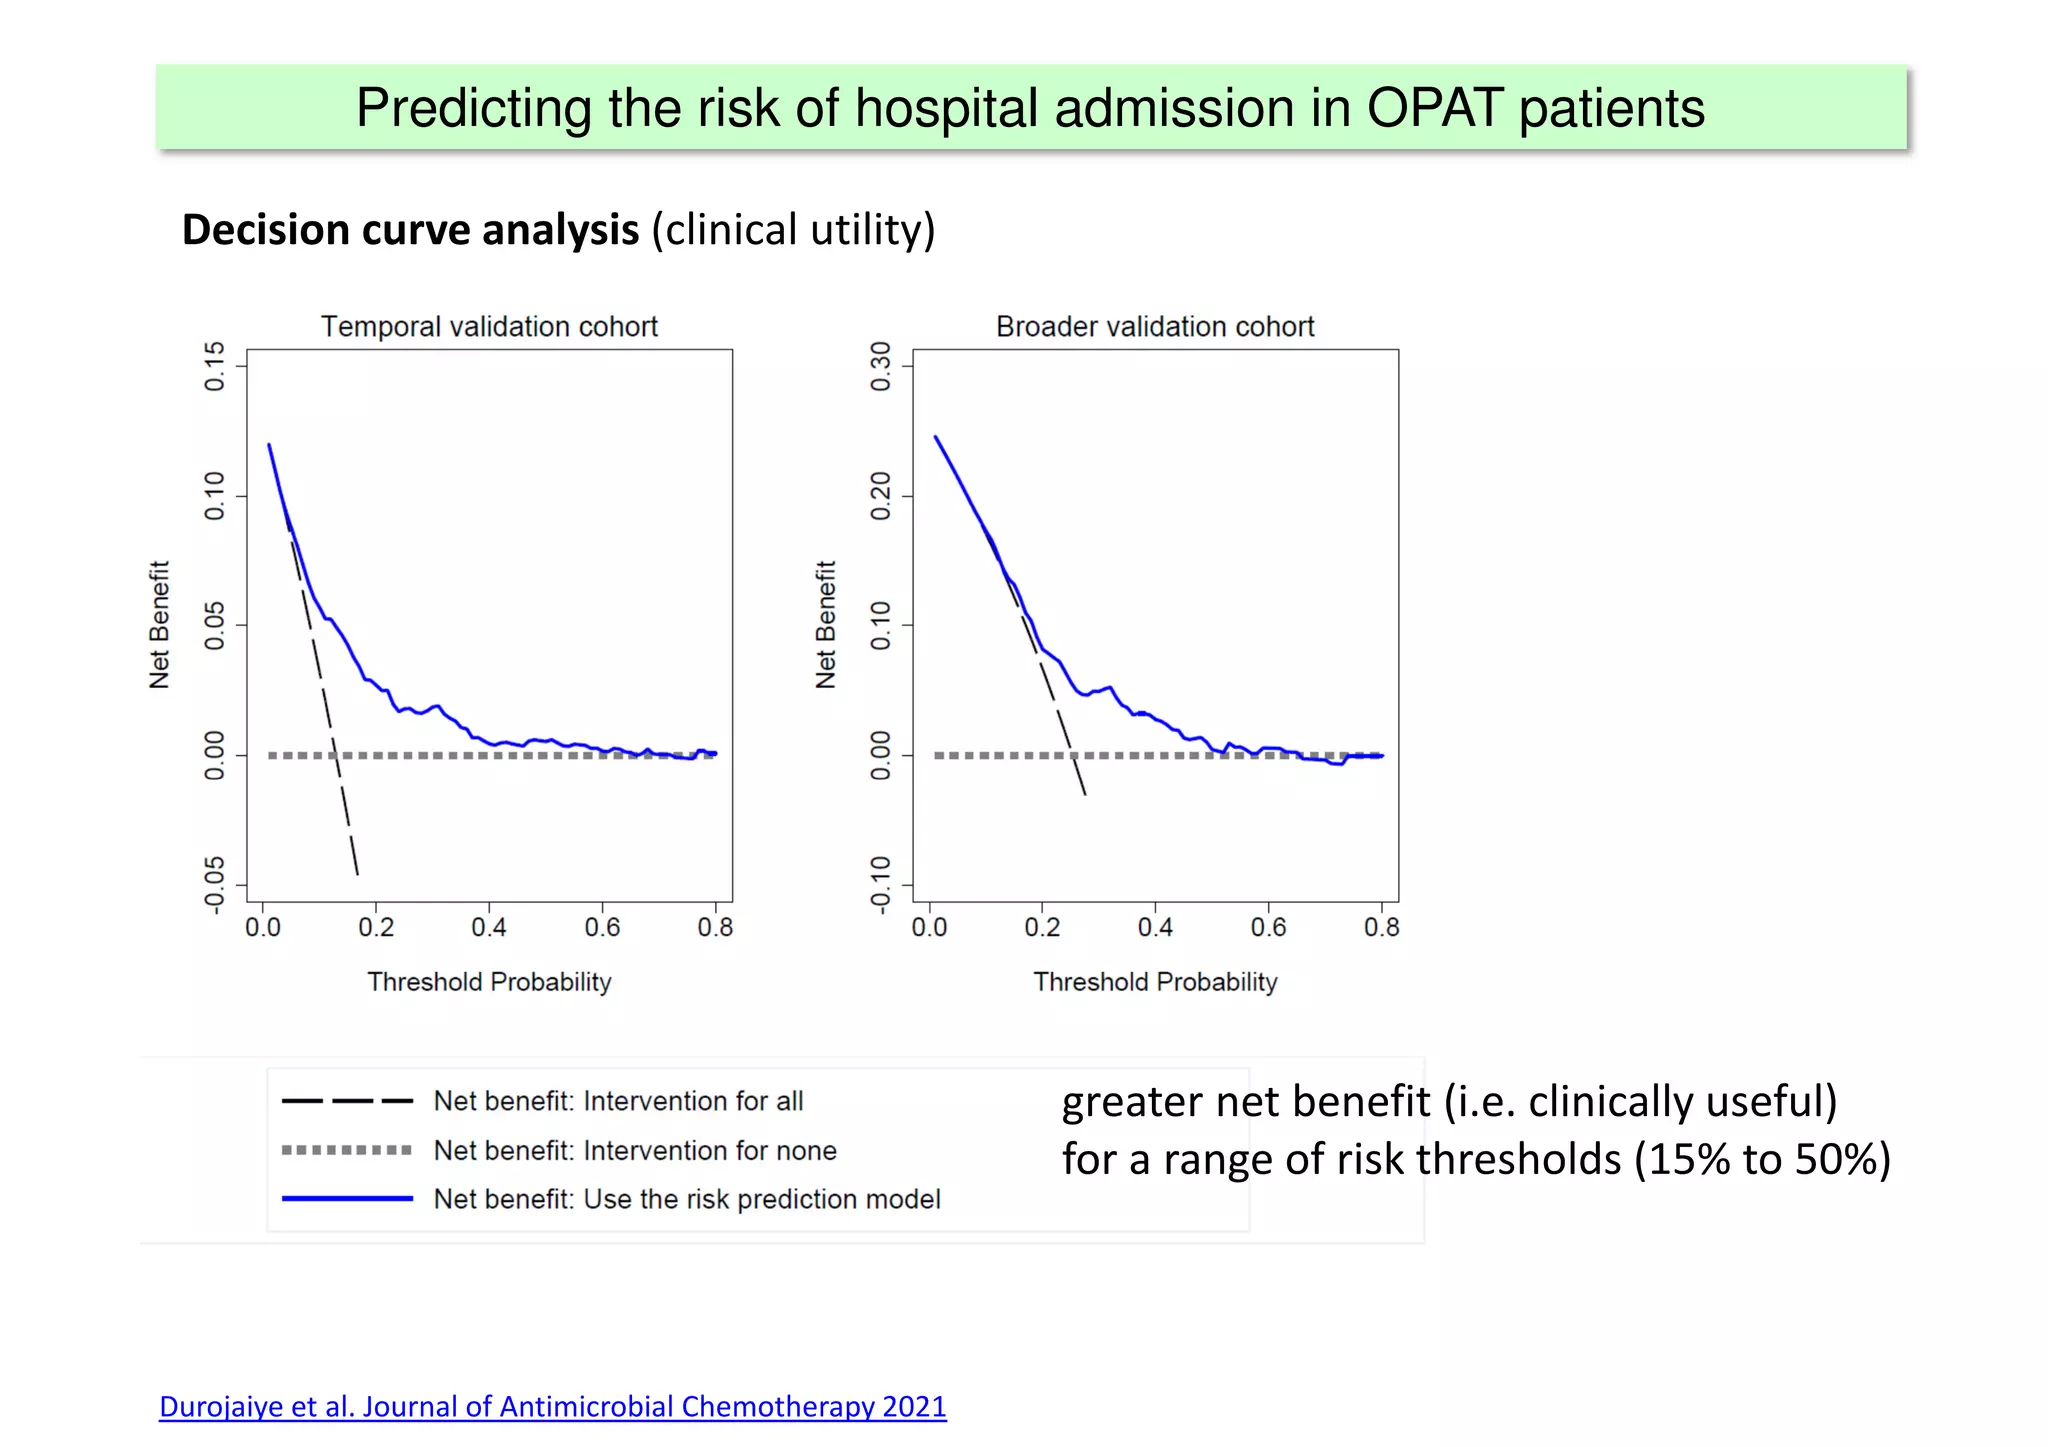
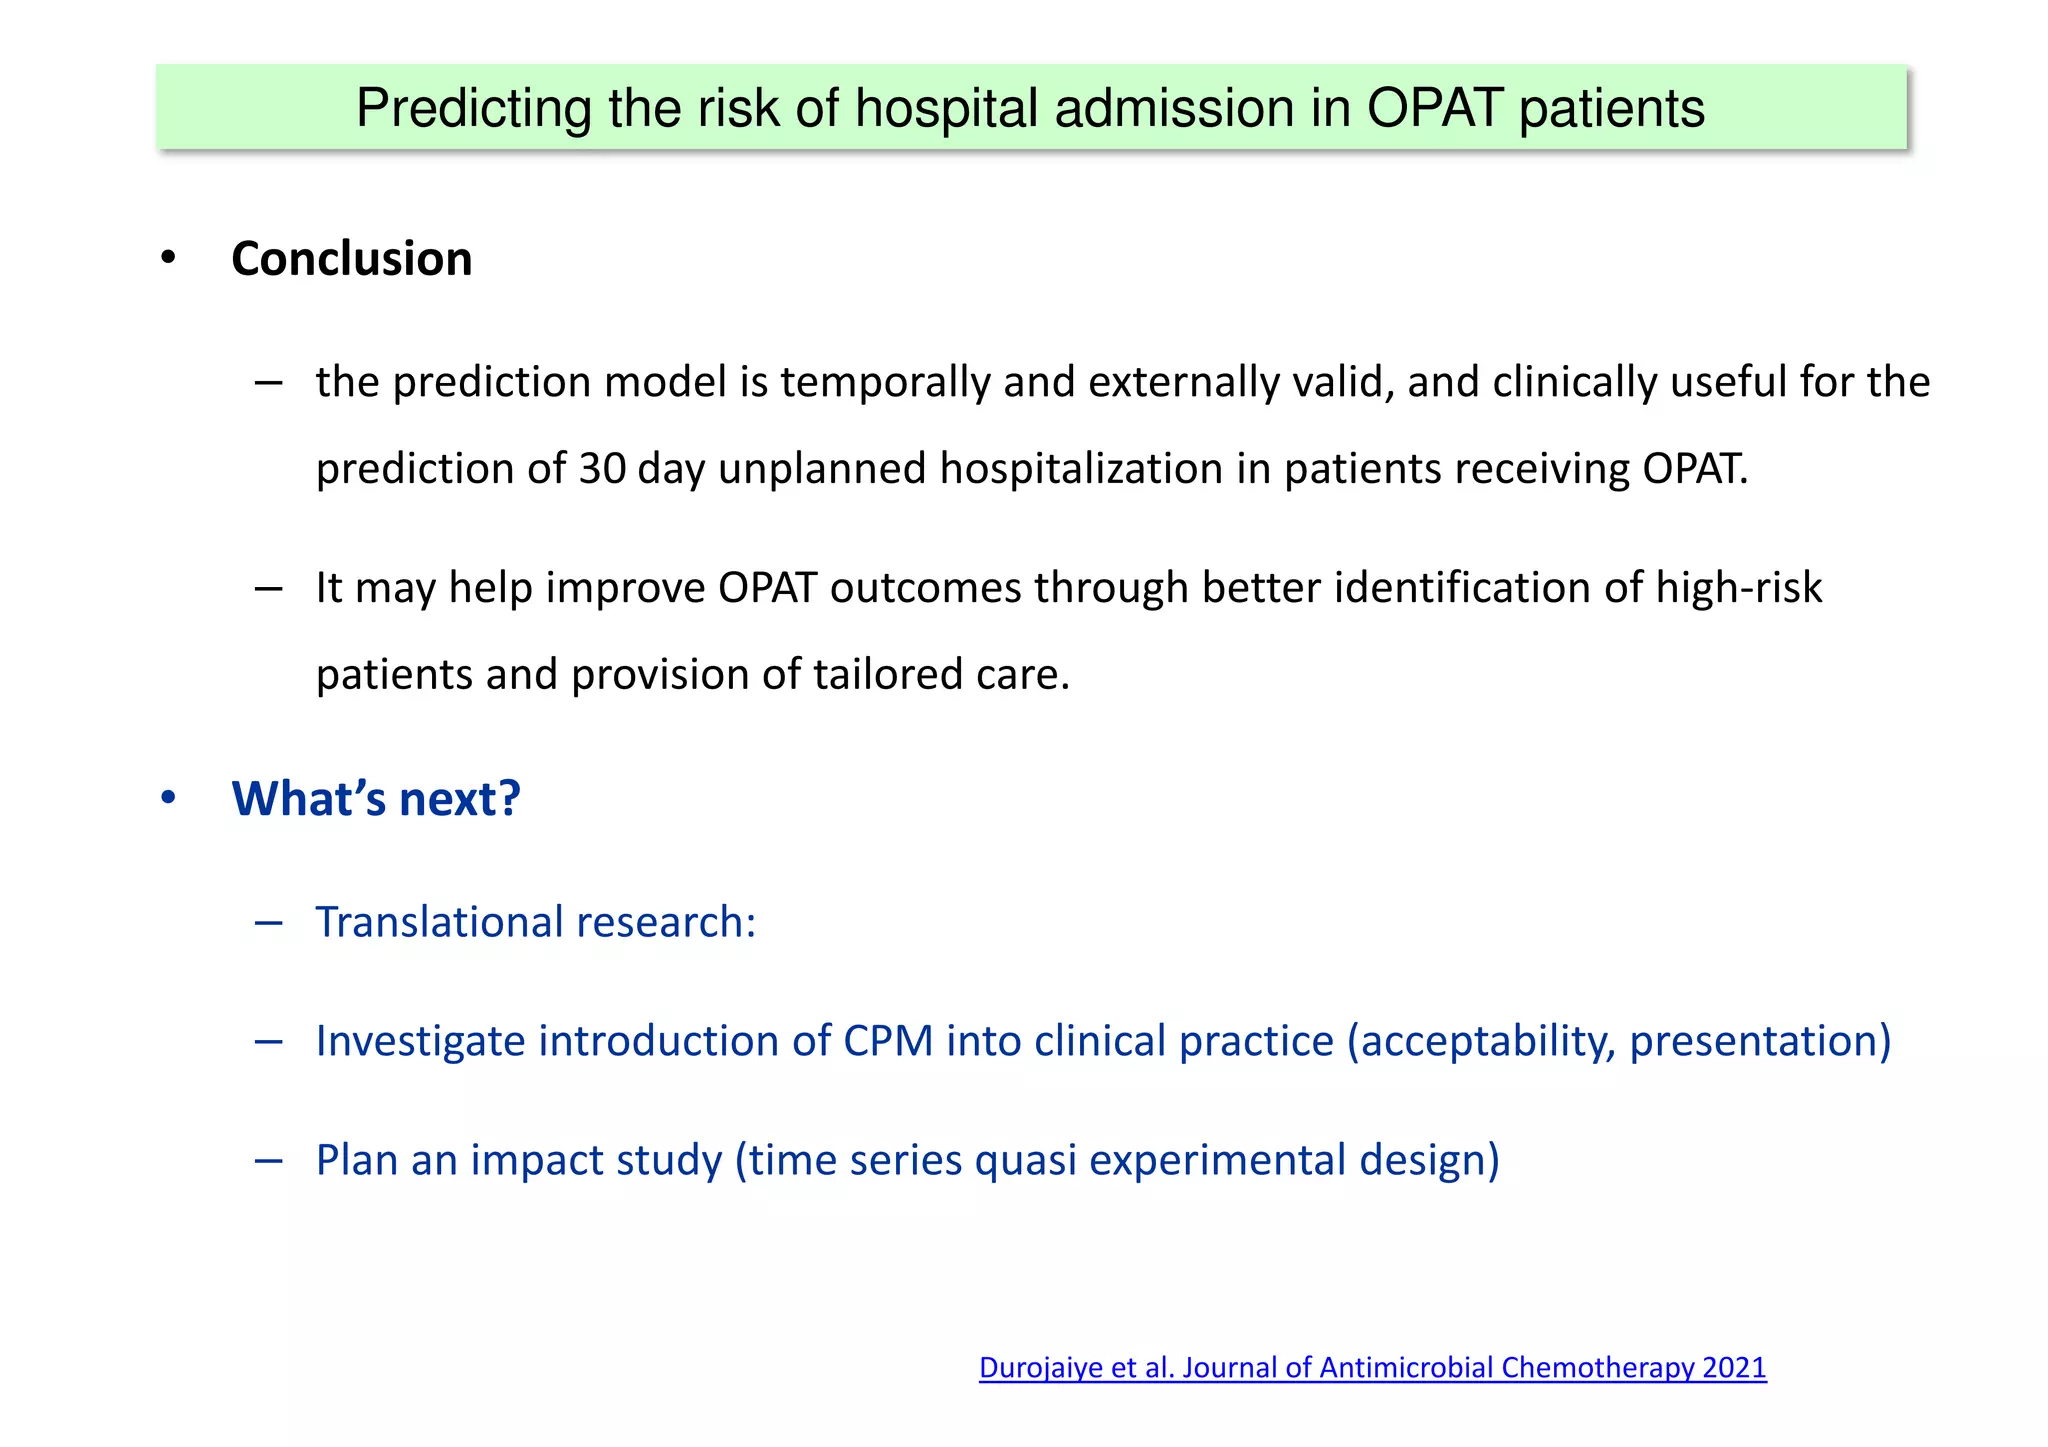


The document discusses the development and validation of clinical prediction models (CPMs) aimed at improving infection prevention and treatment. Key topics include the distinction between explanation and prediction, the importance of calibration, overfitting, and the necessity for appropriate model validation through internal and external methods. An example from applied research predicting hospital admissions in outpatient parenteral antimicrobial therapy is provided to illustrate the practical implications of CPMs.