Downloaded 266 times

![coord_map
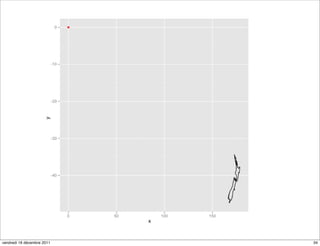
library("maps")
map <- map("nz", plot=FALSE)[c("x","y")]
m <- data.frame(map)
n <- qplot(x, y, data=m, geom="path")
n
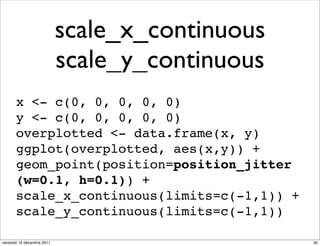
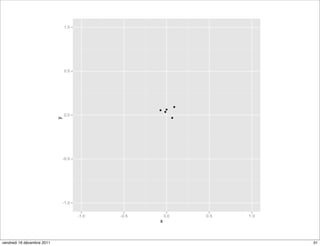
d <- data.frame(c(0), c(0))
n + geom_point(data = d, colour = "red")
vendredi 16 décembre 2011 33](https://image.slidesharecdn.com/ggplot2introduction-111215171435-phpapp02/85/Introduction-to-ggplot2-33-320.jpg)
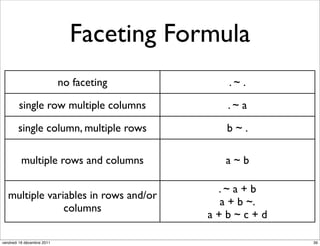

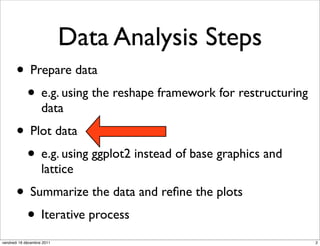
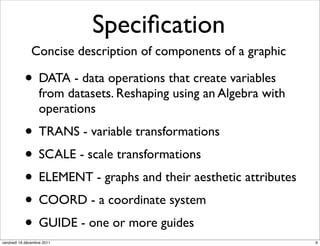
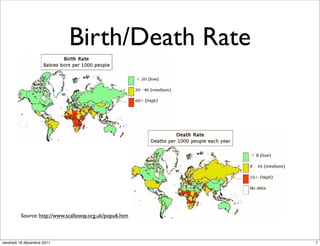
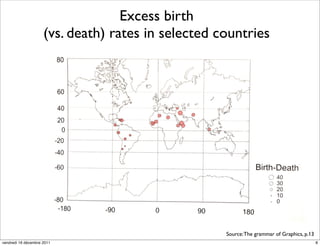
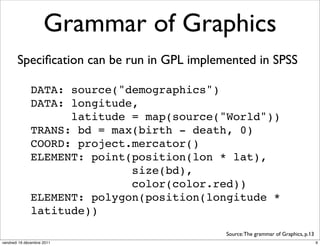
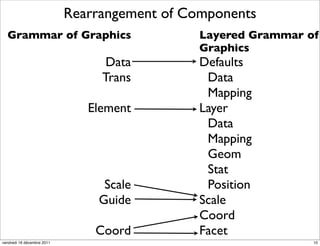
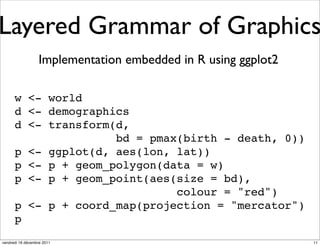
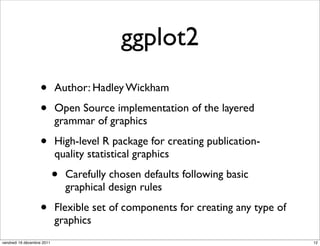
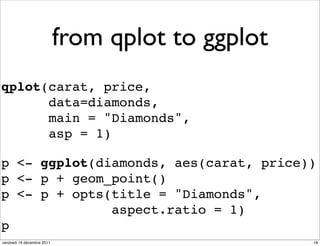
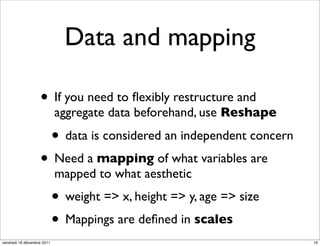
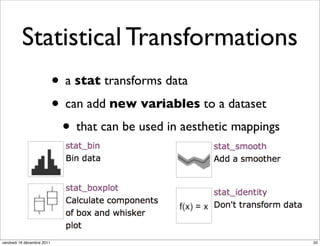
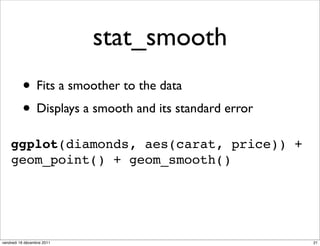
The document discusses ggplot2, a grammar of graphics plotting package for R. It introduces key concepts of ggplot2 including the layered grammar of graphics model and its components. These components - data, aesthetic mappings, statistical transformations, geometric objects, scales, coordinates, and faceting - provide flexibility to build complex plots from data. The document provides examples using ggplot2 to visualize birth and death rate data and explore the diamonds dataset.


![[Week10] R graphics](https://cdn.slidesharecdn.com/ss_thumbnails/week10rgraphics-150224230109-conversion-gate02-thumbnail.jpg?width=640&height=640&fit=bounds)
![[week11] R_ggmap, leaflet](https://cdn.slidesharecdn.com/ss_thumbnails/datadesigner-r-07-150923032312-lva1-app6891-thumbnail.jpg?width=640&height=640&fit=bounds)