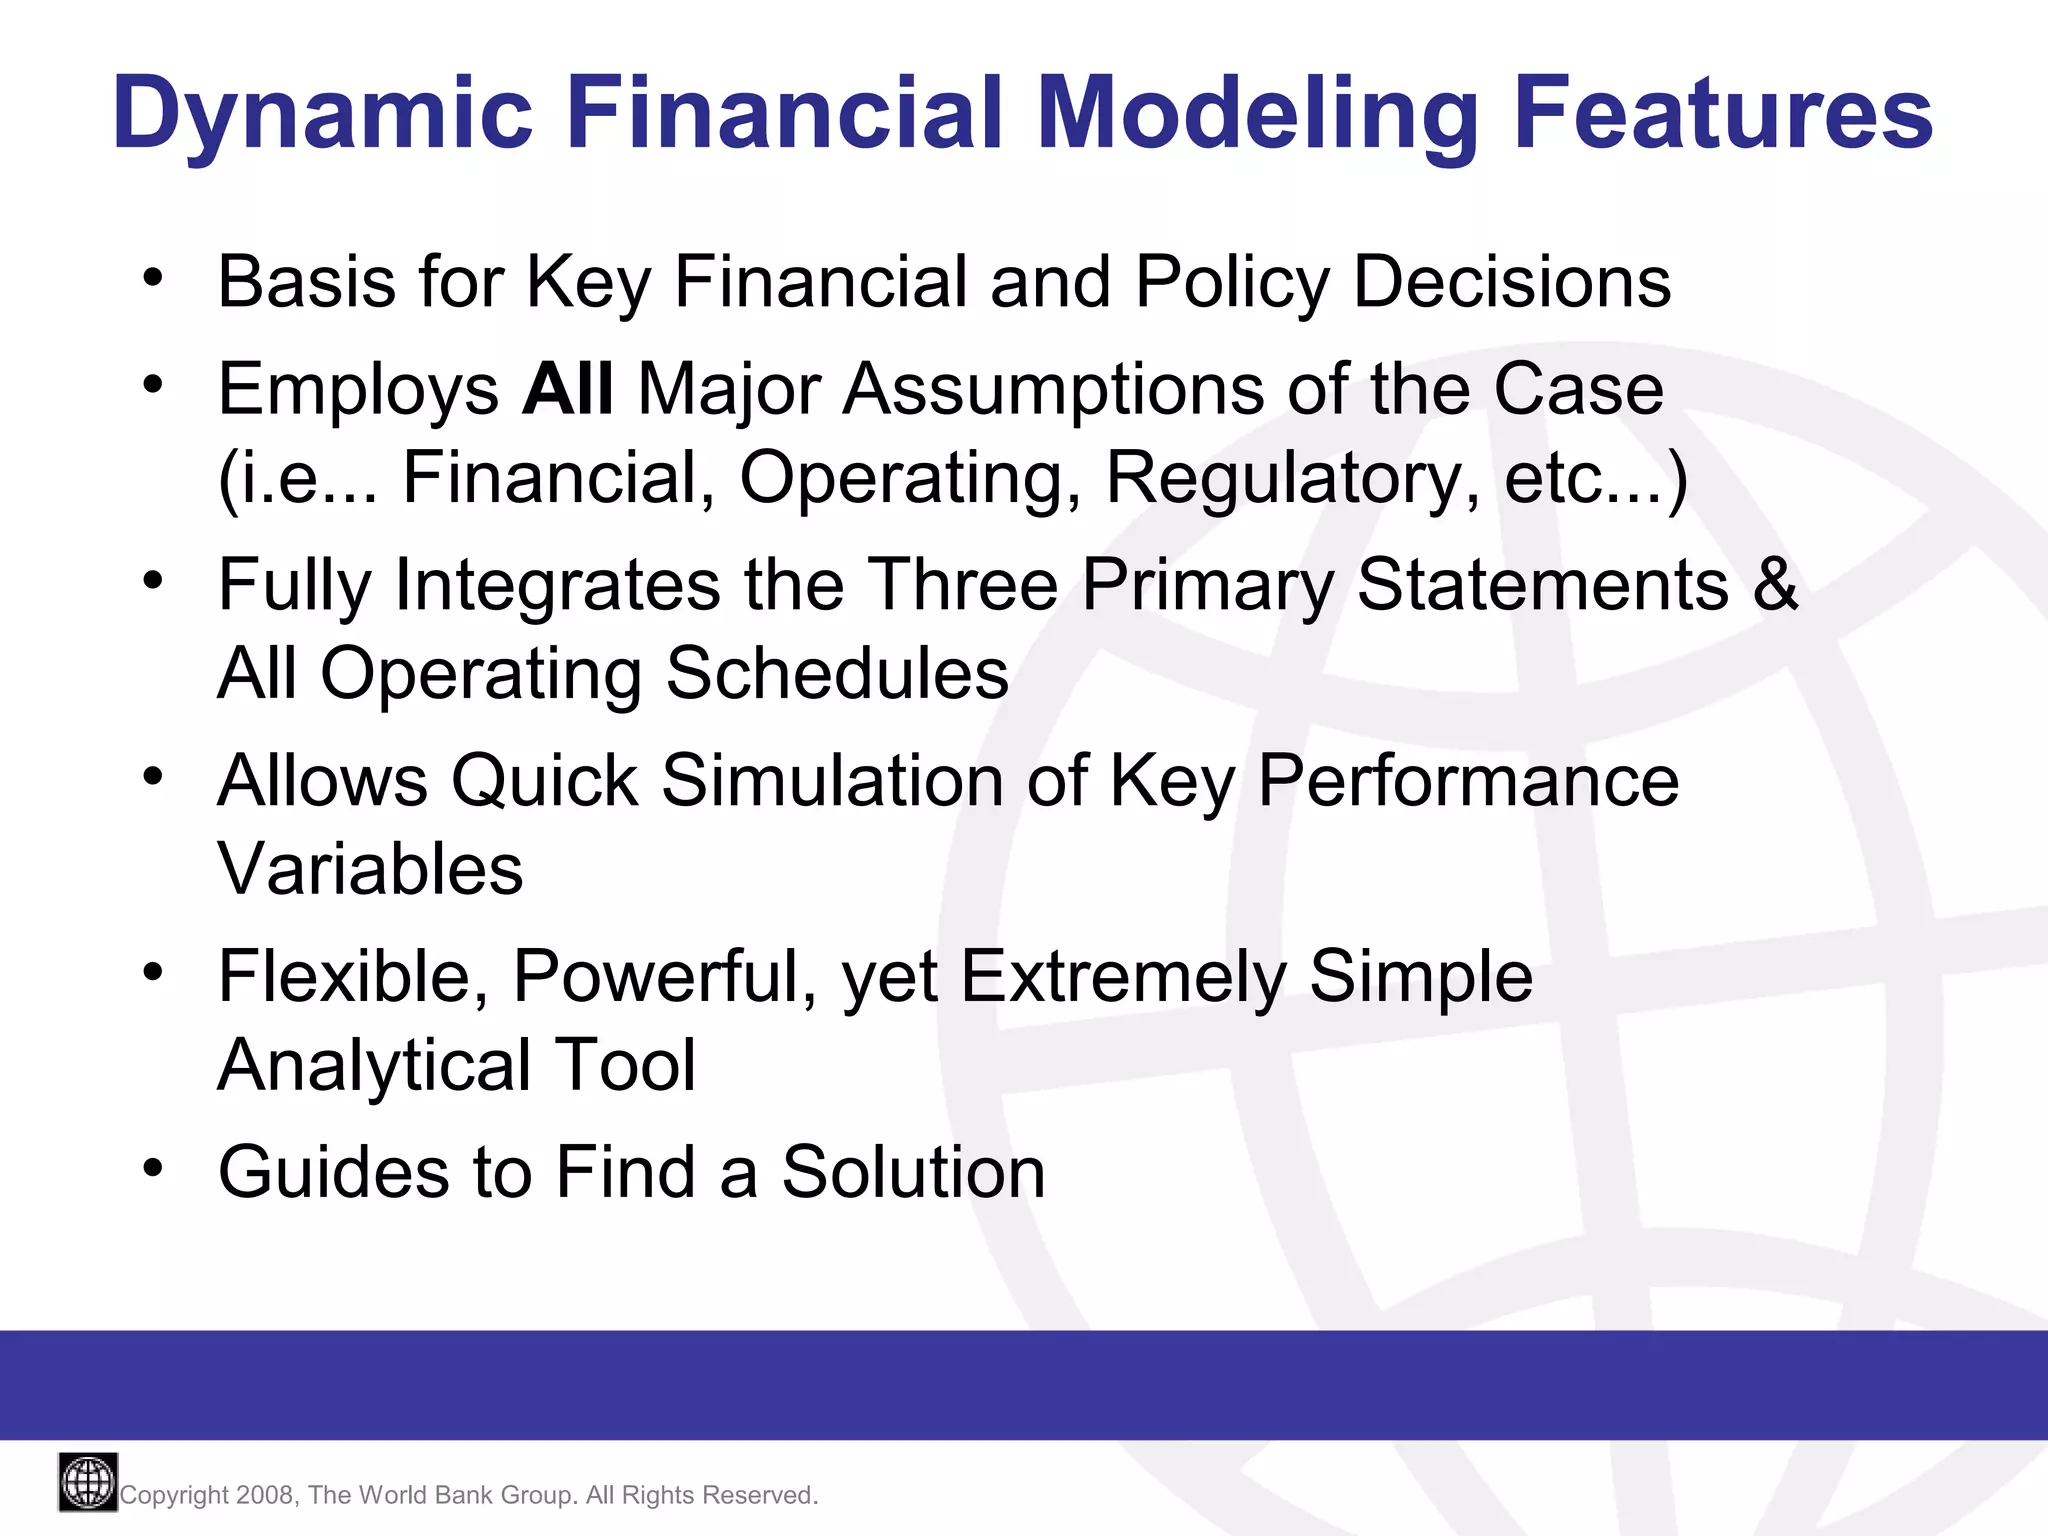
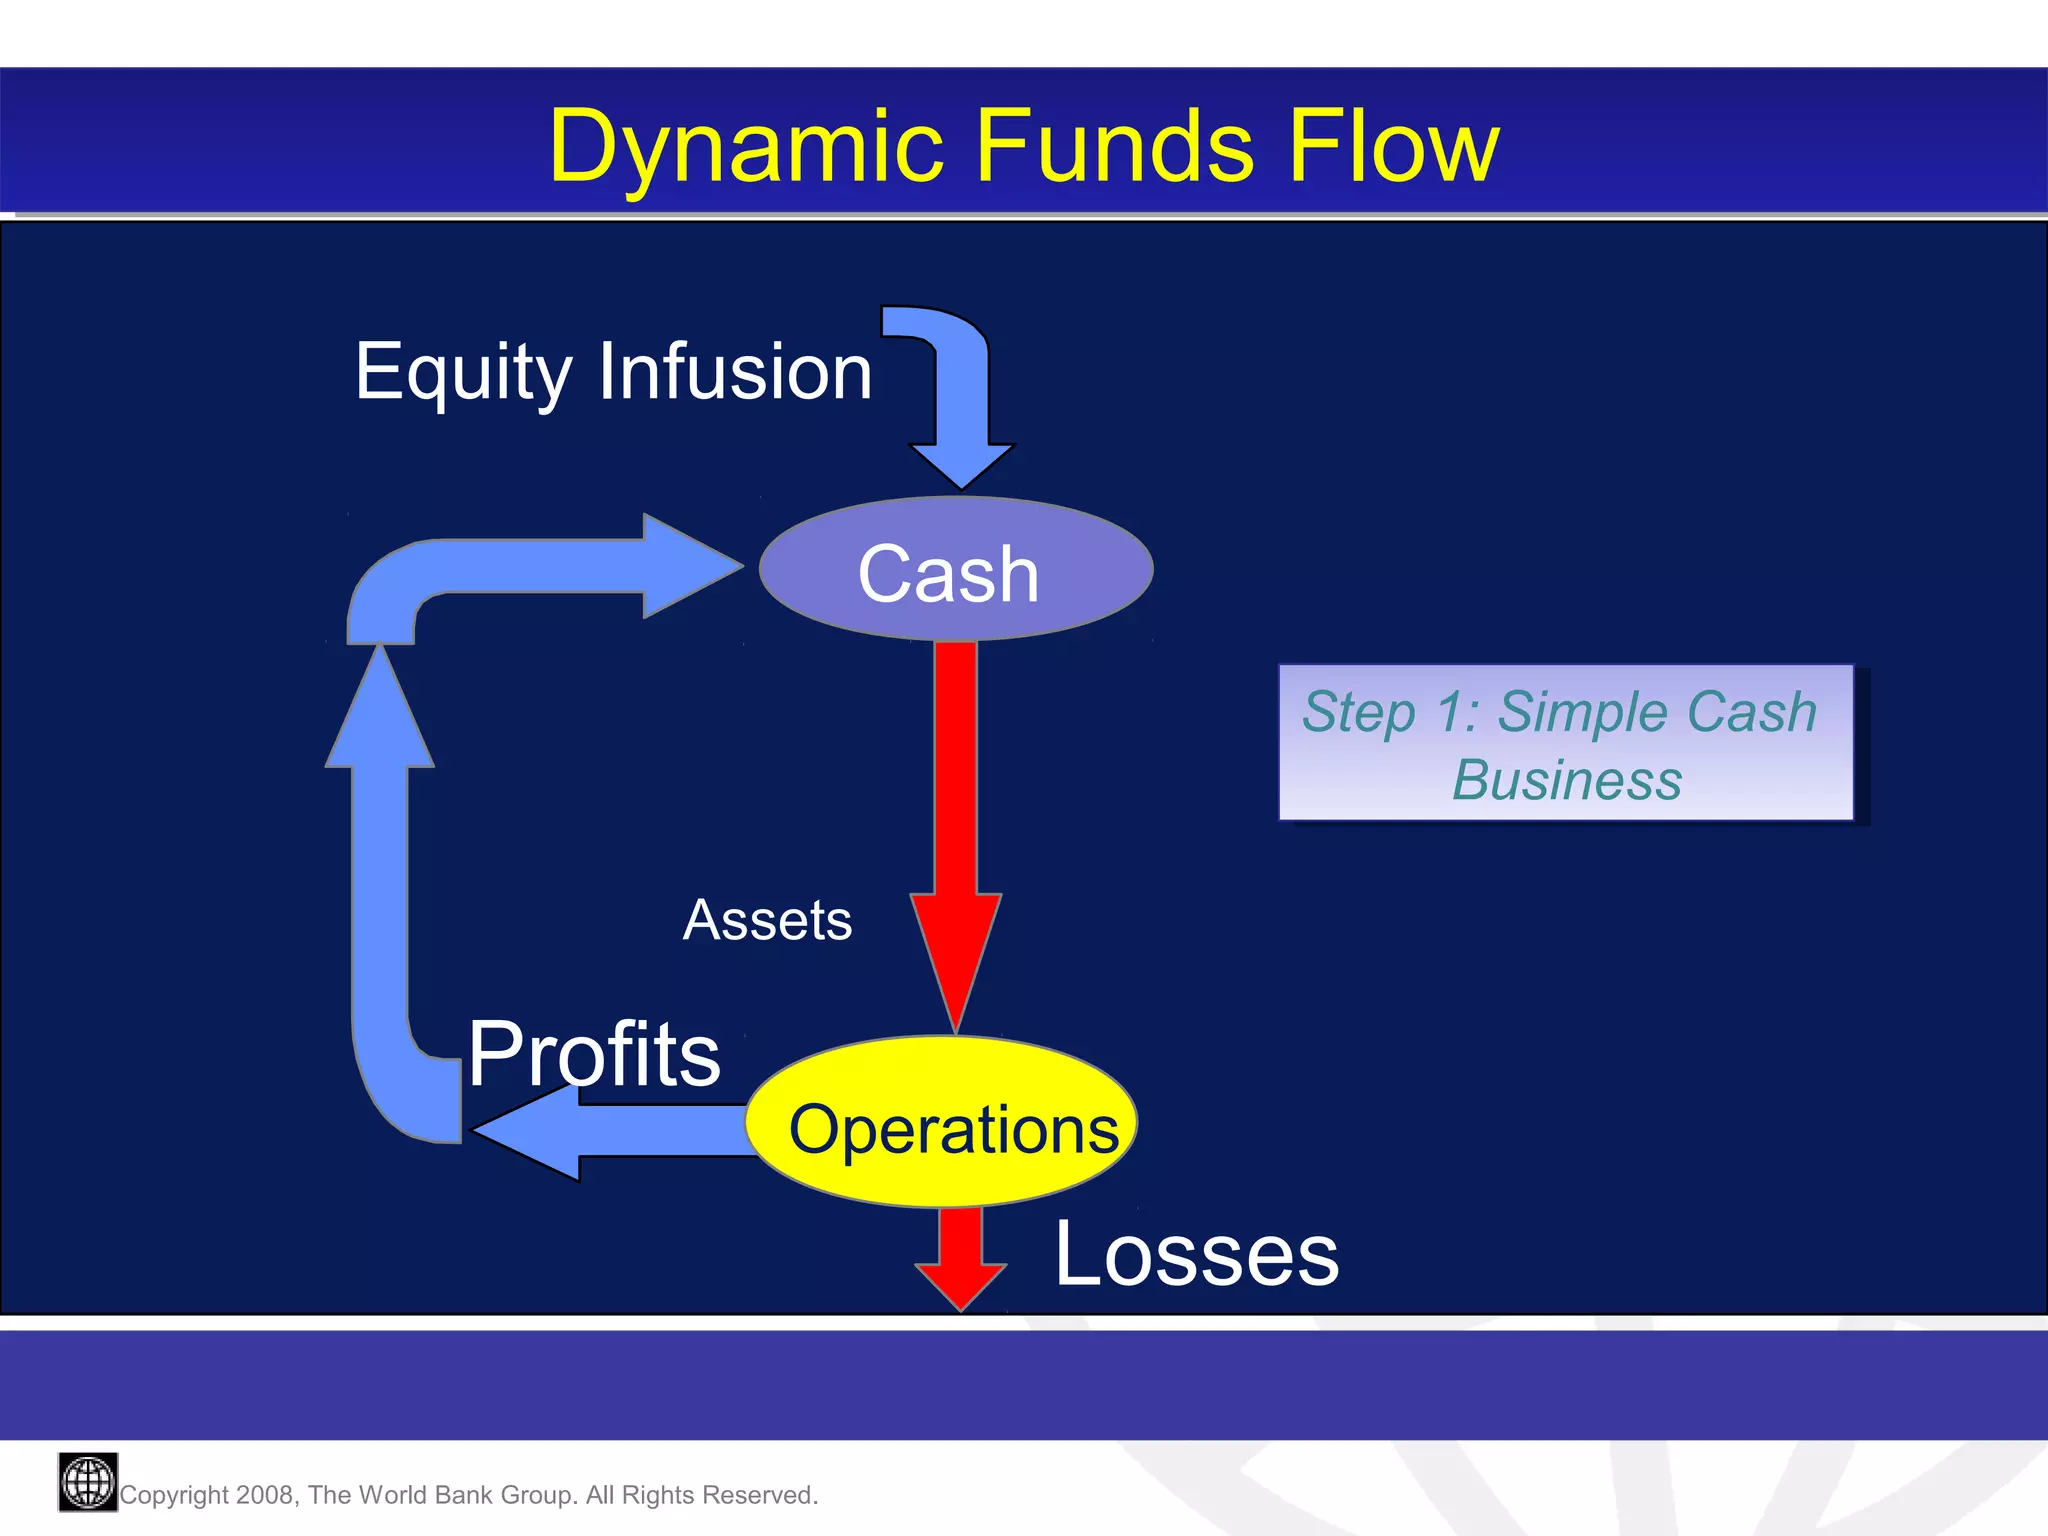
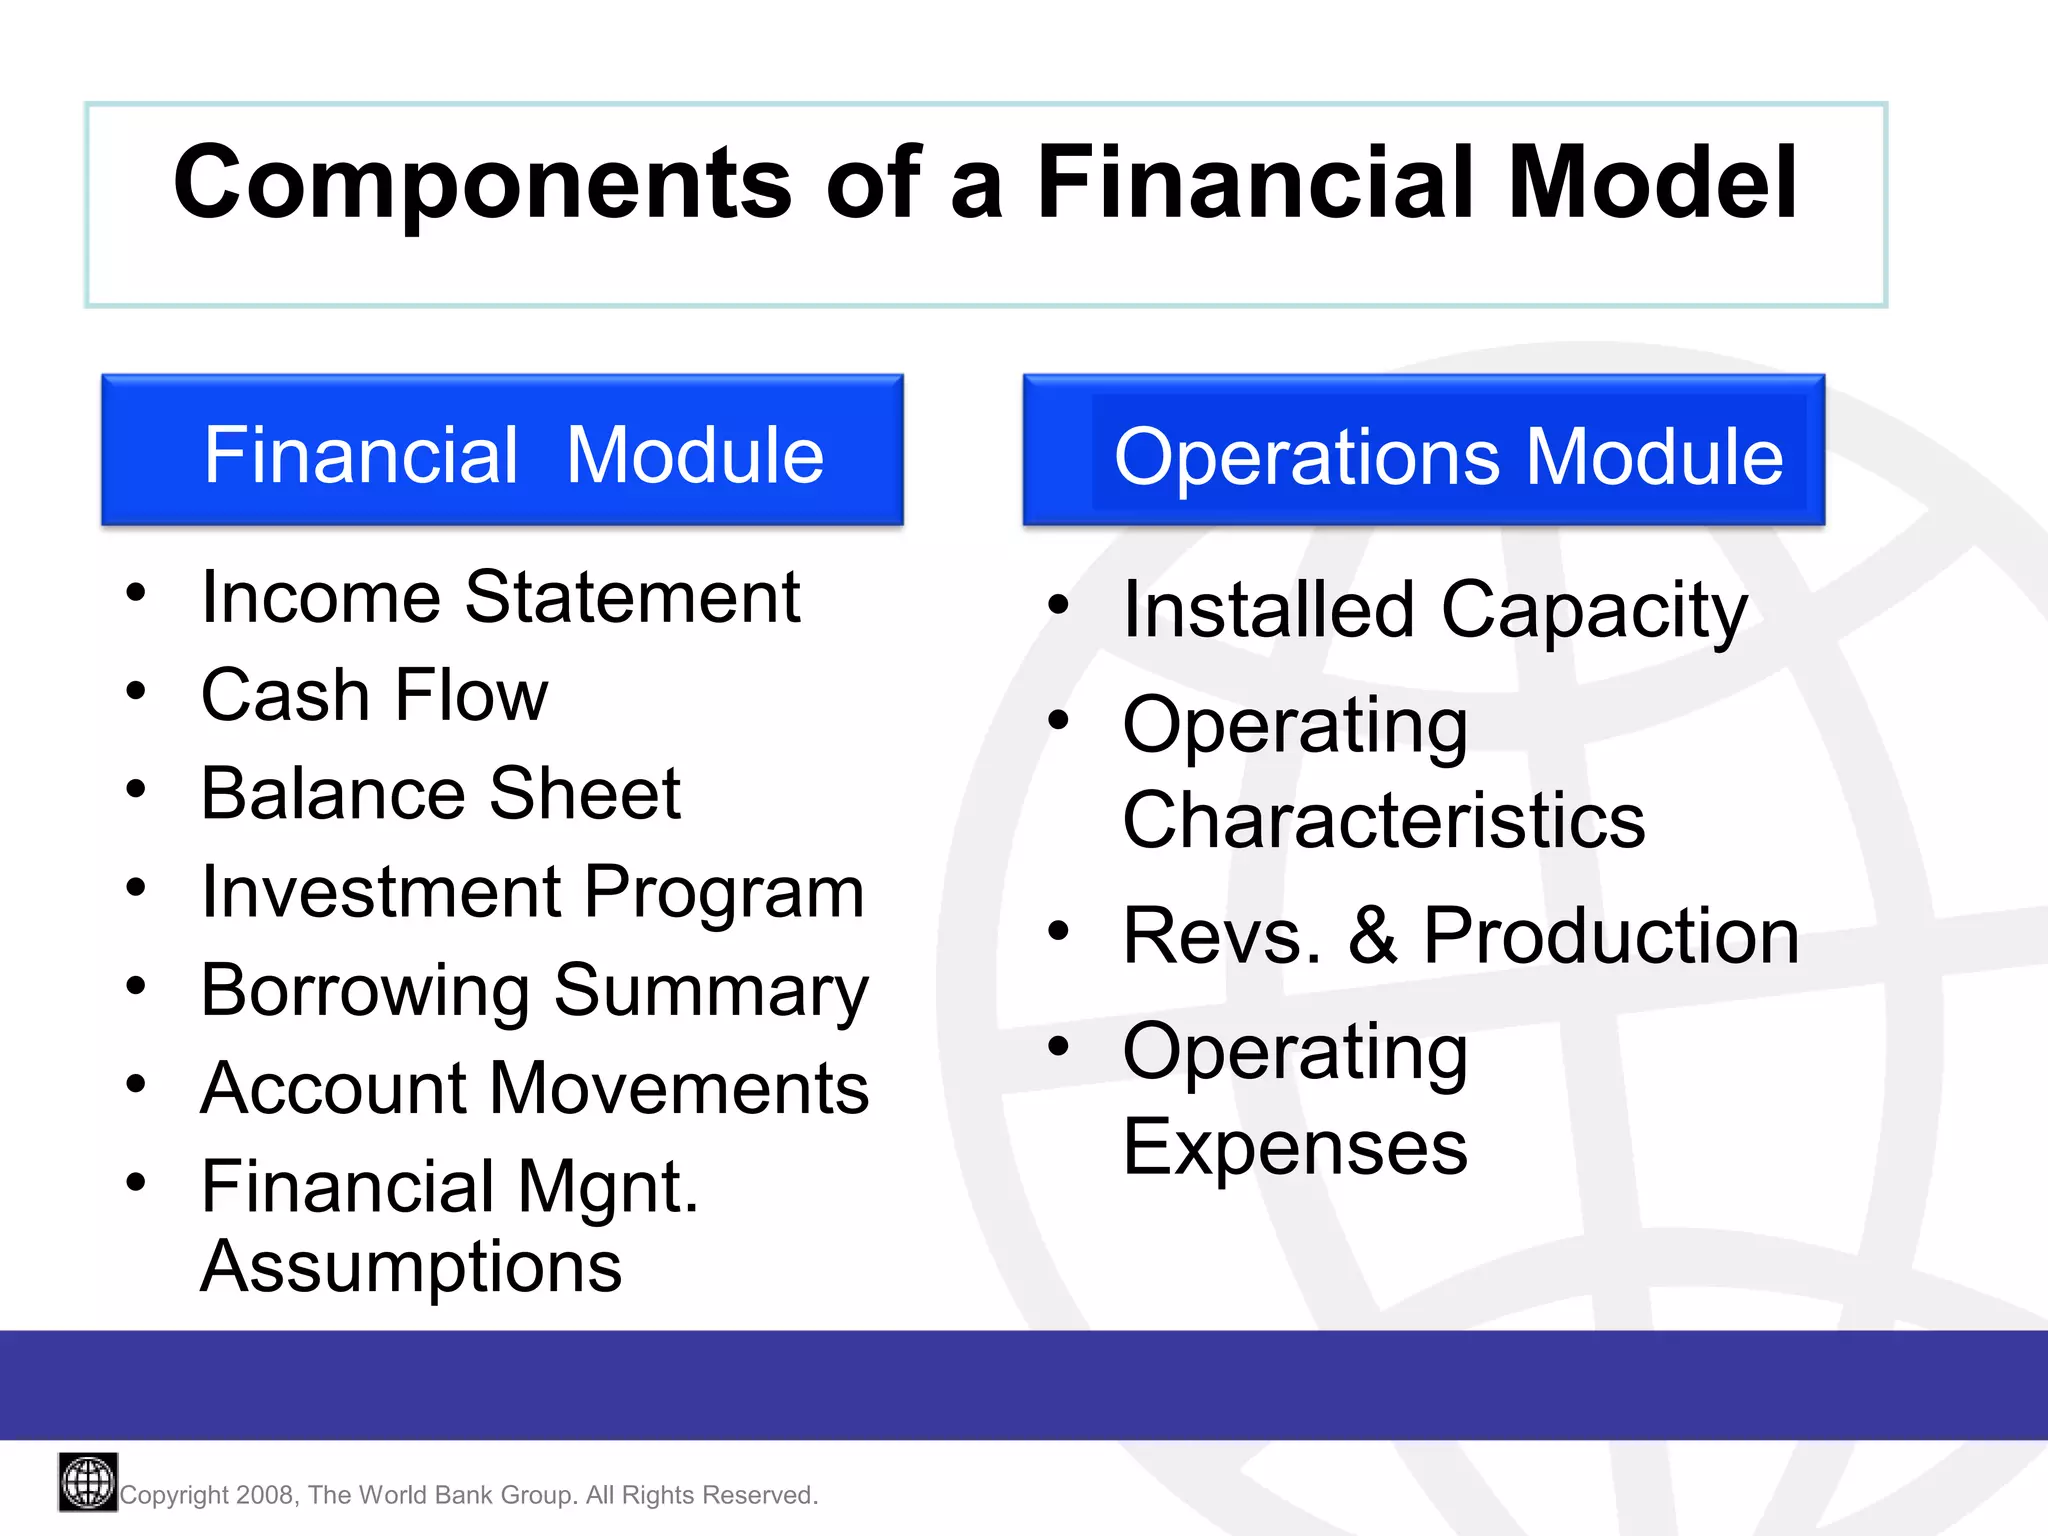
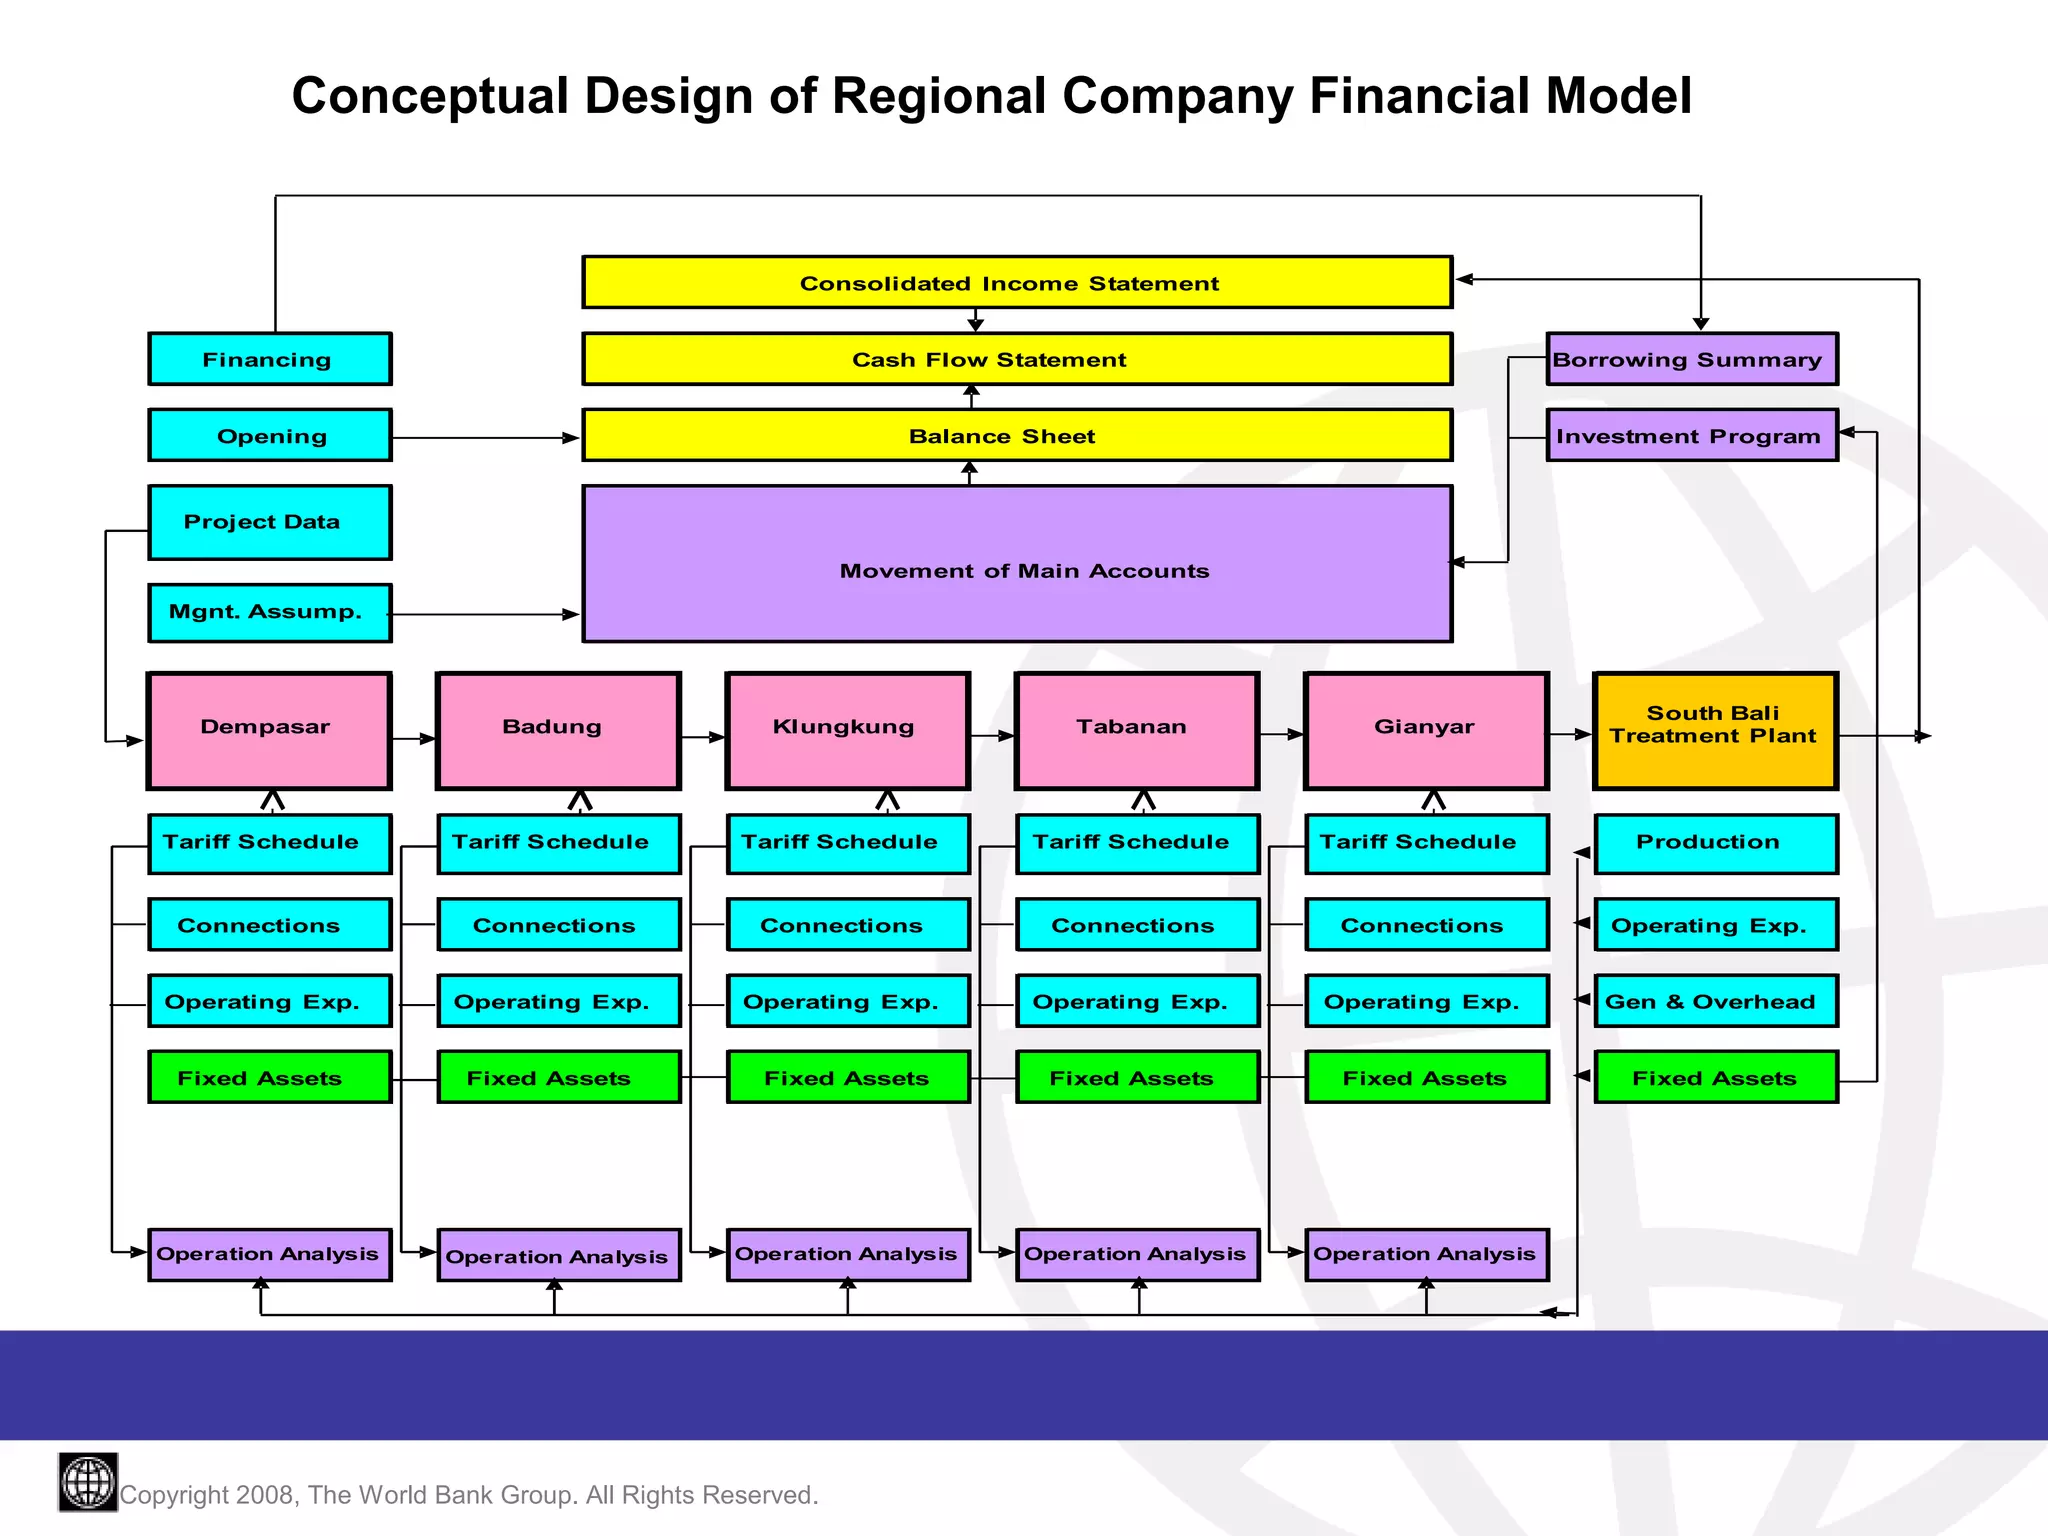
2. Static vs. Dynamic
The “static approach” develops a set of key
assumption that have one output,
irrespective of whether it may or may not
be realistically attainable.
Copyright 2008, The World Bank Group. All Rights Reserved.
2
3. Static vs. Dynamic
The dynamic approach assesses the
interaction of all essential variables such
as, technical, institutional and financial
and derives a solution within the current
political economy and that important
trade-offs between objectives that may be
in conflict.
Copyright 2008, The World Bank Group. All Rights Reserved.
4. Dynamic Financial Modeling Features
• Basis for Key Financial and Policy Decisions
• Employs All Major Assumptions of the Case
(i.e... Financial, Operating, Regulatory, etc...)
• Fully Integrates the Three Primary Statements &
All Operating Schedules
• Allows Quick Simulation of Key Performance
Variables
• Flexible, Powerful, yet Extremely Simple
Analytical Tool
• Guides to Find a Solution
Copyright 2008, The World Bank Group. All Rights Reserved.
5. Dynamic Funds Flow
Dynamic Funds Flow
Equity Infusion
Cash
Step 1: Simple Cash
Step 1: Simple Cash
Business
Business
Assets
Profits
Operations
Operations
Losses
Copyright 2008, The World Bank Group. All Rights Reserved.
6. Dynamic Funds Flow
Equity Infusion
Dividends Paid
Purchase
Receivables
Sale
Cash
Inventories
Assets
Profits
Taxes
Operations
Operations
Sales
Copyright 2008, The World Bank Group. All Rights Reserved.
Losses
Step 2: Expanding
Step 2: Expanding
Operations
Operations
7. Dynamic Funds Flow
Equity Infusion
Dividends Paid
Retained
Receivables
Bad Debts
Purchase
Collections
Sale
Cash
Inventories
Assets
Profits
Operations
Operations
Sales
Losses
Taxes
Copyright 2008, The World Bank Group. All Rights Reserved.
Debt
Step 3: Extending
Step 3: Extending
Credit & Marketing
Credit & Marketing
8. Dynamic Funds Flow
Dividends Paid
Equity Infusion
Retained
Cash
Receivables
Trade Credit
Sale
Purchase
Collections
Assets
Profits
Inventories
Interest
Debt Service
Operations
Operations
Sales
Losses
Taxes
Bad Debts
Copyright 2008, The World Bank Group. All Rights Reserved.
Debt
Step 4:
Step 4:
Raising &
Raising &
Servicing
Servicing
Debt
Debt
9. Essentially a Giant Puzzle!!
But there’s
redemption from
all this madness!
Copyright 2008, The World Bank Group. All Rights Reserved.
9
11. Components of a Financial Model
Financial Module
•
•
•
•
•
•
•
Income Statement
Cash Flow
Balance Sheet
Investment Program
Borrowing Summary
Account Movements
Financial Mgnt.
Assumptions
Copyright 2008, The World Bank Group. All Rights Reserved.
Operations Module
• Installed Capacity
• Operating
Characteristics
• Revs. & Production
• Operating
Expenses
12. Conceptual Design of Regional Company Financial Model
Consolidated Income Statement
Financing
Cash Flow Statement
Opening
Borrowing Summary
Balance Sheet
Investment Program
Project Data
Movement of Main Accounts
Mgnt. Assump.
Badung
Klungkung
Tabanan
Tariff Schedule
Tariff Schedule
Tariff Schedule
Tariff Schedule
Tariff Schedule
Production
Connections
Connections
Connections
Connections
Connections
Operating Exp.
Operating Exp.
Operating Exp.
Operating Exp.
Operating Exp.
Operating Exp.
Gen & Overhead
Fixed Assets
Fixed Assets
Fixed Assets
Fixed Assets
Fixed Assets
Fixed Assets
Operation Analysis
Operation Analysis
Operation Analysis
Operation Analysis
Operation Analysis
Copyright 2008, The World Bank Group. All Rights Reserved.
Gianyar
South Bali
Treatment Plant
Dempasar
13. Xiaolangdi Multipurpose Dam Project, Phase II
Cost Allocation Table
Power Unit
Capital Investment Costs
Water Supply
F&S Control
Consolidated
37.0%
29.0%
31.0%
97.0%
100.0%
0.0%
0.0%
100.0%
Wages
54.4%
17.9%
27.7%
100.0%
Other Direct Costs
54.4%
17.9%
27.7%
100.0%
Works Maintenance
44.2%
21.8%
34.0%
100.0%
Operating Costs:
Materials Cost
Reservoir Maintenance
Overhead
Sales & Miscellaneous
Administrative Expenses
Bad Debt Expense
100.0%
0.0%
0.0%
100.0%
54.4%
17.9%
27.7%
100.0%
100.0%
0.0%
0.0%
100.0%
54.4%
17.9%
27.7%
100.0%
0.0%
100.0%
0.0%
100.0%
Depreciation Expense
26.0%
29.0%
45.0%
100.0%
FX Loans Losses
26.0%
29.0%
45.0%
100.0%
Interest Charges
26.0%
29.0%
45.0%
100.0%
100.0%
0.0%
0.0%
100.0%
Income Taxes
Copyright 2008, The World Bank Group. All Rights Reserved.
14. Industrial Free Zone
Total Site Size
Site Size (m2)
Allowance for Green Area
for Industrial Lots (m2)
Total Developed Area
of Which: Developer will Build Factories
of Which: Tenant Will Build Factories
Total Leaseable Area
of Developer Factory Buildings
of Industrial Lots
Breakdown of Industrial Lots by Activity
for Free Trade Zone Area
for Gaza Industrial Park Area
Breakdown of Factory Buildings by Activity
for Free Trade Zone Area
for Gaza Industrial Park Area
Occupancy Rates
Allocation
1997
1998
1999
2000
2001
472000
70.00%
330400
63.00%
37.00%
288770
80.00%
100.00%
122248
40.00%
60.00%
166522
38.00%
62.00%
for Factories
for Industrial Lots
Copyright 2008, The World Bank Group. All Rights Reserved.
m2
472000
Completion Schedule
0.00%
90.00%
26.00%
100.00%
58.00%
100.00%
100.00%
100.00%
100.00%
100.00%
0
110023
43296
122248
96583
122248
166522
122248
166522
122248
44009
66014
48899
73349
48899
73349
48899
73349
48899
73349
0
0
16452
26843
36701
59881
63278
103243
63278
103243
330400
208152
122248
288770
166522
122248
122248
48899
73349
166522
63278
103243
0.00%
75.00%
50.00%
95.00%
75.00%
95.00%
95.00%
95.00%
95.00%
95.00%
0.00%
50.00%
15. Water District
Water Consumption & Sales
Opening Consumption
Total Consumption
35,884
1996
Total Water Sales (P000)
1995
1997
1998
1999
2000
469,240
539,626
633,295
692,824
705,434
26,661,374
30,660,580
35,982,644
39,365,012
40,081,455
Total Connections
60,368
69,423
81,473
89,132
90,754
Percent Growth
68.2%
15.0%
17.4%
9.4%
1.8%
Growth Factor
1.68
1.93
2.27
2.48
2.53
Commecial Consumption
Annual Sales (P000)
Annual Consumption (m3)
Average Usage/Connection
Tariff/m3
Number of Connections
Percent Commercial
184,206
211,837
248,607
271,976
276,926
10,466,242
12,036,178
14,125,418
15,453,207
15,734,456
1.90
1.90
1.90
1.90
1.90
17.60
17.60
17.60
17.60
17.60
15,092
17,356
20,368
22,283
22,688
25%
25%
25%
25%
25%
Residential Consumption
Annual Sales (P000)
Annual Consumption (m3)
Average Usage/Connection
Tariff/m3
Number of Connections
Percent Residential
Copyright 2008, The World Bank Group. All Rights Reserved.
285,034
327,789
384,687
420,848
428,507
16,195,132
18,624,402
21,857,226
23,911,805
24,347,000
0.980
0.980
0.980
0.980
0.980
17.60
17.60
17.60
17.60
17.60
45,276
52,067
61,105
66,849
68,065
75%
75%
75%
75%
75%
16. Organizing Your Model
Key Considerations
•
•
•
•
Who’s Perspective
Currency Risk
Profit Cost/Centers
Implementation Stages
Copyright 2008, The World Bank Group. All Rights Reserved.
17. Some Useful Tips
• Use a Standard Template for All Models
• Years in Columns, Accounts/Categories in Rows
• Don’t Cut Corners (worksheets
schedules
statements)
• Put all The Output Statements in One Sheet (pass
protect)
• Customize Operating Module (Brainstrom)
• Combine Operating Assumptions with Results in
Schedules (color code).
• Use the movement of Accounts Schedule to Link to
Statements
Copyright 2008, The World Bank Group. All Rights Reserved.
17
18. How I Organize Models.
•
•
•
•
•
•
•
•
•
Title
Project Data Sheet
Opening Balance Sheet
Management Assumptions
Demand, Production & Operations
Investment (CAPEX) Program
Financing Options
Output Statements
Rate of Return Calculations
Copyright 2008, The World Bank Group. All Rights Reserved.
18
21. Management Assumptions
2010
Cash Position
Provision for Bad Debt
Power Accounts Receivable
Inventories
Other Current Assets
Interest Earned
Short Term Borrowings
Accounts Payable
Tax on Interest
2011
2012
2013
2014
0.7
1%
1.2
0.5
50.0
6%
2.0
2.0
2.0
0.065
0.065
0.065
0.3
Interest Payable
Income Taxes
0.7
1%
1.2
0.5
60.0
5%
0.065
Taxes Payable
0.7
1%
1.2
0.5
60.0
5%
2.1
Customer Deposits
0.7
1%
1.2
0.5
60.0
5%
1
0.3
0.3
1
20%
Copyright 2008, The World Bank Group. All Rights Reserved.
1
20%
0.065 Amount per New Sercice Connection
0.3 0.3
1
20%
0.7 Months of Operating Expenses
1% On Oustanding Receivables
1.2 Months of Annual Revenues
0.5 Months of Operating Expenses
60.0 Days of Operating Expenses
5% Earned on Short-Term Deposits
Percent of CAPEX
2.0 Months of Operating Expenses
1
20%
Months of Income Tax Chage
Months of Interest Expense
20% On Profit Before Taxes
21
22. Demand, Production & Operation
Copyright 2008, The World Bank Group. All Rights Reserved.
22
28. Focus on The Fund Flow Statement
• Non-Conventional Format to Simulate Decision
Making of the CFO
• Incorporates a Financing Logic
• Incorporates Inherent Desirability of Investments
• Point of Reference Where Solution is Attained
Copyright 2008, The World Bank Group. All Rights Reserved.
29. 1st Priority
2nd Priority
3rd Priority
4th Priority
5th Priority
Copyright 2008, The World Bank Group. All Rights Reserved.
29
31. Common Mistakes
1.
2.
The model becomes the End Goal, not the financial results
Tries to do too many things, tariff structure, trend analysis,
volume forecasts, demand elasticity
3. Not properly organized
4. Cutting corners
5. Detailed breakdown/elaboration on non material variables
6. Requiring inordinate amounts of data
7. Add historical presentation to projections
8. Goal seek for an independent variable
9. Investment and projection period
10. Escalating revenues with expenses
11. Accumulating cash
12. Linking to other workbooks
Copyright 2008, The World Bank Group. All Rights Reserved.