The document discusses presenting financial statements clearly through balance sheets, current financial reports, forecasts, and dynamic models. It provides tips for each:
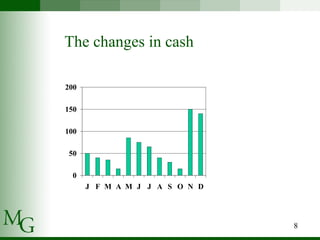
1) For balance sheets, focus on liquidity, changes in cash, timing of assets/liabilities, and key line items and ratios.
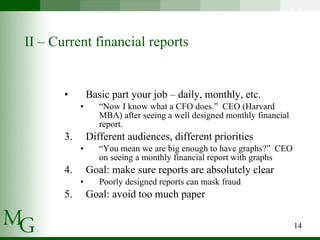
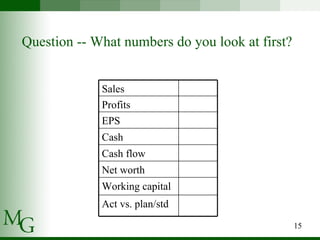
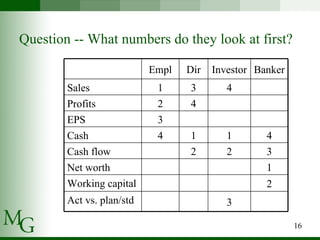
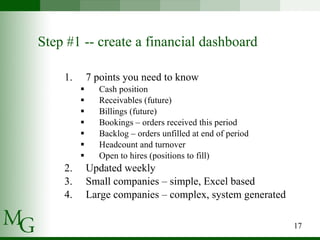
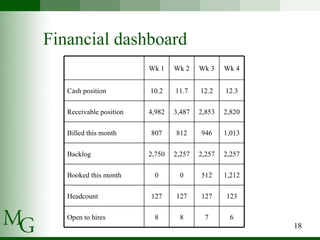
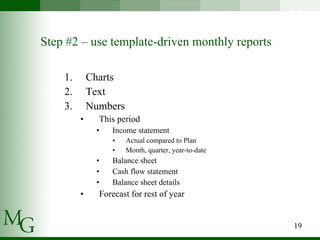
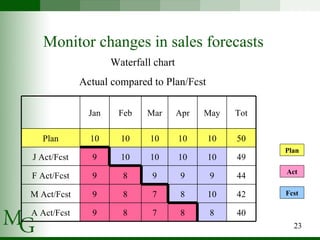
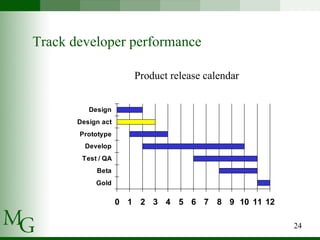
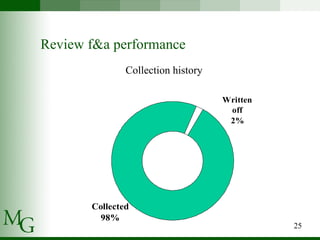
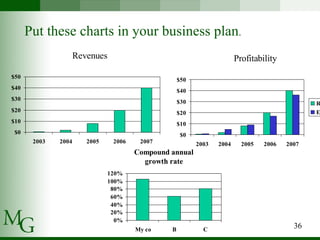
2) Current reports should include a financial dashboard and template-driven monthly reports with relevant charts.
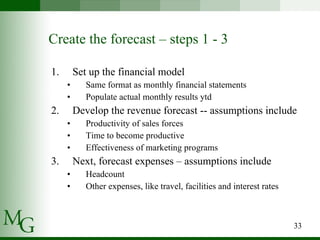
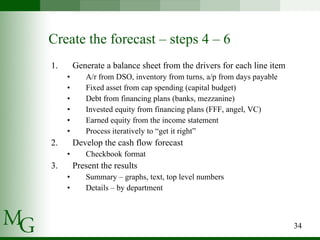
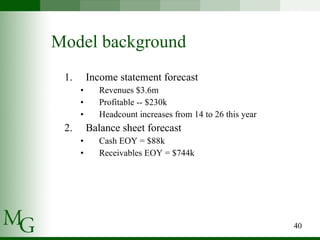
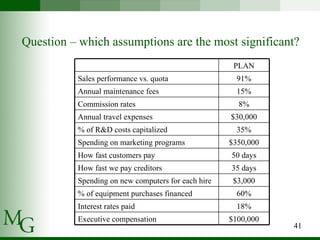
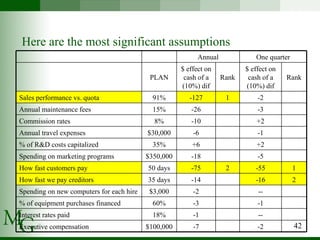
3) Forecasts should answer "what if" questions and have the same format as reports, with assumptions driving the model.
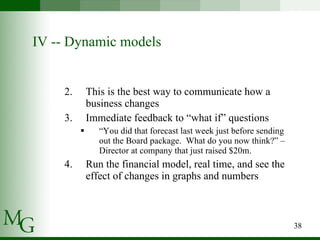
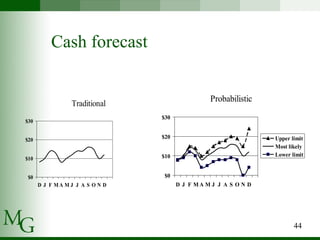
4) Dynamic models allow real-time analysis of changes and are best for communicating forecast updates.