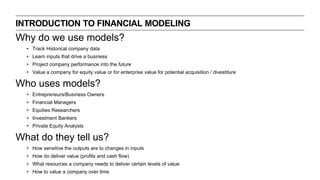
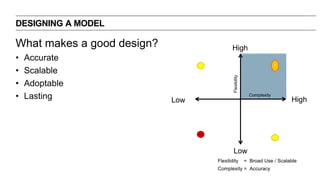
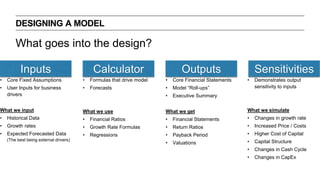
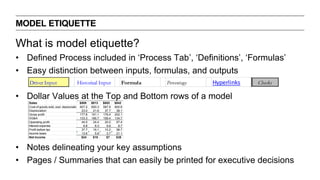
INTRODUCTION
TO FINANCIAL
MODELING
Kevin Crosby, Business Strategist
and Sr. Mgr of Procurement for Amazon Canada Consumer Electronics
AGENDAAGENDA
‣ Introduction to Financial Modeling
‣ Financial Model Design and Etiquette
‣ Key Financial Terms and Ratios
‣ Introduction to Case Study
‣ Building a Financial Model 101
‣ Closing and Q&A
Why do we use models?
• Track Historical company data
• Learn inputs that drive a business
• Project company performance into the future
• Value a company for equity value or for enterprise value for potential acquisition / divestiture
Who uses models?
• Entrepreneurs/Business Owners
• Financial Managers
• Equities Researchers
• Investment Bankers
• Private Equity Analysts
What do they tell us?
• How sensitive the outputs are to changes in inputs
• How do deliver value (profits and cash flow)
• What resources a company needs to deliver certain levels of value
• How to value a company over time
INTRODUCTION TO FINANCIAL MODELING
MODEL DESIGN
AND
ETIQUETTE
INTRODUCTION TO FINANCIAL MODELING
What makes a good design?
• Accurate
• Scalable
• Adoptable
• Lasting
DESIGNING A MODEL
HighLow
Complexity
High
Flexibility
Low
?
Flexibility = Broad Use / Scalable
Complexity = Accuracy
What goes into the design?
DESIGNING A MODEL
Inputs Calculator Outputs Sensitivities
• Core Fixed Assumptions
• User Inputs for business
drivers
What we input
• Historical Data
• Growth rates
• Expected Forecasted Data
(The best being external drivers)
• Formulas that drive model
• Forecasts
What we use
• Financial Ratios
• Growth Rate Formulas
• Regressions
• Core Financial Statements
• Model “Roll-ups”
• Executive Summary
What we get
• Financial Statements
• Return Ratios
• Payback Period
• Valuations
• Demonstrates output
sensitivity to inputs
What we simulate
• Changes in growth rate
• Increased Price / Costs
• Higher Cost of Capital
• Capital Structure
• Changes in Cash Cycle
• Changes in CapEx
How do you know what inputs to use and their impact to output?
• Simple, we use history.
• No assumption is going to be 100% right, but we use data to support it.
What ways can you use to extrapolate the future for better assumptions?
• Demand – Market growth rates, size of market, share of market
(3rd party research, top down or bottoms up analysis)
• Input Prices / Costs – 3rd parties, commodities futures, correlation indices
• Impact - Regression of inputs to outputs, correlation matrices
Remember, complexity improves accuracy, but reduces flexibility, scalability, usability
DESIGNING A MODEL
What is model etiquette?
• Defined Process included in ‘Process Tab’, ‘Definitions’, ‘Formulas’
• Easy distinction between inputs, formulas, and outputs
• Dollar Values at the Top and Bottom rows of a model
• Notes delineating your key assumptions
• Pages / Summaries that can easily be printed for executive decisions
MODEL ETIQUETTE
Sales $808 $813 $802 $842
Cost of goods sold, excl. depreciation 607.2 600.3 587.9 600.8
Depreciation 23.0 21.6 37.7 39.1
Gross profit 177.8 191.1 176.4 202.1
SG&A 133.3 166.7 156.4 134.7
Operating profit 44.5 24.4 20.0 67.4
Interest expense 6.8 8.3 9.8 8.7
Profit before tax 37.7 16.1 10.2 58.7
Income taxes 13.6 5.8 3.7 21.1
Net income $24 $10 $7 $38
Driver Input Historical Input Formula Percentage Hyperlinks Checks
KEY FINANCIAL TERMS
AND
RATIOS
INTRODUCTION TO FINANCIAL MODELING
• Income Statement / Profit and (Loss) Statement / (P&L)
• Balance Sheet
• Assets
• Liabilities
• Shareholders Equity
• Assets = Liabilities + Shareholder Equity (Must always be balanced)
• Statement of Cash Flows
• Cash Flow from Operations
• Cash Flow from Investments
• Cash Flow from Financing
• Others Statements (sometimes included)
• Depreciation Schedule
• Working Capital Schedule
• Debt Schedule
KEY FINANCIAL TERMS AND RATIOS
What are the key metrics that we look for in a model?
KEY FINANCIAL TERMS AND RATIOS
HBS Finance
Core Ratios for today
• Growth Rates = Current Revenue / Last Year Revenue -1
• CAGR = (Current Revenue / Revenue 5 Years ago) ^ (1/5) -1
• Accounts Receivable Days = Accounts Receivable / Net Revenue * 365
• Inventory Days = Ending Total Inventory / FY COGS * 365
• Account Payable Days = Accounts Payable / FY COGS * 365
• Other Current Assets as a % of Revenue = Other Current Assets / Net Revenue
• Other Current Liabilities as a % of Revenue = Other Current Liabilities / Net Revenue
KEY FINANCIAL TERMS AND RATIOS
HBS Finance
INTRODUCTION TO
CASE STUDY
INTRODUCTION TO FINANCIAL MODELING
Company Background
A LOCAL ECOMMERCE RETAILER
Disclaimer
The demonstration includes solely public information from the
Amazon.com Financial Statements (www.amazon.com/ir). All
information included reflects no internal view of the company and
only serves as a demo for teaching this class how to model
financial statements.
A LOCAL ECOMMERCE RETAILER
BUILDING THE MODEL
INTRODUCTION TO FINANCIAL MODELING
Step 1: The Blank Model
ed model)
BUILDING THE MODEL
BUILDING THE MODEL
Step 2: Input the Historical Data w/ Formulas
• Income Statement / Profit and (Loss) Statement / (P&L)
• Balance Sheet (Make sure it’s balanced)
• Hint – Use a formula
• Statement of Cash Flows – Check ending balances
• Others Statements (sometimes included)
BUILDING THE MODEL
Step 3: Forecast your Drivers
• Use historical ratios and growth rates to forecast future drivers
• Use External data to drive units (if you need them)
• Key Ratios will likely be consistent, only deviate from trend if you
feel absolutely necessary
Step 4: Connecting the Dots
• Complete your P&L
• Next Move onto Balance Sheet
• Complete your Net PP&E, Depreciation and CapEx
• Complete Working Capital
• Using A/R, A/P, IV Days, and Other Assets as Drivers
• For items with low forecasting capabilities, hold constant
• Re-check your balance sheet to it balances
BUILDING THE MODEL
Step 5 : The Final Statements
The Finalized P&L
BUILDING THE MODEL
Step 5 : The Final Statements
The Finalized Balance Sheet
BUILDING THE MODEL
Step 5 : The Final Statements
Statement of Cash Flows
BUILDING THE MODEL
EcommerceCo PROJECTED CASH FLOW STATEMENT
($ in millions)
2009 2010 2011 2012 2013 2014 2015 2016 2017 2018
CASH FLOW FROM OPERATIONS
Net Income 902.0$ 1,152.0$ 631.0$ (39.0)$ 274.0$ 1,522.6$ 1,340.3$ 1,743.9$ 1,799.0$ 2,030.7$
Depreciation 378.0 568.0 1,083.0 2,159.0 3,253.0 3,466.9 4,185.8 4,576.9 5,104.9 5,513.7
Amortization - - - - -
D in Working Capital
Current Assets:
Accounts receivable, net and other (481.0) (295.0) (866.0) (861.0) (846.0) (850.3) (824.5) (783.2) (731.1) (692.0)
Inventory (531.0) (1,019.0) (1,777.0) (999.0) (1,410.0) (1,229.2) (1,268.2) (1,204.7) (1,124.5) (1,064.4)
Other Current Assets - - - - -
Current Liabilities:
Accounts Payable 1,859.0 2,373.0 2,997.0 1,038.0 736.0 2,510.0 2,589.5 2,459.9 2,296.2 2,173.5
Accrued Expenses 300.0 740.0 1,067.0 2,070.0 1,888.0 1,193.0 1,156.7 1,098.8 1,025.7 970.9
Additions to /Amortization of previously unearned revenue 465.0 (218.0) 43.0 275.0 399.0 - - - - -
Other Assets - - -
Total Cash from Operations $3,293.0 $3,495.0 $3,903.0 $4,180.0 $5,475.0 $6,612.9 $7,179.7 $7,891.6 $8,370.2 $8,932.3
CASH FLOW FROM INVESTING
Capital Expenditures (373.0) (979.0) (1,811.0) (3,785.0) (3,444.0) (3,466.9) (4,185.8) (4,576.9) (5,104.9) (5,513.7)
Acquisitions, net of cash acquired, and (40.0) (352.0) (705.0) (745.0) (312.0) - - - - -
Sales and maturities of marketable securities and other investments 1,966.0 4,250.0 6,843.0 4,237.0 2,306.0 - - - - -
Purchases of marketable securities and other investments (3,890.0) (6,279.0) (6,257.0) (3,302.0) (2,826.0) - - - - -
Total Cash From Investing ($2,337.0) ($3,360.0) ($1,930.0) ($3,595.0) ($4,276.0) ($3,466.9) ($4,185.8) ($4,576.9) ($5,104.9) ($5,513.7)
CASH FLOW FROM FINANCING
Excess tax benefits from stock-based compensation 105.0 259.0 62.0 429.0 78.0 - - - - -
Common stock repurchased - - (277.0) (960.0) - - - - - -
Proceeds from long-term debt and other 87.0 143.0 177.0 3,378.0 394.0 - - - - -
Repayments of long-term debt, capital lease, and finance lease obligations (472.0) (221.0) (444.0) (588.0) (1,011.0) - - - - -
Total Cash from Financing ($280.0) $181.0 ($482.0) $2,259.0 ($539.0) $0.0 $0.0 $0.0 $0.0 $0.0
Foreign-currency effect on cash and cash equivalents (1.0) 17.0 1.0 (29.0) (86.0) - - - - -
Net Cash Flow $675.0 $333.0 $1,492.0 $2,815.0 $574.0 $3,146.0 $2,993.9 $3,314.7 $3,265.3 $3,418.7
CASH BALANCE
Opening Cash Balance 2,769.00 3,444.00 3,777.00 5,269.00 8,084.00 8,658.00 11,804.05 14,797.96 18,112.70 21,378.01
Net Cash Flow 675.00 333.00 1,492.00 2,815.00 574.00 3,146.05 2,993.91 3,314.75 3,265.31 3,418.67
Ending Cash Balance $3,444.0 $3,777.0 $5,269.0 $8,084.0 $8,658.0 $11,804.0 $14,798.0 $18,112.7 $21,378.0 $24,796.7
As of December 31,
Test for Sensitivity
• Change Core Assumptions
• Run Data Tables
BUILDING THE MODEL
INCOME STATEMENT ASSUMPTIONS
For the Year Ended December 31,
2009 2010 2011 2012 2013 2014 2015 2016 2017 2018
Product Revenue Growth 38.2% 36.4% 23.2% 17.7% 13.6% 10.4% 7.9% 6.1% 5.0%
Service Revenue Growth 52.6% 78.1% 54.0% 44.8% 37.1% 30.7% 25.4% 21.1% 17.5%
% of Revenue
Cost of Goods Sold 77.4% 77.7% 77.6% 75.2% 72.8% 72.0% 72.0% 72.0% 72.0% 72.0%
Fulfillment 6.8% 6.8% 7.3% 7.0% 7.2% 7.1% 7.1% 7.1% 7.1% 7.1%
Marketing 2.8% 3.0% 3.4% 3.9% 4.2% 4.1% 4.1% 4.1% 4.1% 4.1%
Technology and content 5.1% 5.1% 6.1% 7.5% 8.8% 8.1% 8.5% 8.3% 8.4% 8.4%
General and administrative 1.3% 1.4% 1.4% 1.5% 1.5% 1.5% 1.5% 1.5% 1.5% 1.5%
Other operating expense (income), net 0.4% 0.3% 0.3% 0.3% 0.2% 0.2% 0.2% 0.2% 0.2% 0.2%
Depreciation 1.5% 1.7% 2.3% 3.5% 4.4% 4.0% 4.2% 4.1% 4.1% 4.1%
Interest Income % of Marketable Securities 1.3% 1.0% 1.4% 1.2% 1.0% 1.1% 1.0% 1.1% 1.1% 1.1%
Interest Expense % of Debt -2.9% -2.5% -2.5% -1.7% -1.9% -1.8% -1.9% -1.8% -1.8% -1.8%
Other income (expense), net 0.1% 0.2% 0.2% -0.1% -0.2% -0.2% -0.2% -0.2% -0.2% -0.2%
Taxes % of Pre - Tax Income -21.8% -23.5% -31.2% -78.7% -31.8% -31.8% -31.8% -31.8% -31.8% -31.8%
Equity-method investment activity, net of tax 0.0% 0.0% 0.0% -0.3% -0.1% -0.2% -0.1% -0.2% -0.1% -0.1%
Terminal Growth Rate Enterprise Value Price Per Share
5.0% 24,403 52.48
5.8% 27,509 59.16
6.5% 31,946 68.70
7.3% 38,802 83.45
8.0% 50,801 109.25
8.8% 77,199 166.02
9.5% 182,790 393.10
Q&A
INTRODUCTION TO FINANCIAL MODELING
Training Courses:
Training the Street
Wall St. Prep
Books:
Microsoft Excel: Data Analysis and Business Modeling by Wayne Winston
Online Training and Tools:
Coursera
MIT OpenCourseware
Udemy
Aswath Damodaran – Stern School of Business / Prof. of Finance
FinDynamics – XBRL Financial Statements / Excel Plug in
ADVANCED MODELING COURSES AND TRAINING
‣ Body Level One
‣ Body Level Two
‣ Body Level Three
‣ Body Level Four
‣ Body Level Five
‣ Body Level One
‣ Body Level Two
‣ Body Level Three
‣ Body Level Four
‣ Body Level Five
THANKS!
‣ Body Level One
‣ Body Level Two
‣ Body Level Three
‣ Body Level Four
‣ Body Level Five
KEVIN A. CROSBY
‣ Body Level One
‣ Body Level Two
‣ Body Level Three
‣ Body Level Four
‣ Body Level Five
‣ Email: crosbyk@umich.edu
‣ LinkedIn: www.linkedin.com/in/kevinanthonycrosby
‣ Twitter: KevinCrosby1

Introduction to Financial modeling

  • 1.
    INTRODUCTION TO FINANCIAL MODELING Kevin Crosby,Business Strategist and Sr. Mgr of Procurement for Amazon Canada Consumer Electronics
  • 2.
    AGENDAAGENDA ‣ Introduction toFinancial Modeling ‣ Financial Model Design and Etiquette ‣ Key Financial Terms and Ratios ‣ Introduction to Case Study ‣ Building a Financial Model 101 ‣ Closing and Q&A
  • 3.
    Why do weuse models? • Track Historical company data • Learn inputs that drive a business • Project company performance into the future • Value a company for equity value or for enterprise value for potential acquisition / divestiture Who uses models? • Entrepreneurs/Business Owners • Financial Managers • Equities Researchers • Investment Bankers • Private Equity Analysts What do they tell us? • How sensitive the outputs are to changes in inputs • How do deliver value (profits and cash flow) • What resources a company needs to deliver certain levels of value • How to value a company over time INTRODUCTION TO FINANCIAL MODELING
  • 4.
  • 5.
    What makes agood design? • Accurate • Scalable • Adoptable • Lasting DESIGNING A MODEL HighLow Complexity High Flexibility Low ? Flexibility = Broad Use / Scalable Complexity = Accuracy
  • 6.
    What goes intothe design? DESIGNING A MODEL Inputs Calculator Outputs Sensitivities • Core Fixed Assumptions • User Inputs for business drivers What we input • Historical Data • Growth rates • Expected Forecasted Data (The best being external drivers) • Formulas that drive model • Forecasts What we use • Financial Ratios • Growth Rate Formulas • Regressions • Core Financial Statements • Model “Roll-ups” • Executive Summary What we get • Financial Statements • Return Ratios • Payback Period • Valuations • Demonstrates output sensitivity to inputs What we simulate • Changes in growth rate • Increased Price / Costs • Higher Cost of Capital • Capital Structure • Changes in Cash Cycle • Changes in CapEx
  • 7.
    How do youknow what inputs to use and their impact to output? • Simple, we use history. • No assumption is going to be 100% right, but we use data to support it. What ways can you use to extrapolate the future for better assumptions? • Demand – Market growth rates, size of market, share of market (3rd party research, top down or bottoms up analysis) • Input Prices / Costs – 3rd parties, commodities futures, correlation indices • Impact - Regression of inputs to outputs, correlation matrices Remember, complexity improves accuracy, but reduces flexibility, scalability, usability DESIGNING A MODEL
  • 8.
    What is modeletiquette? • Defined Process included in ‘Process Tab’, ‘Definitions’, ‘Formulas’ • Easy distinction between inputs, formulas, and outputs • Dollar Values at the Top and Bottom rows of a model • Notes delineating your key assumptions • Pages / Summaries that can easily be printed for executive decisions MODEL ETIQUETTE Sales $808 $813 $802 $842 Cost of goods sold, excl. depreciation 607.2 600.3 587.9 600.8 Depreciation 23.0 21.6 37.7 39.1 Gross profit 177.8 191.1 176.4 202.1 SG&A 133.3 166.7 156.4 134.7 Operating profit 44.5 24.4 20.0 67.4 Interest expense 6.8 8.3 9.8 8.7 Profit before tax 37.7 16.1 10.2 58.7 Income taxes 13.6 5.8 3.7 21.1 Net income $24 $10 $7 $38 Driver Input Historical Input Formula Percentage Hyperlinks Checks
  • 9.
  • 10.
    • Income Statement/ Profit and (Loss) Statement / (P&L) • Balance Sheet • Assets • Liabilities • Shareholders Equity • Assets = Liabilities + Shareholder Equity (Must always be balanced) • Statement of Cash Flows • Cash Flow from Operations • Cash Flow from Investments • Cash Flow from Financing • Others Statements (sometimes included) • Depreciation Schedule • Working Capital Schedule • Debt Schedule KEY FINANCIAL TERMS AND RATIOS
  • 11.
    What are thekey metrics that we look for in a model? KEY FINANCIAL TERMS AND RATIOS HBS Finance
  • 12.
    Core Ratios fortoday • Growth Rates = Current Revenue / Last Year Revenue -1 • CAGR = (Current Revenue / Revenue 5 Years ago) ^ (1/5) -1 • Accounts Receivable Days = Accounts Receivable / Net Revenue * 365 • Inventory Days = Ending Total Inventory / FY COGS * 365 • Account Payable Days = Accounts Payable / FY COGS * 365 • Other Current Assets as a % of Revenue = Other Current Assets / Net Revenue • Other Current Liabilities as a % of Revenue = Other Current Liabilities / Net Revenue KEY FINANCIAL TERMS AND RATIOS HBS Finance
  • 13.
  • 14.
    Company Background A LOCALECOMMERCE RETAILER
  • 15.
    Disclaimer The demonstration includessolely public information from the Amazon.com Financial Statements (www.amazon.com/ir). All information included reflects no internal view of the company and only serves as a demo for teaching this class how to model financial statements. A LOCAL ECOMMERCE RETAILER
  • 16.
    BUILDING THE MODEL INTRODUCTIONTO FINANCIAL MODELING
  • 17.
    Step 1: TheBlank Model ed model) BUILDING THE MODEL
  • 18.
    BUILDING THE MODEL Step2: Input the Historical Data w/ Formulas • Income Statement / Profit and (Loss) Statement / (P&L) • Balance Sheet (Make sure it’s balanced) • Hint – Use a formula • Statement of Cash Flows – Check ending balances • Others Statements (sometimes included)
  • 19.
    BUILDING THE MODEL Step3: Forecast your Drivers • Use historical ratios and growth rates to forecast future drivers • Use External data to drive units (if you need them) • Key Ratios will likely be consistent, only deviate from trend if you feel absolutely necessary
  • 20.
    Step 4: Connectingthe Dots • Complete your P&L • Next Move onto Balance Sheet • Complete your Net PP&E, Depreciation and CapEx • Complete Working Capital • Using A/R, A/P, IV Days, and Other Assets as Drivers • For items with low forecasting capabilities, hold constant • Re-check your balance sheet to it balances BUILDING THE MODEL
  • 21.
    Step 5 :The Final Statements The Finalized P&L BUILDING THE MODEL
  • 22.
    Step 5 :The Final Statements The Finalized Balance Sheet BUILDING THE MODEL
  • 23.
    Step 5 :The Final Statements Statement of Cash Flows BUILDING THE MODEL EcommerceCo PROJECTED CASH FLOW STATEMENT ($ in millions) 2009 2010 2011 2012 2013 2014 2015 2016 2017 2018 CASH FLOW FROM OPERATIONS Net Income 902.0$ 1,152.0$ 631.0$ (39.0)$ 274.0$ 1,522.6$ 1,340.3$ 1,743.9$ 1,799.0$ 2,030.7$ Depreciation 378.0 568.0 1,083.0 2,159.0 3,253.0 3,466.9 4,185.8 4,576.9 5,104.9 5,513.7 Amortization - - - - - D in Working Capital Current Assets: Accounts receivable, net and other (481.0) (295.0) (866.0) (861.0) (846.0) (850.3) (824.5) (783.2) (731.1) (692.0) Inventory (531.0) (1,019.0) (1,777.0) (999.0) (1,410.0) (1,229.2) (1,268.2) (1,204.7) (1,124.5) (1,064.4) Other Current Assets - - - - - Current Liabilities: Accounts Payable 1,859.0 2,373.0 2,997.0 1,038.0 736.0 2,510.0 2,589.5 2,459.9 2,296.2 2,173.5 Accrued Expenses 300.0 740.0 1,067.0 2,070.0 1,888.0 1,193.0 1,156.7 1,098.8 1,025.7 970.9 Additions to /Amortization of previously unearned revenue 465.0 (218.0) 43.0 275.0 399.0 - - - - - Other Assets - - - Total Cash from Operations $3,293.0 $3,495.0 $3,903.0 $4,180.0 $5,475.0 $6,612.9 $7,179.7 $7,891.6 $8,370.2 $8,932.3 CASH FLOW FROM INVESTING Capital Expenditures (373.0) (979.0) (1,811.0) (3,785.0) (3,444.0) (3,466.9) (4,185.8) (4,576.9) (5,104.9) (5,513.7) Acquisitions, net of cash acquired, and (40.0) (352.0) (705.0) (745.0) (312.0) - - - - - Sales and maturities of marketable securities and other investments 1,966.0 4,250.0 6,843.0 4,237.0 2,306.0 - - - - - Purchases of marketable securities and other investments (3,890.0) (6,279.0) (6,257.0) (3,302.0) (2,826.0) - - - - - Total Cash From Investing ($2,337.0) ($3,360.0) ($1,930.0) ($3,595.0) ($4,276.0) ($3,466.9) ($4,185.8) ($4,576.9) ($5,104.9) ($5,513.7) CASH FLOW FROM FINANCING Excess tax benefits from stock-based compensation 105.0 259.0 62.0 429.0 78.0 - - - - - Common stock repurchased - - (277.0) (960.0) - - - - - - Proceeds from long-term debt and other 87.0 143.0 177.0 3,378.0 394.0 - - - - - Repayments of long-term debt, capital lease, and finance lease obligations (472.0) (221.0) (444.0) (588.0) (1,011.0) - - - - - Total Cash from Financing ($280.0) $181.0 ($482.0) $2,259.0 ($539.0) $0.0 $0.0 $0.0 $0.0 $0.0 Foreign-currency effect on cash and cash equivalents (1.0) 17.0 1.0 (29.0) (86.0) - - - - - Net Cash Flow $675.0 $333.0 $1,492.0 $2,815.0 $574.0 $3,146.0 $2,993.9 $3,314.7 $3,265.3 $3,418.7 CASH BALANCE Opening Cash Balance 2,769.00 3,444.00 3,777.00 5,269.00 8,084.00 8,658.00 11,804.05 14,797.96 18,112.70 21,378.01 Net Cash Flow 675.00 333.00 1,492.00 2,815.00 574.00 3,146.05 2,993.91 3,314.75 3,265.31 3,418.67 Ending Cash Balance $3,444.0 $3,777.0 $5,269.0 $8,084.0 $8,658.0 $11,804.0 $14,798.0 $18,112.7 $21,378.0 $24,796.7 As of December 31,
  • 24.
    Test for Sensitivity •Change Core Assumptions • Run Data Tables BUILDING THE MODEL INCOME STATEMENT ASSUMPTIONS For the Year Ended December 31, 2009 2010 2011 2012 2013 2014 2015 2016 2017 2018 Product Revenue Growth 38.2% 36.4% 23.2% 17.7% 13.6% 10.4% 7.9% 6.1% 5.0% Service Revenue Growth 52.6% 78.1% 54.0% 44.8% 37.1% 30.7% 25.4% 21.1% 17.5% % of Revenue Cost of Goods Sold 77.4% 77.7% 77.6% 75.2% 72.8% 72.0% 72.0% 72.0% 72.0% 72.0% Fulfillment 6.8% 6.8% 7.3% 7.0% 7.2% 7.1% 7.1% 7.1% 7.1% 7.1% Marketing 2.8% 3.0% 3.4% 3.9% 4.2% 4.1% 4.1% 4.1% 4.1% 4.1% Technology and content 5.1% 5.1% 6.1% 7.5% 8.8% 8.1% 8.5% 8.3% 8.4% 8.4% General and administrative 1.3% 1.4% 1.4% 1.5% 1.5% 1.5% 1.5% 1.5% 1.5% 1.5% Other operating expense (income), net 0.4% 0.3% 0.3% 0.3% 0.2% 0.2% 0.2% 0.2% 0.2% 0.2% Depreciation 1.5% 1.7% 2.3% 3.5% 4.4% 4.0% 4.2% 4.1% 4.1% 4.1% Interest Income % of Marketable Securities 1.3% 1.0% 1.4% 1.2% 1.0% 1.1% 1.0% 1.1% 1.1% 1.1% Interest Expense % of Debt -2.9% -2.5% -2.5% -1.7% -1.9% -1.8% -1.9% -1.8% -1.8% -1.8% Other income (expense), net 0.1% 0.2% 0.2% -0.1% -0.2% -0.2% -0.2% -0.2% -0.2% -0.2% Taxes % of Pre - Tax Income -21.8% -23.5% -31.2% -78.7% -31.8% -31.8% -31.8% -31.8% -31.8% -31.8% Equity-method investment activity, net of tax 0.0% 0.0% 0.0% -0.3% -0.1% -0.2% -0.1% -0.2% -0.1% -0.1% Terminal Growth Rate Enterprise Value Price Per Share 5.0% 24,403 52.48 5.8% 27,509 59.16 6.5% 31,946 68.70 7.3% 38,802 83.45 8.0% 50,801 109.25 8.8% 77,199 166.02 9.5% 182,790 393.10
  • 25.
  • 26.
    Training Courses: Training theStreet Wall St. Prep Books: Microsoft Excel: Data Analysis and Business Modeling by Wayne Winston Online Training and Tools: Coursera MIT OpenCourseware Udemy Aswath Damodaran – Stern School of Business / Prof. of Finance FinDynamics – XBRL Financial Statements / Excel Plug in ADVANCED MODELING COURSES AND TRAINING
  • 27.
    ‣ Body LevelOne ‣ Body Level Two ‣ Body Level Three ‣ Body Level Four ‣ Body Level Five ‣ Body Level One ‣ Body Level Two ‣ Body Level Three ‣ Body Level Four ‣ Body Level Five THANKS! ‣ Body Level One ‣ Body Level Two ‣ Body Level Three ‣ Body Level Four ‣ Body Level Five KEVIN A. CROSBY ‣ Body Level One ‣ Body Level Two ‣ Body Level Three ‣ Body Level Four ‣ Body Level Five ‣ Email: crosbyk@umich.edu ‣ LinkedIn: www.linkedin.com/in/kevinanthonycrosby ‣ Twitter: KevinCrosby1

Editor's Notes

  • #9 Not always standard Each organization will develop their own
  • #19 =IF(ROUND(Assets-(Liabilities +SE),3)=0,"Balanced","ERROR")
  • #21 Inventory = COGS/365*IV Days AR = Revenue / 365 * AR Days AP = COGS / 365 * AP Days