Download as PPSX, PPTX

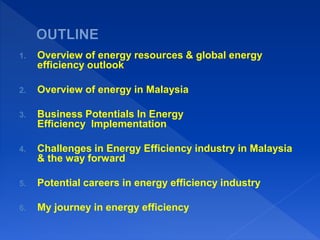

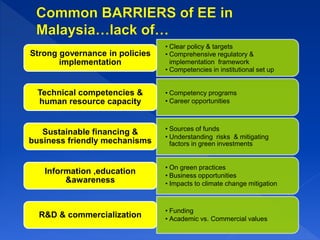
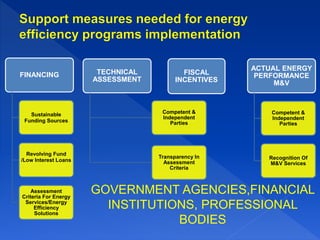
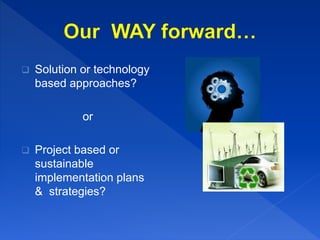
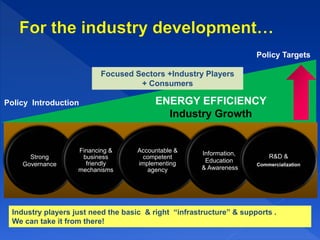
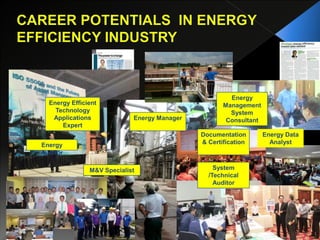
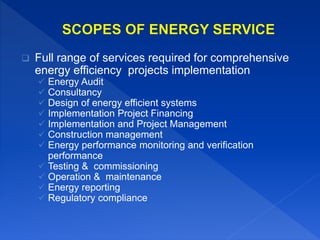
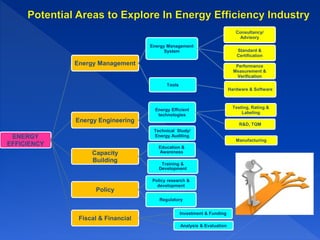


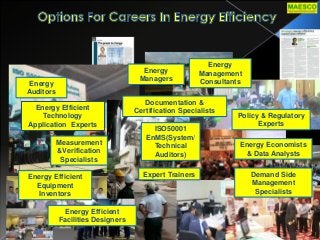
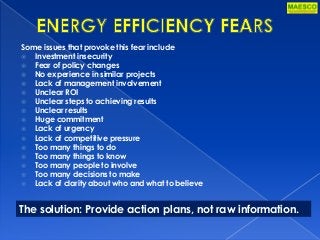
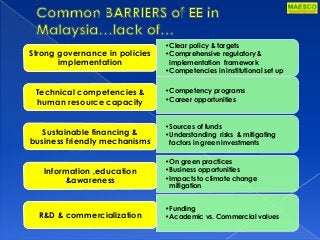

This document discusses an awareness program for Malaysian universities that covers 5 topics: 1) An overview of energy and energy efficiency 2) An introduction to the energy service industry 3) Business potentials in energy efficiency 4) Potential careers in the energy efficiency industry 5) Challenges in the energy efficiency industry in Malaysia and the way forward