Download as PDF, PPTX


![ENERGY OUTLOOK
TRANSPORTATION
Vehicle efficiency:
Costs influence consumer
choices
INDUSTRIAL
Manufacturing, chemicals to lead
growth in industrial energy demand
ELECTRICITY GENERATION
Industrial demand rises 30 %, led
by growth in Non OECD countries
The global energy mix will grow more diverse
and less carbon-intensive
Source: Exxon Energy outlook 2012
The impact of increased energy
consumption can be reduced through
energy efficiency and a transition to a
stronger reliance on cleaner sources of
energy, including renewable energy and
low-GHG [greenhouse gas] emitting fossil
fuel technologies, such as a shift from coal
to natural gas](https://image.slidesharecdn.com/iiec2013eeimplementationplayersperspective-131121072424-phpapp01/85/IIEC-ELECTRICAL-CONFERENCE-2013-EE-implementation-player-s-perspective-4-320.jpg)


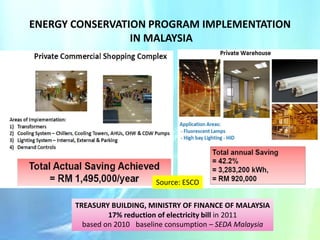
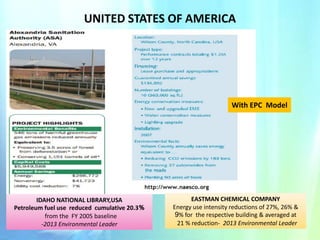

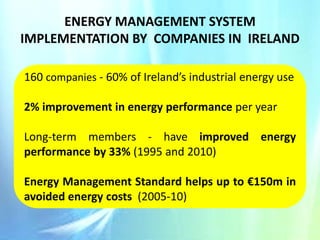
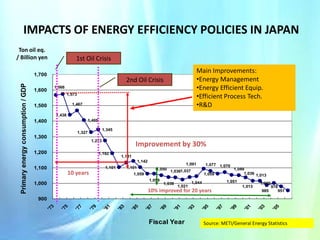
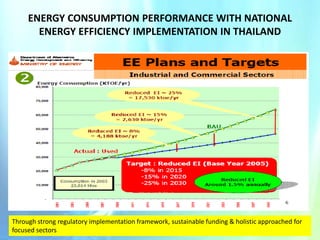


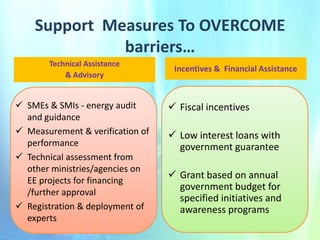


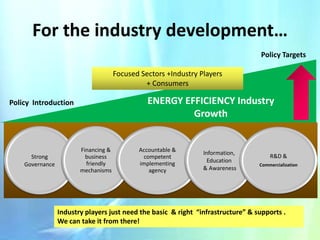
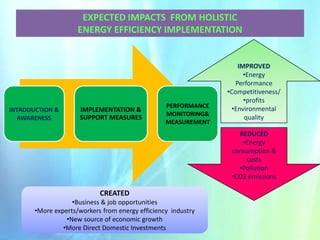


The document discusses the business potential and importance of energy efficiency implementation within various sectors, highlighting the need for sustainable practices to reduce energy consumption and enhance corporate reputation. It presents barriers to energy efficiency in Malaysia, suggesting solutions such as strong governance, technical assistance, and financial incentives to overcome these challenges. Success stories from different countries demonstrate the positive impact of energy management strategies, emphasizing the economic and environmental benefits of adopting energy-efficient technologies.


