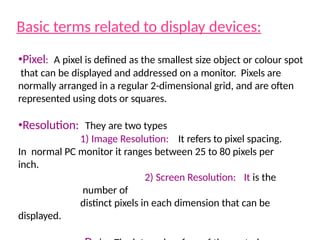
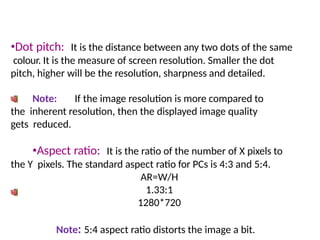
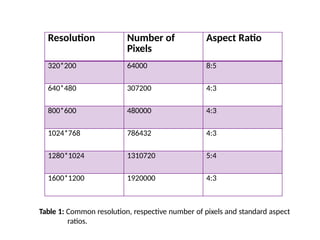
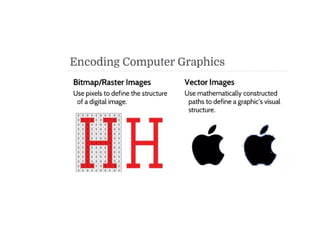
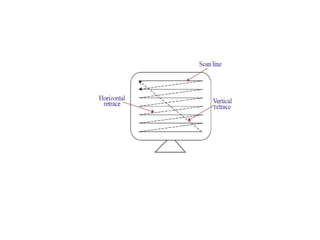
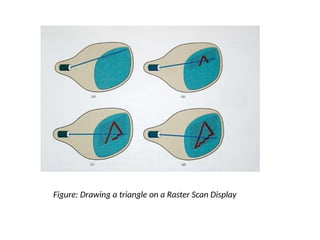
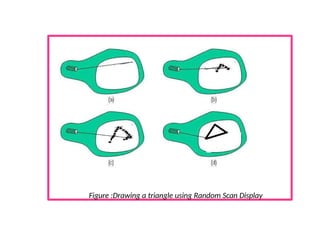
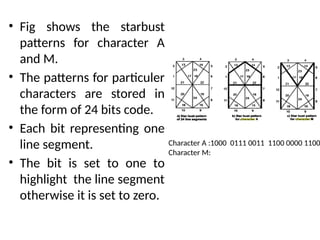
Pixel, Frame buffer, Resolution, Aspect
ratio
Basic terms related to display devices:
•Pixel: A pixel is defined as the smallest size object or colour spot
that can be displayed and addressed on a monitor. Pixels are
normally arranged in a regular 2-dimensional grid, and are often
represented using dots or squares.
•Resolution: They are two types
1) Image Resolution: It refers to pixel spacing.
In normal PC monitor it ranges between 25 to 80 pixels per
inch.
2) Screen Resolution: It is the
number of
distinct pixels in each dimension that can be
displayed.
•Dot pitch: It is the distance between any two dots of the same
colour. It is the measure of screen resolution. Smaller the dot
pitch, higher will be the resolution, sharpness and detailed.
Note: If the image resolution is more compared to
the inherent resolution, then the displayed image quality
gets reduced.
•Aspect ratio: It is the ratio of the number of X pixels to
the Y pixels. The standard aspect ratio for PCs is 4:3 and 5:4.
AR=W/H
1.33:1
1280*720
Note: 5:4 aspect ratio distorts the image a bit.
Resolution Number of
Pixels
Aspect Ratio
320*200 64000 8:5
640*480 307200 4:3
800*600 480000 4:3
1024*768 786432 4:3
1280*1024 1310720 5:4
1600*1200 1920000 4:3
Table 1: Common resolution, respective number of pixels and standard aspect
ratios.
Bit Planes, Colour Depth
NOTE:
 The appearance and colour of a pixel of an image is
result of interaction of three primary colour.
 When the intensity of all the 3 electron beam is
high it
results in a white pixel.
 When the intensity of all the 3 electron beam is low it
results in a black pixel.
 When the intensity of all the 3 electron beam is in
any
other combination it results in a intermediate coloured pixel.
•Colour Depth: The number of memory bits required to store
colour information(intensity value for all three primary colour
component) about a pixel is called colour depth or bit depth.
Corresponding to the intensity value 0 or 1,pixel can be black or
white.
•Bit plane or bitmap: The block of memory which stores bi-
level intensity values for each pixel of a full screen pure black and
white image is called a bit map or bit plane.
NOTE:
Colour or grey levels can be achieved using additional bit planes. Hence n-
bits per pixel means colour depth=n and it is a collection of n bit planes allowing 2^n
colours at every pixel.
Note:
The more the number of bits used per pixel, the finer the colour detail of
the image. However more memory is used for storage.
Colour Depth Number of
Displayed
colour
Bytes of Storage
Per Pixel
Common Name
for Colour Depth
4-Bit 16 0.5 Standard VGA
8-Bit 256 1.0 256-Colour Mode
16-Bit 65536 2.0 High Colour
24-Bit 1,67,77,216 3.0 True Colour
Table: Common colour depths used in PCs
For True Colour three bytes of information is used-
Red, Green and Blue .
A byte can hold 256 different values and so 256 voltage
settings are possible for each electron.
Hence each primary colour has 256
intensities. 16 million colour possibilities.
True colour is necessary for doing high quality photo-
editing, graphical design etc.
Primary Colours
True colour:
For High Colour two bytes of information are used to store
the intensity values for all three colours.
This is done by dividing 16 bits into 5 bits for blue 5
bits for
red and 6 bits for green.
Hence it has reduced colour precision and loss of visible
picture quality.
It is sometimes preferred as it uses 33% less
memory than in
true colour.
256-Colour Mode:
In 265-colour mode the PC uses only 8 bits.
It may use 2 bits for blue, 3 bits for green and
red.
High Colour:
Frame Buffer :
The frame buffer is the video memory that is used
to hold
or map the image displayed on the screen.
The amount of memory required to hold the image
depend primarily on the resolution of the screen image and the
colour depth.
The formula to calculate how much video memory is
required at a given resolution and bit depth is given below.
Memory in MB = (X-resolution*Y-resolution*Bit per
pixel)/(8*1024*1024)
Raster Scan Display and Random Scan
Display:
The most prominent part of a computer is the display
system that is responsible for graphic display. Some of
the common types are given below:
1)
2)
3)
4)
5)
6)
Raster Scan Display
Random Scan Display
Direct View storage tube.
Flat Panel Displays
Three Dimensional Viewing Devices
Stereoscopic and Virtual Reality System
Fig : CRT used in TVs
Raster Scan Display and Random Scan Display:
Basically there are two types of CRT’s- Raster Scan type and
Random Scan type.
The main difference between the two is the technique with
which the image is generated on the phosphor coated CRT screen.
In Raster scan type the electron beam sweeps the entire
screen from left to right, top to bottom, in the same fashion as we
write on a notebook, word by word.
In Random Scan type the electronic beam is directed
straightway to the particular point(s) on the screen where the
image has to be produced. This technique is also called
vector drawing or stroke writing or calligraphic display.
Figure: Drawing a triangle on a Raster Scan Display
Figure :Drawing a triangle using Random Scan Display
Though the vector drawn images lack in depth and real-
like colour precision, the random display can work at higher
resolution than raster displays.
The images are sharper and have smooth edges unlike the
jagged lines and edges in raster type.
Primitives: Point, Lines, Line segments
Primitives
●Graphic SW and HW provide subroutines to describe a
scene in terms of basic geometric structures called
primitives.
Primitives are combined to form
complex structures
●Simplest primitives
– Point (pixel)
– Line segment
●Converting output primitives into frame buffer
updates. Choose which pixels contain which intensity
value.
● Constraints
– Straight lines should appear as a straight line
– Primitives should start and end accurately
–Primitives should have a consistent
brightness along their length
– They should be drawn rapidly
Point plotting is accomplished by converting a single
coordinate position furnished by an application program
into appropriate operations for the output device.
Line drawing is accomplished by calculating intermediate
positions along the line path between two specified end
points positions. An output device is then directed to fill
in these positions between the end points
A point is shown by
Illuminating a pixel
on the screen
A line segment is completely defined in terms of its two
endpoints
A line segment is thus defined as:
Line_Seg = {(x1, y1), (x2, y2) }
A line is produced by
means of illuminating a set
of intermediary pixels
x
y
x
1
x2
y
1
y2
Lines is digitized into a set of discrete integer positions that approximate
the actual line path.
Example:A computed line position of (10.48,20.51) is converted to pixel
position (10, 21).
The rounding of coordinate values to integer causes
all but horizontal and vertical lines to be displayed
with a stair step appearance “the jaggies”.
To load an intensity value into the frame buffer at a
position corresponding to column x along scan line y,
setpixel (x, y)
To retrieve the current frame buffer intensity setting for a
specified location we use a low level function ,
getpixel (x, y)
Display file and its structure
Display file:
The file used to store the command necessary for drawing the line segments is called the display
file.
Display file provides an interface between the image specification process and the image display
process.
Meta files: Display file may be applied to device other than refresh displays.
Fig 1. Vector refresh display system
Display file and its structure
Each display file contains the two fields
Opcode (operation code)
Operands(commands)
Table 1
Algorithm
Display file structure
Display file interpreter
The program which converts these commands into actual picture is called
display file interpreter.
Fig 2.Display file and interpreter
Commands used in display file interpreter:
Table 1
Character Generation
• Letters, numbers, and other character are often
displayed to label and annotate drawing and go
give instructions and information to the user.
• Most of the times characters are builts into the
graphics display devices, usallay as hardware
but sometimes through software.
• There are basic three methods:
– Stroke method
– Starbust method
– Bitmap method
1. Stroke method
• This method uses small line segments to generate
a character.
• The small series of line segments are drawn like a
strokes of a pen to form a character as shown in
figure.
• We can build our own stroke method.
– By calling a line drawing algorithm.
– Here it is necessary to decide which line segments are
needed for each character and
– Then drawing these segments using line drawing algo.
• This method supports scaling of the character.
– It does this by changing the length of the line
segments used for character drawing.
2. Starbust method
• In this method a fix pattern of line segments are
used to generate characters.
• As shown in figure, there are 24 line segments.
• Out of 24 line segments, segments required to
display for particular character, are highlighted
• This method is called starbust method because
of its characteristic appearance.
• Fig shows the starbust
patterns for character A
and M.
• The patterns for particuler
characters are stored in
the form of 24 bits code.
• Each bit representing one
line segment.
• The bit is set to one to
highlight the line segment
otherwise it is set to zero.
Character A :1000 0111 0011 1100 0000 1100
Character M:
Starbust method
• This method of character generation is not
used now a days because of following
disadvantages:
– The 24-bits are required to represent a character.
Hence more memory is required.
– Requires code conversion software to display
character from its 24 bits code.
– Character quality poor. Worst for curve shaped
character.
3. Bitmap Method
• The third method for character generation.
• Also known as dot matrix because in this
method characters are represented by an
array of dots in the matrix form.
• It’s a two dimentional array having columns
and rows.
• Each dot in the matrix is a pixel.
• The character is placed on the screen by copying pixel values
from the character array into some position of the screen’s
frame buffer.
• Value of the pixel controls the intensity of the pixel.
• Usually the dot patterns for all characters are stored in the
hardware device called a character generation chip.
• This chip accepts address for the character and gives the bit
pattern for that character as an output.
• Here the size of the pixel is fixed and hence the size of the
dot.
• Characters can be represented in many fonts.
• When number of fonts are more, the bit patterns for
characters may also be stored in RAM.
• Antialiasing is possible in this method.
Bitmap Method
A simple method for representing the character shapes in a particular typeface is to
use rectangular grid patterns.
The figure shows pattern for the particular letter.
When the pattern in the above figure is copied to the area of frame buffer, the 1 bits
designate which pixel Positions are to be displayed on the monitor.
Bitmap fonts are the simplest to define and display as character grid only need to be
mapped to a frame buffer position.
Bitmap fonts require more space because each variation must be stored in a font cache.
It is possible to generate different size and other variation from one set but this usually
does not produce good result.
43
Anti-aliasing Techniques
44
What Does Aliasing Means?
Digital sampling of any signal, whether sound, digital photographs, or other, can
result in apparent signals at frequencies well below anything present in the
original.
Aliasing occurs when a signal is sampled at a less than twice the highest frequency
present in the signal. In images, the repetition is in space rather than signals
sampled in time for digital audio.
If the image data is not properly processed during sampling or reconstruction, the
reconstructed image will differ from the original image, and an alias is seen.
Sampling
50
What Does Aliasing Means?
To remove this effect we will use the Anti Alasing technique/Methods
1 Supersampling/postfiltering
2 Area Sampling/prefiltering
51
What Does Aliasing Means?
52
Anti-aliasing:
Definition
53
Anti-aliasing:
Definition
Antialiasing is a technique used in digital imaging to
reduce the visual defects that occur when high-
resolution images are presented in a lower resolution
output devices like the monitor or printer. Aliasing
manifests itself as jagged or stair-stepped lines (Also
known as jaggies) on edges and objects that should
otherwise be smooth.
54
Aliased polygons
(jagged edges)
Anti-aliased polygons
Before and After of Anti-
Aliasing
55
What Does Anti-aliasing Do ?
Anti-aliasing makes these curved or slanting lines smooth
again by adding a slight discoloration to the edges of the
line or object, causing the jagged edges to blur and melt
together. It also removes jagged edges by adding subtle
color changes around the lines If the image is zoomed
out a bit, the human eye can no longer notice the slight
discoloration that antialiasing creates.
56
Do We really need Anti-aliasing?
Jaggies appear when an output device does not have a high enough
resolution to represent a smooth line correctly. The pixels that
make up the screen of the monitor are all shaped in rectangles or
squares. Because lighting up only half of one of these square pixels
is not possible.
The jagged line effect can be minimized by increasing the resolution
of the monitor, making the pixels small enough that the human eye
cannot distinguish them individually. This is not a good solution,
however, because images are displayed based on their resolution. A
single image pixel may take up many monitor pixels, making it
impossible for a higher resolution monitor to mask the jagged
edges. This is where anti-aliasing is required.
57
Anti-Aliasing Techniques
Anti-Aliasing techniques were developed to combat the effects of
aliasing. There are three main classes of anti-aliasing algorithms :
1.As aliasing problem is due to low resolution, one easy solution is to
increase the resolution. This increases the cost of image production.
2. The image can be calculated by considering the intensities over a
particular region. This is called prefiltering.
3.The image is created at high resolution and then digitally filtered. This
method is called supersampling or postfiltering and eliminates high
frequencies which are the source of aliases.
4. Unweighted Area Sampling
58
1. Anti-Aliasing : Increasing Resolution
• Doubling resolution in x and y
• This method only lessens the problem
• Costs 4 times memory, memory
bandwidth and scan conversion time
59
2. Anti-Aliasing : Prefiltering
Prefiltering methods treat a pixel as an area, and
compute pixel color based on the overlap of the scene's
objects with a pixel's area.
A modification to Bresenham's algorithm was developed
by Pitteway and Watkinson. In this algorithm, each pixel
is given an intensity depending on the area of overlap of
the pixel and the line. So, due to the blurring effect
along the line edges, the effect of anti-aliasing is not
very prominent, although it still exists.
For sampling shapes other than polygons, this can be
very computationally intensive.
60
Original Image
Without antialiasing, the jaggies are
harshly evident.
Prefiltered image
.
Along the character's border, the colors are
a mixture of the foreground and
background colors.
61
62
3. Anti-Aliasing : Postfiltering
Supersampling or postfiltering is the process by which aliasing effects in
graphics are reduced by increasing the frequency of the sampling grid and
then averaging the results down. This process means calculating a virtual
image at a higher spatial resolution than the frame store resolution and then
averaging down to the final resolution. It is called postfiltering as the filtering
is carried out after sampling.
Supersampling is basically a three stage process :
* A continuous image I(x,y) is sampled at n times the frame resolution. This is
a virtual image.
** The virtual image is then lowpass filtered.
*** The filtered image is then resampled at the final frame resolution.
63
Anti-Aliasing : Postfiltering (Continues)
There are two drawbacks to this method :
# There is a technical and economic limit for increasing the resolution of the
virtual image.
## Since the frequency of images can extend to infinity, it just reduces aliasing
by raising the Nyquist limit - shift the effect of the frequency spectrum.
Calculating the end color value
64
Anti-Aliasing : Postfiltering (Continues)
65
4. Anti-Aliasing : Unweighted Area
Sampling
• Drawing a line as a 1-pixel width
rectangle.
• For now pixel is unit square centered
on
x-y intersection.
• Midpoint algorithm: pick single pixel
closet to center line of rectangle. This is
a form of point sampling.
66
Anti-Aliasing : Unweighted Area
Sampling (Continues)
• Set each pixel’s intensity value
proportional to its area of overlap covered
by primitive
• Note more than one pixel/column for lines
of 0<slope<1
• This is a form of unweighted area
sampling
– the further pixel center is from the line, the
less influent it has
– only pixels covered by primitive can
contribute
– only amount of area of overlap matters,
regardless of distance of area of overlap
from pixel’s center
67
Anti-Aliasing : Unweighted Area
Sampling

Unit 2 open gl .pptx

  • 1.
    Pixel, Frame buffer,Resolution, Aspect ratio
  • 2.
    Basic terms relatedto display devices: •Pixel: A pixel is defined as the smallest size object or colour spot that can be displayed and addressed on a monitor. Pixels are normally arranged in a regular 2-dimensional grid, and are often represented using dots or squares. •Resolution: They are two types 1) Image Resolution: It refers to pixel spacing. In normal PC monitor it ranges between 25 to 80 pixels per inch. 2) Screen Resolution: It is the number of distinct pixels in each dimension that can be displayed.
  • 3.
    •Dot pitch: Itis the distance between any two dots of the same colour. It is the measure of screen resolution. Smaller the dot pitch, higher will be the resolution, sharpness and detailed. Note: If the image resolution is more compared to the inherent resolution, then the displayed image quality gets reduced. •Aspect ratio: It is the ratio of the number of X pixels to the Y pixels. The standard aspect ratio for PCs is 4:3 and 5:4. AR=W/H 1.33:1 1280*720 Note: 5:4 aspect ratio distorts the image a bit.
  • 4.
    Resolution Number of Pixels AspectRatio 320*200 64000 8:5 640*480 307200 4:3 800*600 480000 4:3 1024*768 786432 4:3 1280*1024 1310720 5:4 1600*1200 1920000 4:3 Table 1: Common resolution, respective number of pixels and standard aspect ratios.
  • 5.
    Bit Planes, ColourDepth NOTE:  The appearance and colour of a pixel of an image is result of interaction of three primary colour.  When the intensity of all the 3 electron beam is high it results in a white pixel.  When the intensity of all the 3 electron beam is low it results in a black pixel.  When the intensity of all the 3 electron beam is in any other combination it results in a intermediate coloured pixel.
  • 6.
    •Colour Depth: Thenumber of memory bits required to store colour information(intensity value for all three primary colour component) about a pixel is called colour depth or bit depth. Corresponding to the intensity value 0 or 1,pixel can be black or white. •Bit plane or bitmap: The block of memory which stores bi- level intensity values for each pixel of a full screen pure black and white image is called a bit map or bit plane. NOTE: Colour or grey levels can be achieved using additional bit planes. Hence n- bits per pixel means colour depth=n and it is a collection of n bit planes allowing 2^n colours at every pixel.
  • 7.
    Note: The more thenumber of bits used per pixel, the finer the colour detail of the image. However more memory is used for storage. Colour Depth Number of Displayed colour Bytes of Storage Per Pixel Common Name for Colour Depth 4-Bit 16 0.5 Standard VGA 8-Bit 256 1.0 256-Colour Mode 16-Bit 65536 2.0 High Colour 24-Bit 1,67,77,216 3.0 True Colour Table: Common colour depths used in PCs
  • 8.
    For True Colourthree bytes of information is used- Red, Green and Blue . A byte can hold 256 different values and so 256 voltage settings are possible for each electron. Hence each primary colour has 256 intensities. 16 million colour possibilities. True colour is necessary for doing high quality photo- editing, graphical design etc. Primary Colours True colour:
  • 9.
    For High Colourtwo bytes of information are used to store the intensity values for all three colours. This is done by dividing 16 bits into 5 bits for blue 5 bits for red and 6 bits for green. Hence it has reduced colour precision and loss of visible picture quality. It is sometimes preferred as it uses 33% less memory than in true colour. 256-Colour Mode: In 265-colour mode the PC uses only 8 bits. It may use 2 bits for blue, 3 bits for green and red. High Colour:
  • 10.
    Frame Buffer : Theframe buffer is the video memory that is used to hold or map the image displayed on the screen. The amount of memory required to hold the image depend primarily on the resolution of the screen image and the colour depth. The formula to calculate how much video memory is required at a given resolution and bit depth is given below. Memory in MB = (X-resolution*Y-resolution*Bit per pixel)/(8*1024*1024)
  • 11.
    Raster Scan Displayand Random Scan Display: The most prominent part of a computer is the display system that is responsible for graphic display. Some of the common types are given below: 1) 2) 3) 4) 5) 6) Raster Scan Display Random Scan Display Direct View storage tube. Flat Panel Displays Three Dimensional Viewing Devices Stereoscopic and Virtual Reality System Fig : CRT used in TVs
  • 12.
    Raster Scan Displayand Random Scan Display: Basically there are two types of CRT’s- Raster Scan type and Random Scan type. The main difference between the two is the technique with which the image is generated on the phosphor coated CRT screen. In Raster scan type the electron beam sweeps the entire screen from left to right, top to bottom, in the same fashion as we write on a notebook, word by word. In Random Scan type the electronic beam is directed straightway to the particular point(s) on the screen where the image has to be produced. This technique is also called vector drawing or stroke writing or calligraphic display.
  • 15.
    Figure: Drawing atriangle on a Raster Scan Display
  • 16.
    Figure :Drawing atriangle using Random Scan Display
  • 17.
    Though the vectordrawn images lack in depth and real- like colour precision, the random display can work at higher resolution than raster displays. The images are sharper and have smooth edges unlike the jagged lines and edges in raster type.
  • 18.
  • 19.
    Primitives ●Graphic SW andHW provide subroutines to describe a scene in terms of basic geometric structures called primitives. Primitives are combined to form complex structures ●Simplest primitives – Point (pixel) – Line segment
  • 20.
    ●Converting output primitivesinto frame buffer updates. Choose which pixels contain which intensity value. ● Constraints – Straight lines should appear as a straight line – Primitives should start and end accurately –Primitives should have a consistent brightness along their length – They should be drawn rapidly
  • 21.
    Point plotting isaccomplished by converting a single coordinate position furnished by an application program into appropriate operations for the output device. Line drawing is accomplished by calculating intermediate positions along the line path between two specified end points positions. An output device is then directed to fill in these positions between the end points
  • 22.
    A point isshown by Illuminating a pixel on the screen
  • 23.
    A line segmentis completely defined in terms of its two endpoints A line segment is thus defined as: Line_Seg = {(x1, y1), (x2, y2) }
  • 24.
    A line isproduced by means of illuminating a set of intermediary pixels x y x 1 x2 y 1 y2
  • 25.
    Lines is digitizedinto a set of discrete integer positions that approximate the actual line path. Example:A computed line position of (10.48,20.51) is converted to pixel position (10, 21).
  • 26.
    The rounding ofcoordinate values to integer causes all but horizontal and vertical lines to be displayed with a stair step appearance “the jaggies”.
  • 27.
    To load anintensity value into the frame buffer at a position corresponding to column x along scan line y, setpixel (x, y) To retrieve the current frame buffer intensity setting for a specified location we use a low level function , getpixel (x, y)
  • 28.
    Display file andits structure Display file: The file used to store the command necessary for drawing the line segments is called the display file. Display file provides an interface between the image specification process and the image display process. Meta files: Display file may be applied to device other than refresh displays. Fig 1. Vector refresh display system
  • 29.
    Display file andits structure Each display file contains the two fields Opcode (operation code) Operands(commands) Table 1
  • 30.
  • 31.
  • 32.
  • 33.
    Display file interpreter Theprogram which converts these commands into actual picture is called display file interpreter. Fig 2.Display file and interpreter Commands used in display file interpreter: Table 1
  • 34.
  • 35.
    Character Generation • Letters,numbers, and other character are often displayed to label and annotate drawing and go give instructions and information to the user. • Most of the times characters are builts into the graphics display devices, usallay as hardware but sometimes through software. • There are basic three methods: – Stroke method – Starbust method – Bitmap method
  • 36.
    1. Stroke method •This method uses small line segments to generate a character. • The small series of line segments are drawn like a strokes of a pen to form a character as shown in figure. • We can build our own stroke method. – By calling a line drawing algorithm. – Here it is necessary to decide which line segments are needed for each character and – Then drawing these segments using line drawing algo. • This method supports scaling of the character. – It does this by changing the length of the line segments used for character drawing.
  • 37.
    2. Starbust method •In this method a fix pattern of line segments are used to generate characters. • As shown in figure, there are 24 line segments. • Out of 24 line segments, segments required to display for particular character, are highlighted • This method is called starbust method because of its characteristic appearance.
  • 38.
    • Fig showsthe starbust patterns for character A and M. • The patterns for particuler characters are stored in the form of 24 bits code. • Each bit representing one line segment. • The bit is set to one to highlight the line segment otherwise it is set to zero. Character A :1000 0111 0011 1100 0000 1100 Character M:
  • 39.
    Starbust method • Thismethod of character generation is not used now a days because of following disadvantages: – The 24-bits are required to represent a character. Hence more memory is required. – Requires code conversion software to display character from its 24 bits code. – Character quality poor. Worst for curve shaped character.
  • 40.
    3. Bitmap Method •The third method for character generation. • Also known as dot matrix because in this method characters are represented by an array of dots in the matrix form. • It’s a two dimentional array having columns and rows.
  • 41.
    • Each dotin the matrix is a pixel. • The character is placed on the screen by copying pixel values from the character array into some position of the screen’s frame buffer. • Value of the pixel controls the intensity of the pixel. • Usually the dot patterns for all characters are stored in the hardware device called a character generation chip. • This chip accepts address for the character and gives the bit pattern for that character as an output. • Here the size of the pixel is fixed and hence the size of the dot. • Characters can be represented in many fonts. • When number of fonts are more, the bit patterns for characters may also be stored in RAM. • Antialiasing is possible in this method.
  • 42.
    Bitmap Method A simplemethod for representing the character shapes in a particular typeface is to use rectangular grid patterns. The figure shows pattern for the particular letter. When the pattern in the above figure is copied to the area of frame buffer, the 1 bits designate which pixel Positions are to be displayed on the monitor. Bitmap fonts are the simplest to define and display as character grid only need to be mapped to a frame buffer position. Bitmap fonts require more space because each variation must be stored in a font cache. It is possible to generate different size and other variation from one set but this usually does not produce good result.
  • 43.
  • 44.
    44 What Does AliasingMeans? Digital sampling of any signal, whether sound, digital photographs, or other, can result in apparent signals at frequencies well below anything present in the original. Aliasing occurs when a signal is sampled at a less than twice the highest frequency present in the signal. In images, the repetition is in space rather than signals sampled in time for digital audio. If the image data is not properly processed during sampling or reconstruction, the reconstructed image will differ from the original image, and an alias is seen.
  • 45.
  • 50.
    50 What Does AliasingMeans? To remove this effect we will use the Anti Alasing technique/Methods 1 Supersampling/postfiltering 2 Area Sampling/prefiltering
  • 51.
  • 52.
  • 53.
    53 Anti-aliasing: Definition Antialiasing is atechnique used in digital imaging to reduce the visual defects that occur when high- resolution images are presented in a lower resolution output devices like the monitor or printer. Aliasing manifests itself as jagged or stair-stepped lines (Also known as jaggies) on edges and objects that should otherwise be smooth.
  • 54.
    54 Aliased polygons (jagged edges) Anti-aliasedpolygons Before and After of Anti- Aliasing
  • 55.
    55 What Does Anti-aliasingDo ? Anti-aliasing makes these curved or slanting lines smooth again by adding a slight discoloration to the edges of the line or object, causing the jagged edges to blur and melt together. It also removes jagged edges by adding subtle color changes around the lines If the image is zoomed out a bit, the human eye can no longer notice the slight discoloration that antialiasing creates.
  • 56.
    56 Do We reallyneed Anti-aliasing? Jaggies appear when an output device does not have a high enough resolution to represent a smooth line correctly. The pixels that make up the screen of the monitor are all shaped in rectangles or squares. Because lighting up only half of one of these square pixels is not possible. The jagged line effect can be minimized by increasing the resolution of the monitor, making the pixels small enough that the human eye cannot distinguish them individually. This is not a good solution, however, because images are displayed based on their resolution. A single image pixel may take up many monitor pixels, making it impossible for a higher resolution monitor to mask the jagged edges. This is where anti-aliasing is required.
  • 57.
    57 Anti-Aliasing Techniques Anti-Aliasing techniqueswere developed to combat the effects of aliasing. There are three main classes of anti-aliasing algorithms : 1.As aliasing problem is due to low resolution, one easy solution is to increase the resolution. This increases the cost of image production. 2. The image can be calculated by considering the intensities over a particular region. This is called prefiltering. 3.The image is created at high resolution and then digitally filtered. This method is called supersampling or postfiltering and eliminates high frequencies which are the source of aliases. 4. Unweighted Area Sampling
  • 58.
    58 1. Anti-Aliasing :Increasing Resolution • Doubling resolution in x and y • This method only lessens the problem • Costs 4 times memory, memory bandwidth and scan conversion time
  • 59.
    59 2. Anti-Aliasing :Prefiltering Prefiltering methods treat a pixel as an area, and compute pixel color based on the overlap of the scene's objects with a pixel's area. A modification to Bresenham's algorithm was developed by Pitteway and Watkinson. In this algorithm, each pixel is given an intensity depending on the area of overlap of the pixel and the line. So, due to the blurring effect along the line edges, the effect of anti-aliasing is not very prominent, although it still exists. For sampling shapes other than polygons, this can be very computationally intensive.
  • 60.
    60 Original Image Without antialiasing,the jaggies are harshly evident. Prefiltered image . Along the character's border, the colors are a mixture of the foreground and background colors.
  • 61.
  • 62.
    62 3. Anti-Aliasing :Postfiltering Supersampling or postfiltering is the process by which aliasing effects in graphics are reduced by increasing the frequency of the sampling grid and then averaging the results down. This process means calculating a virtual image at a higher spatial resolution than the frame store resolution and then averaging down to the final resolution. It is called postfiltering as the filtering is carried out after sampling. Supersampling is basically a three stage process : * A continuous image I(x,y) is sampled at n times the frame resolution. This is a virtual image. ** The virtual image is then lowpass filtered. *** The filtered image is then resampled at the final frame resolution.
  • 63.
    63 Anti-Aliasing : Postfiltering(Continues) There are two drawbacks to this method : # There is a technical and economic limit for increasing the resolution of the virtual image. ## Since the frequency of images can extend to infinity, it just reduces aliasing by raising the Nyquist limit - shift the effect of the frequency spectrum. Calculating the end color value
  • 64.
  • 65.
    65 4. Anti-Aliasing :Unweighted Area Sampling • Drawing a line as a 1-pixel width rectangle. • For now pixel is unit square centered on x-y intersection. • Midpoint algorithm: pick single pixel closet to center line of rectangle. This is a form of point sampling.
  • 66.
    66 Anti-Aliasing : UnweightedArea Sampling (Continues) • Set each pixel’s intensity value proportional to its area of overlap covered by primitive • Note more than one pixel/column for lines of 0<slope<1 • This is a form of unweighted area sampling – the further pixel center is from the line, the less influent it has – only pixels covered by primitive can contribute – only amount of area of overlap matters, regardless of distance of area of overlap from pixel’s center
  • 67.