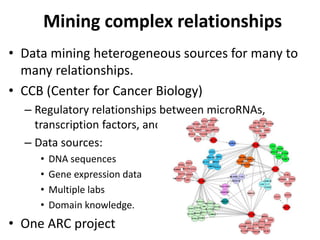
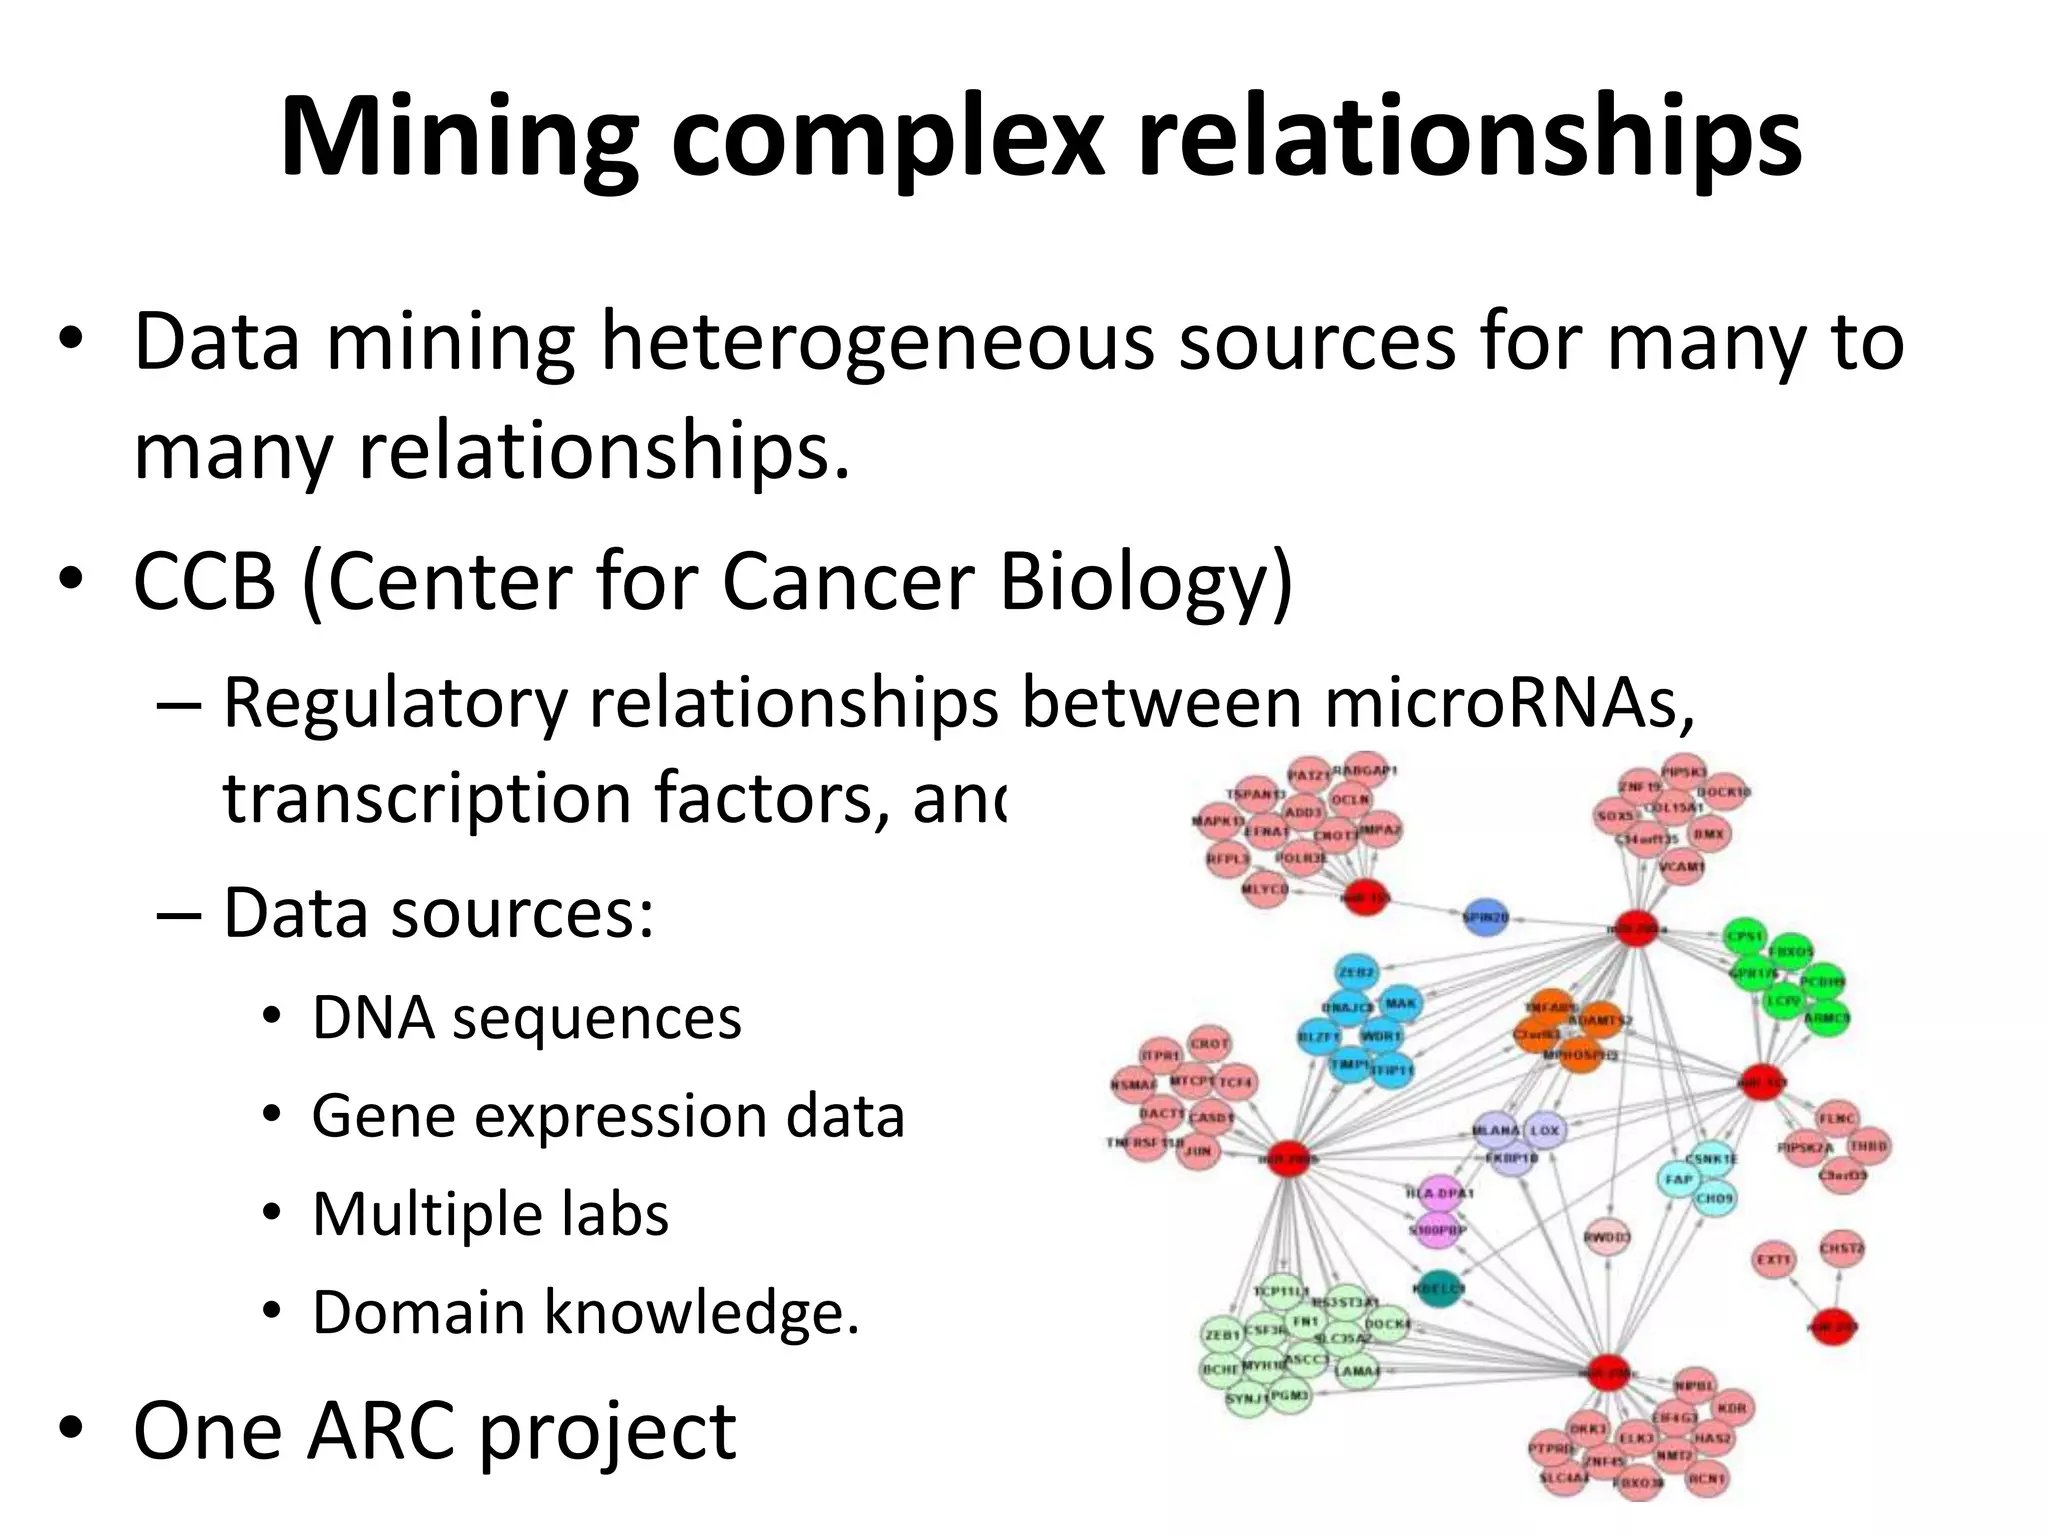
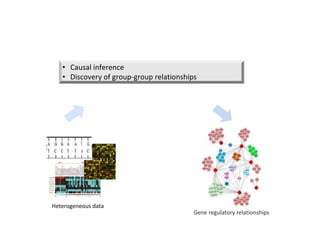
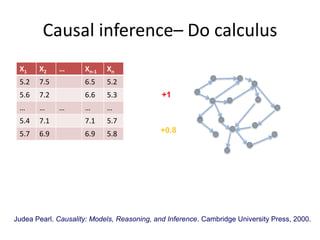
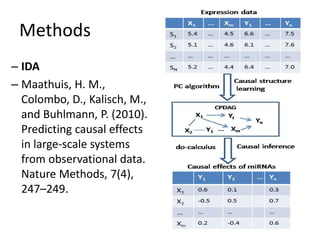
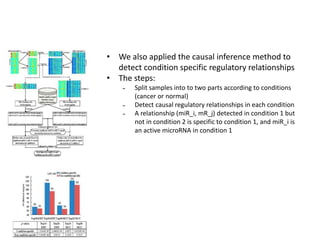
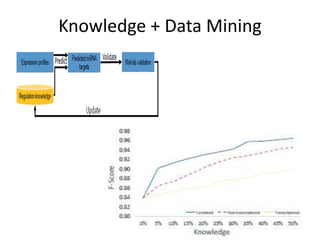
Mining complex relationships
• Data mining heterogeneous sources for many to
many relationships.
• CCB (Center for Cancer Biology)
– Regulatory relationships between microRNAs,
transcription factors, and genes.
– Data sources:
• DNA sequences
• Gene expression data
• Multiple labs
• Domain knowledge.
• One ARC project
• Causal inference
• Discovery of group-group relationships
Heterogeneous data
Inferring miRNA-mRNA regulatory relationships
Gene regulatory relationships
Causal inference based approaches
Why interested in causal relationships?
• Gene regulatory relationships are causal by nature
• Most existing work identifies only statistical associations/correlations
Gene C
Gene A Gene B
What’s the catch?
• Gold standard of causal discovery is controlled random trials
• RCTs are expensive and not always possible
• We want to discover causal relationships from observational data
Causal inference– Do calculus
Judea Pearl. Causality: Models, Reasoning, and Inference. Cambridge University Press, 2000.
X1 X2 … Xn-1 Xn
5.2 7.5 6.5 5.2
5.6 7.2 6.6 5.3
… … … … …
5.4 7.1 7.1 5.7
5.7 6.9 6.9 5.8
+1
+0.8
Methods
– IDA
– Maathuis, H. M.,
Colombo, D., Kalisch, M.,
and Buhlmann, P. (2010).
Predicting causal effects
in large-scale systems
from observational data.
Nature Methods, 7(4),
247–249.
5
6
Causal inference based approaches
• We also applied the causal inference method to
detect condition specific regulatory relationships
• The steps:
˗ Split samples into to two parts according to conditions
(cancer or normal)
˗ Detect causal regulatory relationships in each condition
˗ A relationship (miR_i, mR_j) detected in condition 1 but
not in condition 2 is specific to condition 1, and miR_i is
an active microRNA in condition 1
Causal inference based approaches
Knowledge + Data Mining
Idea from information retrieval
• Correspondence Latent Dirichlet Allocation
(Corr-LDA)
– Automatic annotations of images (Blei et al.
2004)
images
words
miRNAs
mRNAs
Model migration
11
FMRMs DependencyTopics
FMRMs
Generative process
12
• Each miRNA or mRNA is drawn from one of the
modules;
• Each sample is a random mixture of miRNAs and
mRNAs expressed in different modules;
• Samples may associate with multiple functional
modules;
Results
13
FMRM# c x Mouse model class Tumor subtype p-value
3 10 3 C3TAg Basal 0.0081
4 8 3 MMTV_Wnt Luminal 0.004
5 10 3 Hras Luminal 0.0081
6 14 3 p53 Basal 0.0222
11 10 3 C3TAg Basal 0.0081
13 14 3 p53 Basal 0.0222
19 10 3 BRCA_p53 Basal 0.0081
Causal inference based approaches

Bioinformatics

  • 1.
    Mining complex relationships •Data mining heterogeneous sources for many to many relationships. • CCB (Center for Cancer Biology) – Regulatory relationships between microRNAs, transcription factors, and genes. – Data sources: • DNA sequences • Gene expression data • Multiple labs • Domain knowledge. • One ARC project
  • 2.
    • Causal inference •Discovery of group-group relationships Heterogeneous data Inferring miRNA-mRNA regulatory relationships Gene regulatory relationships
  • 3.
    Causal inference basedapproaches Why interested in causal relationships? • Gene regulatory relationships are causal by nature • Most existing work identifies only statistical associations/correlations Gene C Gene A Gene B What’s the catch? • Gold standard of causal discovery is controlled random trials • RCTs are expensive and not always possible • We want to discover causal relationships from observational data
  • 4.
    Causal inference– Docalculus Judea Pearl. Causality: Models, Reasoning, and Inference. Cambridge University Press, 2000. X1 X2 … Xn-1 Xn 5.2 7.5 6.5 5.2 5.6 7.2 6.6 5.3 … … … … … 5.4 7.1 7.1 5.7 5.7 6.9 6.9 5.8 +1 +0.8
  • 5.
    Methods – IDA – Maathuis,H. M., Colombo, D., Kalisch, M., and Buhlmann, P. (2010). Predicting causal effects in large-scale systems from observational data. Nature Methods, 7(4), 247–249. 5
  • 6.
  • 7.
    Causal inference basedapproaches • We also applied the causal inference method to detect condition specific regulatory relationships • The steps: ˗ Split samples into to two parts according to conditions (cancer or normal) ˗ Detect causal regulatory relationships in each condition ˗ A relationship (miR_i, mR_j) detected in condition 1 but not in condition 2 is specific to condition 1, and miR_i is an active microRNA in condition 1
  • 8.
  • 9.
  • 10.
    Idea from informationretrieval • Correspondence Latent Dirichlet Allocation (Corr-LDA) – Automatic annotations of images (Blei et al. 2004)
  • 11.
  • 12.
    Generative process 12 • EachmiRNA or mRNA is drawn from one of the modules; • Each sample is a random mixture of miRNAs and mRNAs expressed in different modules; • Samples may associate with multiple functional modules;
  • 13.
    Results 13 FMRM# c xMouse model class Tumor subtype p-value 3 10 3 C3TAg Basal 0.0081 4 8 3 MMTV_Wnt Luminal 0.004 5 10 3 Hras Luminal 0.0081 6 14 3 p53 Basal 0.0222 11 10 3 C3TAg Basal 0.0081 13 14 3 p53 Basal 0.0222 19 10 3 BRCA_p53 Basal 0.0081
  • 14.
  • 15.

Editor's Notes

  • #5 X causes Y iff there is some manipulation of X leading to a change in the probability distribution of Y. (Judea Pearl, 2000; Neapolitan, 2003)
  • #6 Completed Partially Directed Acyclic Graph
  • #11 Correspond -> correspondence May say: what’s given (input), what’s to be obtained (output), how (rough idea) – may use a diagram ?
  • #13 May be swap the three dot points around so the flow is like: Assume that functional modules exist -> then each sample is obtained by drawing miRNAs and mRNAs from the modules (so a sample is a random mixture ...) Not quite sure where to put the first dot point
  • #14 Assigning biological conditions to FMRMs. The y-axis on the right side of the figure denotes sample names, mouse model types, and breast cancer subtypes in three columns. Using the parameter , the likelihood that a particular sample is associated with a specific module, the top 5% samples associated with each module are displayed using the grey scale. These samples are considered to map modules to biological conditions. Samples may occur more than once in the y-axis because some samples are significantly associated with more than one module. Some modules, such as module-11, have only rather low probability of association with samples, and thus have nearly white shading even for their top 5 samples. Significant mapping of FMRMs to conditions is highlighted.