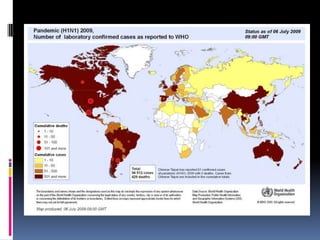
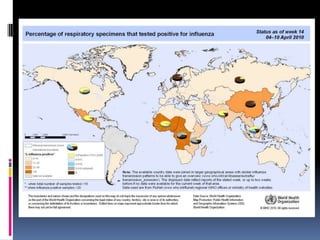
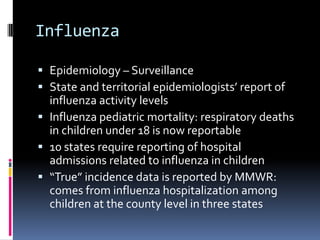
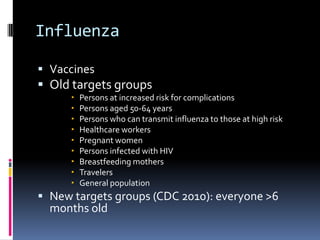
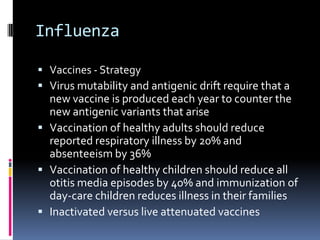
2. Influenza Clinical Features Abrupt onset of fever and respiratory symptoms, including cough, rhinorrhea and sore throat Myalgia and headache are more common w/ influenza than with other respiratory infections Malaise Prostration GI symptoms not common in adults, but 50% of infant and child infections may have vomiting, abdominal pain and diarrhea Usually lasts 3 to 5 days, but complications can prolong the illness in the elderly and people with chronic illnesses
3. Influenza Clinical Features – Complications: Some patients can develop primary influenza viral pneumonia, which can be fatal (uncommon) Secondary bacterial pneumonia may occur up to two weeks after the acute viral infection In infants and children, otitis media and croup are common complications Myocarditis, myositis and encephalitis are less frequent complications
5. Influenza Transmission Spread through respiratory secretions of infected individuals (may contain up to 105 virus particles/mL) Infectious aerosols are generated during coughing, sneezing and talking Infectious secretions are also spread by direct (e.g. kissing) or indirect (e.g. nose-finger-doorknob) contact with respiratory mucosa
6.
7.
8. Influenza Transmission The inhaled virus attaches to columnar epithelial cells of the upper respiratory tract and initiates a new infection Incubation period is from 1 to 4 days Infected hosts are capable of transmitting the virus from shortly before the onset of clinical disease up to the 4th or 5th day of illness
9.
10. Influenza Diagnosis Cannot be diagnosed from clinical signs or symptoms Only viral culture or serology can definitely identify the presence of influenza virus
12. Influenza The Virus A, B, and C types Type A Hemagglutinin (HA) and neuraminidase (NA) are surface glycoproteins that are important in both pathogenesis and immune protection from infection: subtypes of influenza A virus are determined by these two surface antigens
13. Influenza Type A virus HA functions as the attachment protein to gylcoproteins on columnar epithelial cells of the respiratory tract Specific antibodies to HA epitopes prevent attachment and entry of the influenza virus into the host cells HA specificity for receptor binding is a determinant of which species can be infected (host range) HA is a virulence determinant NA cleaves sialic acid residues to allow virus release from the host epithelial cell Specific anti-NA antibody presumably diminishes release of virions from host cells
14. Influenza Mechanisms of Antigenic Variation (most relevant to A type virus) A little background: RNA viruses are low-fidelity, i.e. high rate of spontaneous mutation Influenza A is segmented, which contributes even more to it’s low-fidelity
15. Influenza Mechanisms of Antigenic Variation Antigenic drift: The minor yet frequent genetic changes in the HA and NA surface antigens There is roughly a 1% change in the amino acid composition of the HA antigen per year
16. Influenza Mechanisms of Antigenic Variation Antigenic shift: Major changes in the HA or NA surface antigens, or both, lead to a new subtype It is believed that after several decades (typically between 10 and 30 years) of circulation of a specific A subtype, most members of the population will have antibody to that subtype This produces selective pressure on the virus and leads to new shift variants
17. Influenza Epidemiology – Annual Epidemics Follow predictable pattern In North America, usually occur between November and March: manifested first by high rates of school and industrial absenteeism, followed by an increase in visits to health care facilities, an increase in pneumonia and influenza hospital admissions, and finally an increase in deaths from pneumonia or influenza In any specific locality epidemic influenza often begins abruptly, reaches a peak within three weeks, and usually ends by 8 weeks A city or region can experience two sequential or overlapping epidemics with different strains of viruses in a single winter
18. Influenza Epidemiology – Annual Epidemics In the southern hemisphere, epidemics usually occur in the May to Sept. winter season; northern, Oct. to May In tropics, local/regional disease seasonality can follow the monsoons (or year-round isolation of virus may be observed) Winter season viral spread is thought to be favored by the fact that the virus survives better in environments of lower temperature and humidity In tropical areas, however, viral spread during the monsoon season suggests that indoor crowding caused by the weather may be a more important factor in such regions
19.
20.
21. Influenza Epidemiology – Annual Epidemics In general, rates of infection are higher in infants and children than adults, and rates of hospitalization are highest in infants and lower in children and high in the elderly Families with children have the highest rates of infection Therefore, relatively immunologically naïve children are important in the spread of epidemic strains
22. Influenza Epidemiology – Annual Epidemics Each epidemic varies in size and impact, determined by the degree of antigenic variation of the new virus, its virulence, and the level of existing protective immunity in the infected population During average epidemics in North America, attack rates are generally between 10% and 20% in large populations, however certain subpopulations (school children, nursing home residents) and local outbreaks can have attack rates of 40% to 50%.
23. Influenza Epidemiology – Annual Epidemics Incidence is very difficult to measure because most people infected do not present to a hospital or clinician, and not all people with influenza-like illness have the flu Nevertheless, CDC estimates between 35 and 50 million cases each year in the United States Accurate global estimates would be near impossible to produce
24. Influenza Epidemiology – Annual Epidemics Over 20,000 influenza-associated excess deaths occurred in the US during each of nine epidemics between 1972 and 1991, and more than 40,000 deaths occurred during three of them Annual winter increase in all mortality is substantially due to influenza People aged 65 years or older account for 90% of the excess deaths associated with annual epidemics Since the 1990s, influenza has been associated with an average of 226,000 hospitalizations per year in the US
25. Influenza Epidemiology– Pandemics These are shift events Five in the last 100 years: 1918 H1N1 – the most catastrophic, with a 20% case-fatality and killing between 50 and 100 million people worldwide 1957 H1N1 to H2N2 1968 H2N2 to H3N2 1977 H1N1 reappeared causing 50% attack rates in people born after 1956 Until 2009 the old H1N1 and H3N2 subtypes co-circulated the world together 2009 new H1N1 replaces previous subtypes
26. Influenza Epidemiology– Surveillance Sentinel physician surveillance network: apprx 1000 physicians across the US record the total # of patients seen and the total with influenza-like illness from Oct-May Collaborating lab surveillance system: 75 WHO labs and 50 US labs record the total # of specimens received respiratory virus testing, and the total # positive influenza isolates The 122-city mortality reporting system: % of deaths listed with pneumonia or influenza
27. Influenza Epidemiology – Surveillance State and territorial epidemiologists’ report of influenza activity levels Influenza pediatric mortality: respiratory deaths in children under 18 is now reportable 10 states require reporting of hospital admissions related to influenza in children “True” incidence data is reported by MMWR: comes from influenza hospitalization among children at the county level in three states
28. Influenza Epizootic Infections and Evolutionary History Birds – water fowl Pigs – epithelial receptors for both avian and human HA antigen Humans – unstable subtypes
30. Influenza Vaccines Old targets groups Persons at increased risk for complications Persons aged 50-64 years Persons who can transmit influenza to those at high risk Healthcare workers Pregnant women Persons infected with HIV Breastfeeding mothers Travelers General population New targets groups (CDC 2010): everyone >6 months old
31. Influenza Vaccines - Strategy Virus mutability and antigenic drift require that a new vaccine is produced each year to counter the new antigenic variants that arise Vaccination of healthy adults should reduce reported respiratory illness by 20% and absenteeism by 36% Vaccination of healthy children should reduce all otitis media episodes by 40% and immunization of day-care children reduces illness in their families Inactivated versus live attenuated vaccines
32. Influenza Anti-viral drugs (eg. Oseltamivir) Can limit disease in persons infected Can limit the spread of infection among those who are infectious