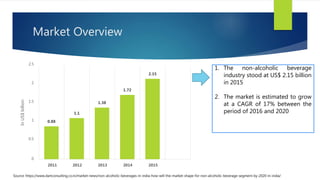
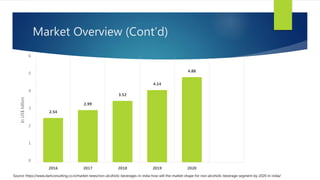
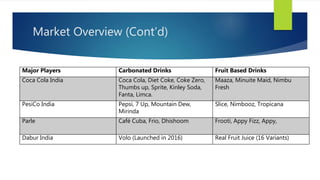
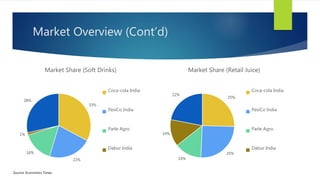
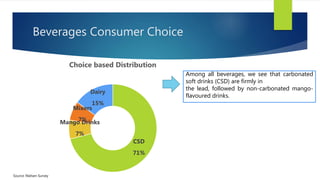
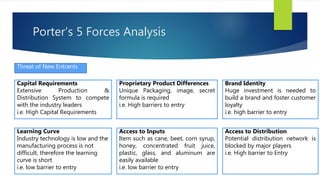
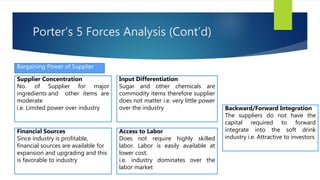
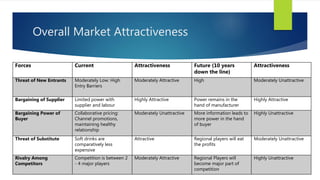
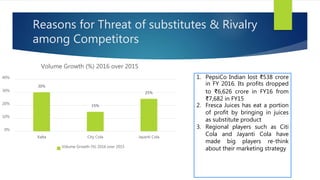
Indian Cold Beverage
Market Attractiveness
PREPARED BY: SUMEET PAREEK
SUBJECT: STRATEGIC MANAGEMENT
Outline
Market
Overview
1.
Beverages
Consumer
Choice
2.
Porter’s 5
Forces
Analysis
3.
Overall
Market
Attractiveness
4.
Market Overview
0.88
1.1
1.38
1.72
2.15
0
0.5
1
1.5
2
2.5
2011 2012 2013 2014 2015
InUS$billion
1. The non-alcoholic beverage
industry stood at US$ 2.15 billion
in 2015
2. The market is estimated to grow
at a CAGR of 17% between the
period of 2016 and 2020
Source: https://www.dartconsulting.co.in/market-news/non-alcoholic-beverages-in-india-how-will-the-market-shape-for-non-alcoholic-beverage-segment-by-2020-in-india/
Market Overview (Cont’d)
2.54
2.99
3.52
4.14
4.88
0
1
2
3
4
5
6
2016 2017 2018 2019 2020
InUS$billion
Source: https://www.dartconsulting.co.in/market-news/non-alcoholic-beverages-in-india-how-will-the-market-shape-for-non-alcoholic-beverage-segment-by-2020-in-india/
Market Overview (Cont’d)
Major Players Carbonated Drinks Fruit Based Drinks
Coca Cola India Coca Cola, Diet Coke, Coke Zero,
Thumbs up, Sprite, Kinley Soda,
Fanta, Limca.
Maaza, Minuite Maid, Nimbu
Fresh
PesiCo India Pepsi, 7 Up, Mountain Dew,
Mirinda
Slice, Nimbooz, Tropicana
Parle Café Cuba, Frio, Dhishoom Frooti, Appy Fizz, Appy,
Dabur India Volo (Launched in 2016) Real Fruit Juice (16 Variants)
Market Overview (Cont’d)
33%
22%
16%
1%
28%
Market Share (Soft Drinks)
Coca-cola India
PesiCo India
Parle Agro
Dabur India
25%
25%
14%
14%
22%
Market Share (Retail Juice)
Coca-cola India
PesiCo India
Parle Agro
Dabur India
Source: Economics Times
Beverages Consumer Choice
CSD
71%
Mango Drinks
7%
Mixers
7%
Dairy
15%
Choice based Distribution
Among all beverages, we see that carbonated
soft drinks (CSD) are firmly in
the lead, followed by non-carbonated mango-
flavoured drinks.
Source: Nielsen Survey
Porter’s 5 Forces Analysis
Threat of New Entrants
Capital Requirements
Extensive Production &
Distribution System to compete
with the industry leaders
i.e. High Capital Requirements
Proprietary Product Differences
Unique Packaging, image, secret
formula is required
i.e. High barriers to entry
Learning Curve
Industry technology is low and the
manufacturing process is not
difficult, therefore the learning
curve is short
i.e. low barrier to entry
Access to Inputs
Item such as cane, beet, corn syrup,
honey, concentrated fruit juice,
plastic, glass, and aluminum are
easily available
i.e. low barrier to entry
Brand Identity
Huge investment is needed to
build a brand and foster customer
loyalty
i.e. high barrier to entry
Access to Distribution
Potential distribution network is
blocked by major players
i.e. High barrier to Entry
Bargaining Power of Supplier
Supplier Concentration
No. of Supplier for major
ingredients and other items are
moderate
i.e. Limited power over industry
Input Differentiation
Sugar and other chemicals are
commodity items therefore supplier
does not matter i.e. very little power
over the industry
Financial Sources
Since industry is profitable,
financial sources are available for
expansion and upgrading and this
is favorable to industry
Backward/Forward Integration
The suppliers do not have the
capital required to forward
integrate into the soft drink
industry i.e. Attractive to investors
Access to Labor
Does not require highly skilled
labor. Labor is easily available at
lower cost.
i.e. industry dominates over the
labor market
Porter’s 5 Forces Analysis (Cont’d)
Bargaining Power of Buyer
Buyer Information
Flow of information from
manufacturer to distributer and
down to retailer that leads to the
collaborative pricing
Threat of backward Integration
As distributors are specialized in the
transportation and promotion of
the product, it is moderately low
Price to Total Purchase
Manufacturer relies on the
distributor to represent at the
local level and maintain healthy
relationship
i.e. Buyer power is moderately
high
Porter’s 5 Forces Analysis (Cont’d)
Threat of Substitute Product
Till 2016
Though Fruit juices, sports drink,
energy drink might act as a
substitute product, yet soft drinks
were comparatively less expensive
and threat of substitute product
was moderately low
As of 2017
Small beverages regional players
such as Fresca Juices have really
affected the revenues of leading
brands such as Coca-cola and
PepsiCo
i.e. Presently threat of substitute
product is very high
Porter’s 5 Forces Analysis (Cont’d)
Rivalry among Competitors
Diversity Among Competitors
Low level of product diversity
makes the soft drink industry
unattractive for investors
Industry Growth Rate
With high growth rate it can be said
that this industry is moderately
attractive for investors
Porter’s 5 Forces Analysis (Cont’d)
Overall Market Attractiveness
Forces Current Attractiveness Future (10 years
down the line)
Attractiveness
Threat of New Entrants Moderately Low: High
Entry Barriers
Moderately Attractive High Moderately Unattractive
Bargaining of Supplier Limited power with
supplier and labour
Highly Attractive Power remains in the
hand of manufacturer
Highly Attractive
Bargaining Power of
Buyer
Collaborative pricing:
Channel promotions,
maintaining healthy
relationship
Moderately Unattractive More information leads to
more power in the hand
of buyer
Highly Unattractive
Threat of Substitute Soft drinks are
comparatively less
expensive
Attractive Regional players will eat
the profits
Moderately Unattractive
Rivalry Among
Competitors
Competition is between 2
- 4 major players
Moderately Attractive Regional Players will
become major part of
competition
Highly Unattractive
Reasons for Threat of substitutes & Rivalry
among Competitors
1. PepsiCo Indian lost ₹538 crore
in FY 2016. Its profits dropped
to ₹6,626 crore in FY16 from
₹7,682 in FY15
2. Fresca Juices has eat a portion
of profit by bringing in juices
as substitute product
3. Regional players such as Citi
Cola and Jayanti Cola have
made big players re-think
about their marketing strategy
30%
15%
25%
0%
10%
20%
30%
40%
Xalta City Cola Jayanti Cola
Volume Growth (%) 2016 over 2015
Thank you !
Queries ?

Indian cold beverage (Porter Five Forces Analysis)

  • 1.
    Indian Cold Beverage MarketAttractiveness PREPARED BY: SUMEET PAREEK SUBJECT: STRATEGIC MANAGEMENT
  • 2.
  • 3.
    Market Overview 0.88 1.1 1.38 1.72 2.15 0 0.5 1 1.5 2 2.5 2011 20122013 2014 2015 InUS$billion 1. The non-alcoholic beverage industry stood at US$ 2.15 billion in 2015 2. The market is estimated to grow at a CAGR of 17% between the period of 2016 and 2020 Source: https://www.dartconsulting.co.in/market-news/non-alcoholic-beverages-in-india-how-will-the-market-shape-for-non-alcoholic-beverage-segment-by-2020-in-india/
  • 4.
    Market Overview (Cont’d) 2.54 2.99 3.52 4.14 4.88 0 1 2 3 4 5 6 20162017 2018 2019 2020 InUS$billion Source: https://www.dartconsulting.co.in/market-news/non-alcoholic-beverages-in-india-how-will-the-market-shape-for-non-alcoholic-beverage-segment-by-2020-in-india/
  • 5.
    Market Overview (Cont’d) MajorPlayers Carbonated Drinks Fruit Based Drinks Coca Cola India Coca Cola, Diet Coke, Coke Zero, Thumbs up, Sprite, Kinley Soda, Fanta, Limca. Maaza, Minuite Maid, Nimbu Fresh PesiCo India Pepsi, 7 Up, Mountain Dew, Mirinda Slice, Nimbooz, Tropicana Parle Café Cuba, Frio, Dhishoom Frooti, Appy Fizz, Appy, Dabur India Volo (Launched in 2016) Real Fruit Juice (16 Variants)
  • 6.
    Market Overview (Cont’d) 33% 22% 16% 1% 28% MarketShare (Soft Drinks) Coca-cola India PesiCo India Parle Agro Dabur India 25% 25% 14% 14% 22% Market Share (Retail Juice) Coca-cola India PesiCo India Parle Agro Dabur India Source: Economics Times
  • 7.
    Beverages Consumer Choice CSD 71% MangoDrinks 7% Mixers 7% Dairy 15% Choice based Distribution Among all beverages, we see that carbonated soft drinks (CSD) are firmly in the lead, followed by non-carbonated mango- flavoured drinks. Source: Nielsen Survey
  • 8.
    Porter’s 5 ForcesAnalysis Threat of New Entrants Capital Requirements Extensive Production & Distribution System to compete with the industry leaders i.e. High Capital Requirements Proprietary Product Differences Unique Packaging, image, secret formula is required i.e. High barriers to entry Learning Curve Industry technology is low and the manufacturing process is not difficult, therefore the learning curve is short i.e. low barrier to entry Access to Inputs Item such as cane, beet, corn syrup, honey, concentrated fruit juice, plastic, glass, and aluminum are easily available i.e. low barrier to entry Brand Identity Huge investment is needed to build a brand and foster customer loyalty i.e. high barrier to entry Access to Distribution Potential distribution network is blocked by major players i.e. High barrier to Entry
  • 9.
    Bargaining Power ofSupplier Supplier Concentration No. of Supplier for major ingredients and other items are moderate i.e. Limited power over industry Input Differentiation Sugar and other chemicals are commodity items therefore supplier does not matter i.e. very little power over the industry Financial Sources Since industry is profitable, financial sources are available for expansion and upgrading and this is favorable to industry Backward/Forward Integration The suppliers do not have the capital required to forward integrate into the soft drink industry i.e. Attractive to investors Access to Labor Does not require highly skilled labor. Labor is easily available at lower cost. i.e. industry dominates over the labor market Porter’s 5 Forces Analysis (Cont’d)
  • 10.
    Bargaining Power ofBuyer Buyer Information Flow of information from manufacturer to distributer and down to retailer that leads to the collaborative pricing Threat of backward Integration As distributors are specialized in the transportation and promotion of the product, it is moderately low Price to Total Purchase Manufacturer relies on the distributor to represent at the local level and maintain healthy relationship i.e. Buyer power is moderately high Porter’s 5 Forces Analysis (Cont’d)
  • 11.
    Threat of SubstituteProduct Till 2016 Though Fruit juices, sports drink, energy drink might act as a substitute product, yet soft drinks were comparatively less expensive and threat of substitute product was moderately low As of 2017 Small beverages regional players such as Fresca Juices have really affected the revenues of leading brands such as Coca-cola and PepsiCo i.e. Presently threat of substitute product is very high Porter’s 5 Forces Analysis (Cont’d)
  • 12.
    Rivalry among Competitors DiversityAmong Competitors Low level of product diversity makes the soft drink industry unattractive for investors Industry Growth Rate With high growth rate it can be said that this industry is moderately attractive for investors Porter’s 5 Forces Analysis (Cont’d)
  • 13.
    Overall Market Attractiveness ForcesCurrent Attractiveness Future (10 years down the line) Attractiveness Threat of New Entrants Moderately Low: High Entry Barriers Moderately Attractive High Moderately Unattractive Bargaining of Supplier Limited power with supplier and labour Highly Attractive Power remains in the hand of manufacturer Highly Attractive Bargaining Power of Buyer Collaborative pricing: Channel promotions, maintaining healthy relationship Moderately Unattractive More information leads to more power in the hand of buyer Highly Unattractive Threat of Substitute Soft drinks are comparatively less expensive Attractive Regional players will eat the profits Moderately Unattractive Rivalry Among Competitors Competition is between 2 - 4 major players Moderately Attractive Regional Players will become major part of competition Highly Unattractive
  • 14.
    Reasons for Threatof substitutes & Rivalry among Competitors 1. PepsiCo Indian lost ₹538 crore in FY 2016. Its profits dropped to ₹6,626 crore in FY16 from ₹7,682 in FY15 2. Fresca Juices has eat a portion of profit by bringing in juices as substitute product 3. Regional players such as Citi Cola and Jayanti Cola have made big players re-think about their marketing strategy 30% 15% 25% 0% 10% 20% 30% 40% Xalta City Cola Jayanti Cola Volume Growth (%) 2016 over 2015 Volume Growth (%) 2016 over 2015
  • 15.