Download as PDF, PPTX


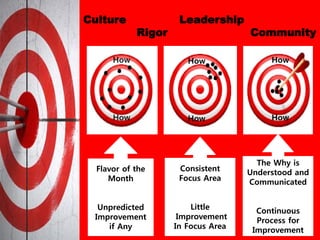


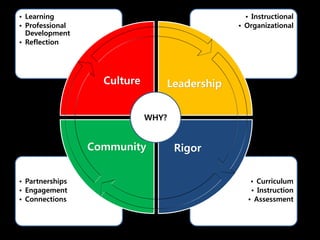


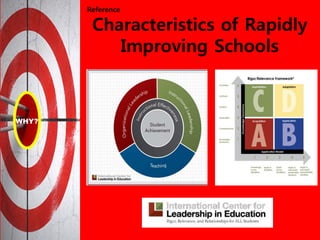


The document outlines strategies for school improvement, emphasizing the importance of intentionality in leadership, community engagement, and creating a supportive culture for learning. It highlights various methods for promoting educational awareness and the need for all stakeholders to understand their roles in the school's vision. Additionally, it underscores the significance of high-quality instruction and collaboration among educators as crucial factors for fostering student growth and success.