
Download to read offline


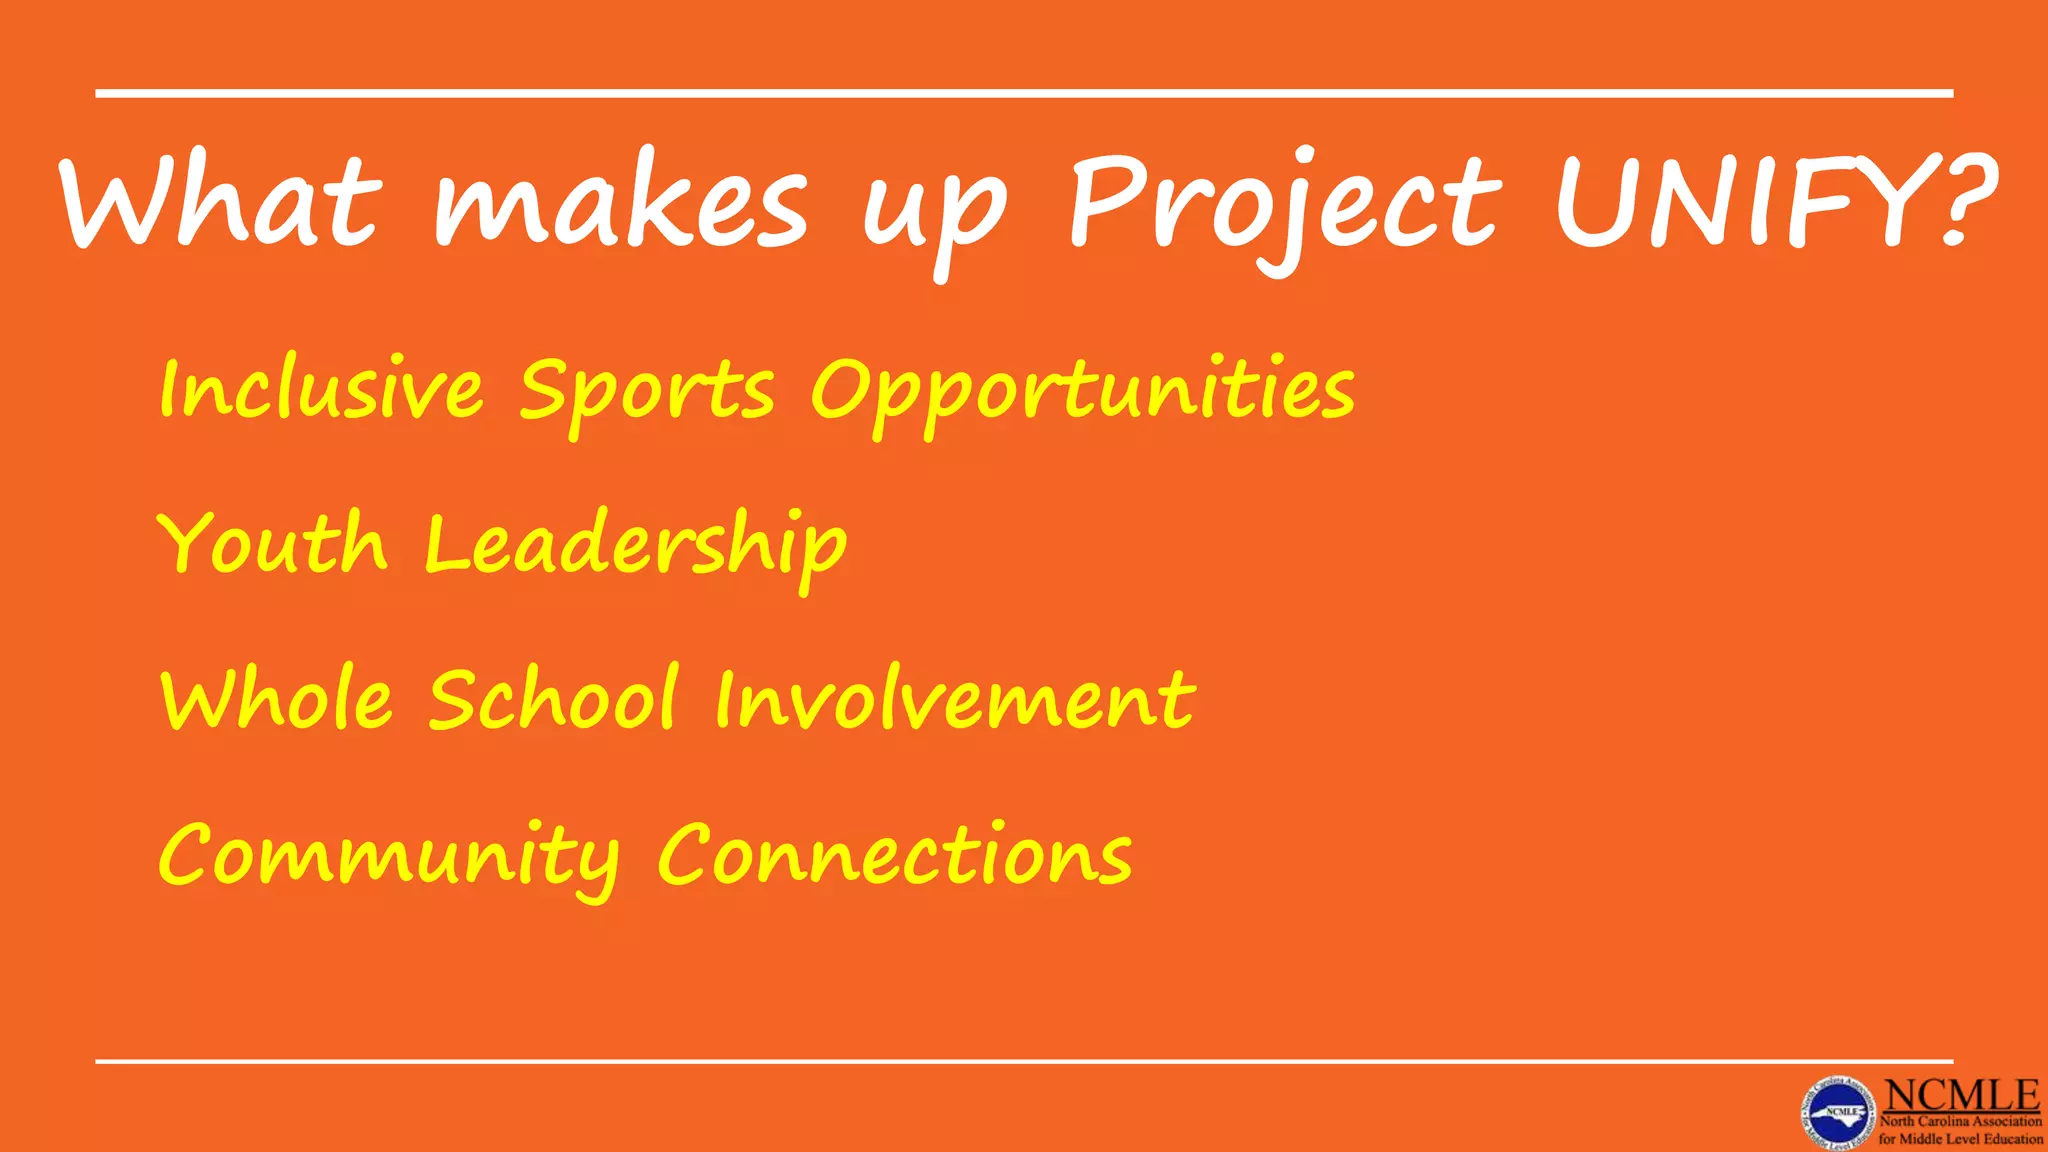

![3 Significant Factors from our Data
How close to Meeting Growth- LMS was at -2.72. In order to meet growth, we
needed to be at a minimum of -2.00. [We were -13.69 in 2012-13]
Number of teachers:
Exceeding- 4
Meeting- 23
Not Meeting- 8
Areas of strength and weakness:
Exceeded Growth in Science 6, Social Studies 8
Met Growth in Science 8
Negative growth in Reading 6 offset positive growth in grades 7 and 8; negative
growth in Math 7 offset growth in grades 6 and 8 math](https://image.slidesharecdn.com/ncmleconferencepresentationmarch2016-160314021920/75/Finally-We-Met-Growth-Again-11-2048.jpg)
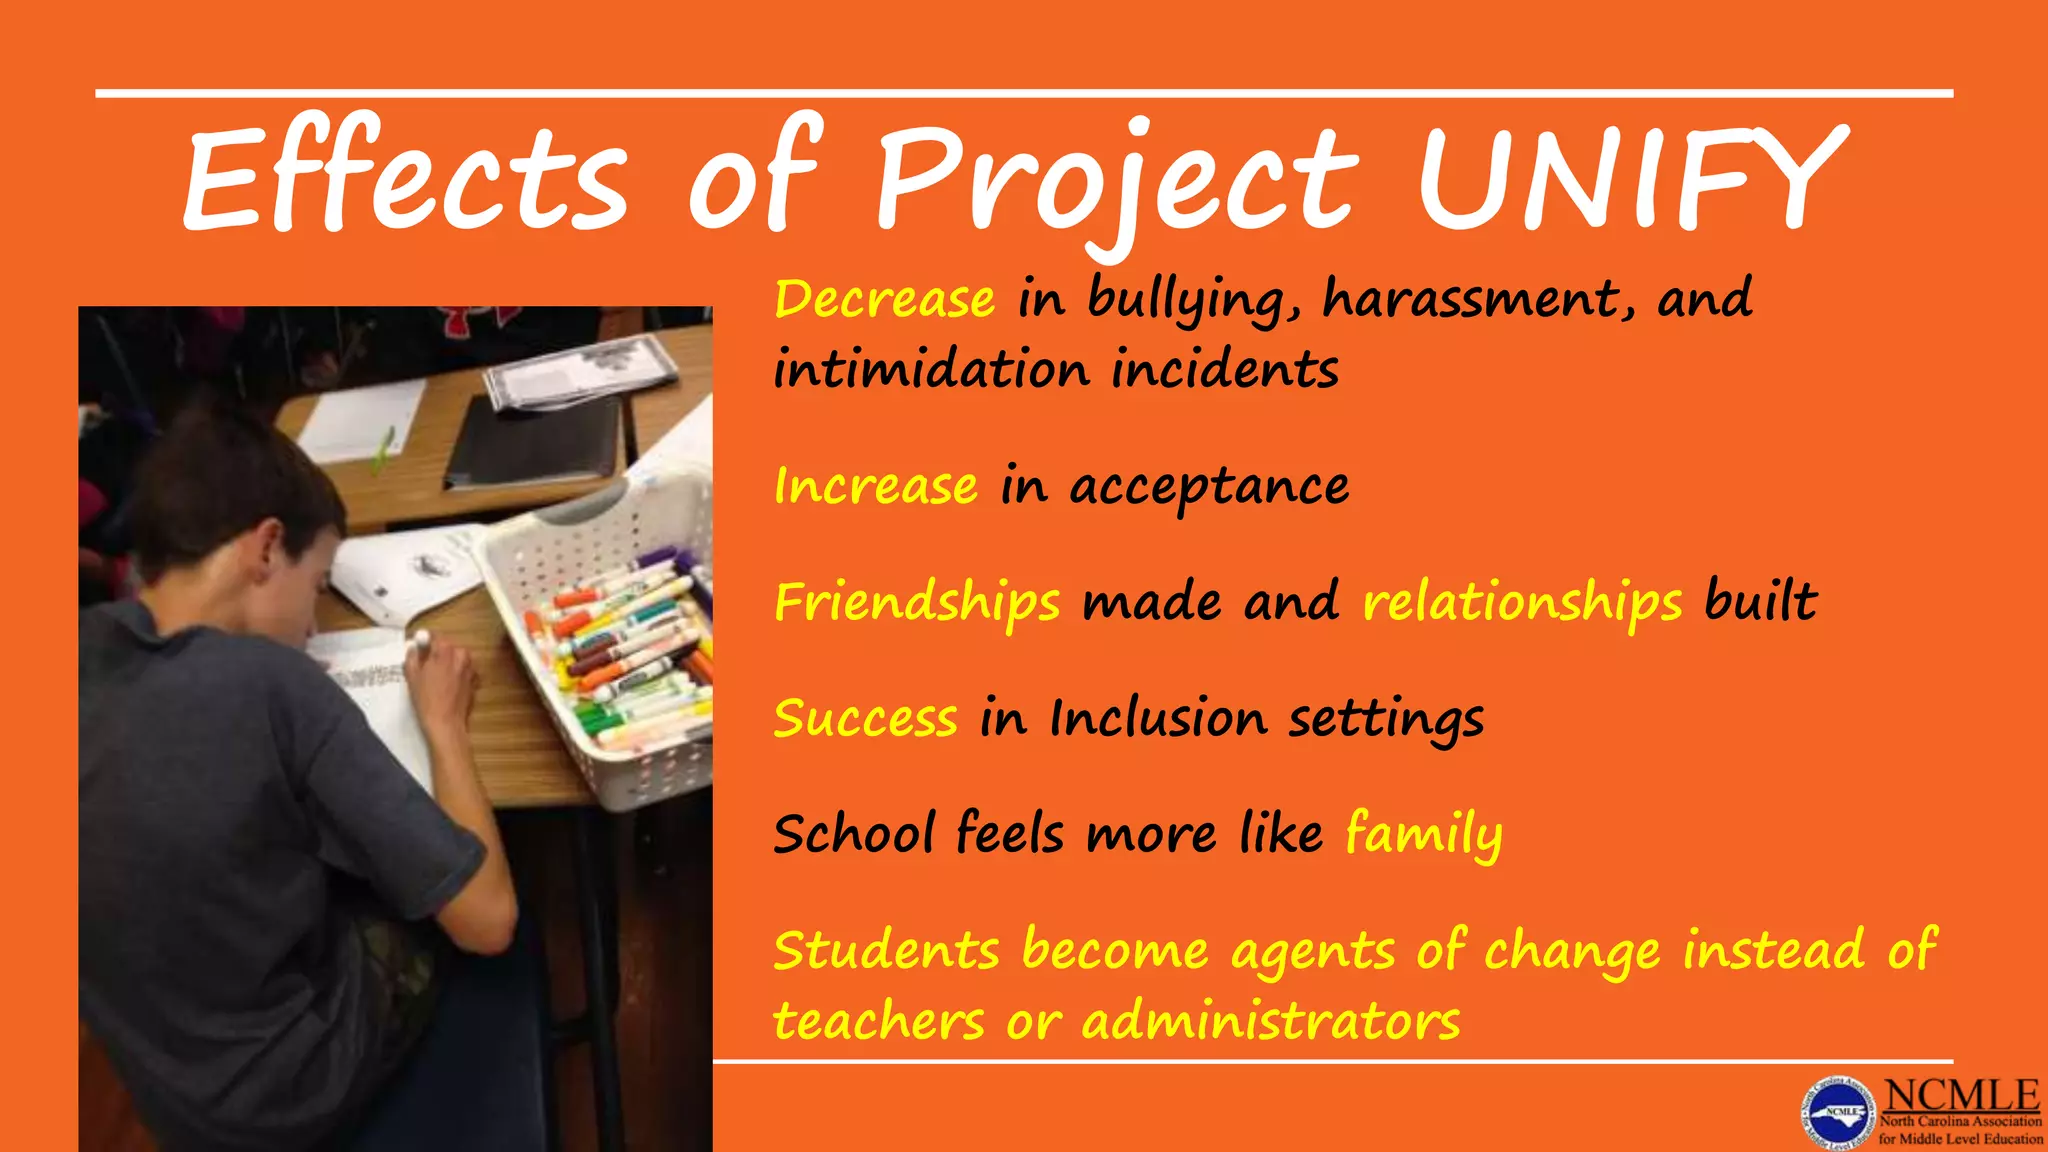
![Our Focus and SIP Adjustments
Instructional Focus of the Year
Critical thinking/problem
solving/higher order
questioning [help students
discern what is being asked in
the question so that they may
answer appropriately]
Using data more effectively to
adjust instruction
PBIS- complete Module 2
Adjustments to SIP since its
writing
Fine-tuning of the literacy has
occurred due to drilling into
EVAAS data, SRI and SMI
baseline data for the new year
Intent conversations about our
lesson planning format based
on training received through
the Learning Focused materials](https://image.slidesharecdn.com/ncmleconferencepresentationmarch2016-160314021920/75/Finally-We-Met-Growth-Again-13-2048.jpg)


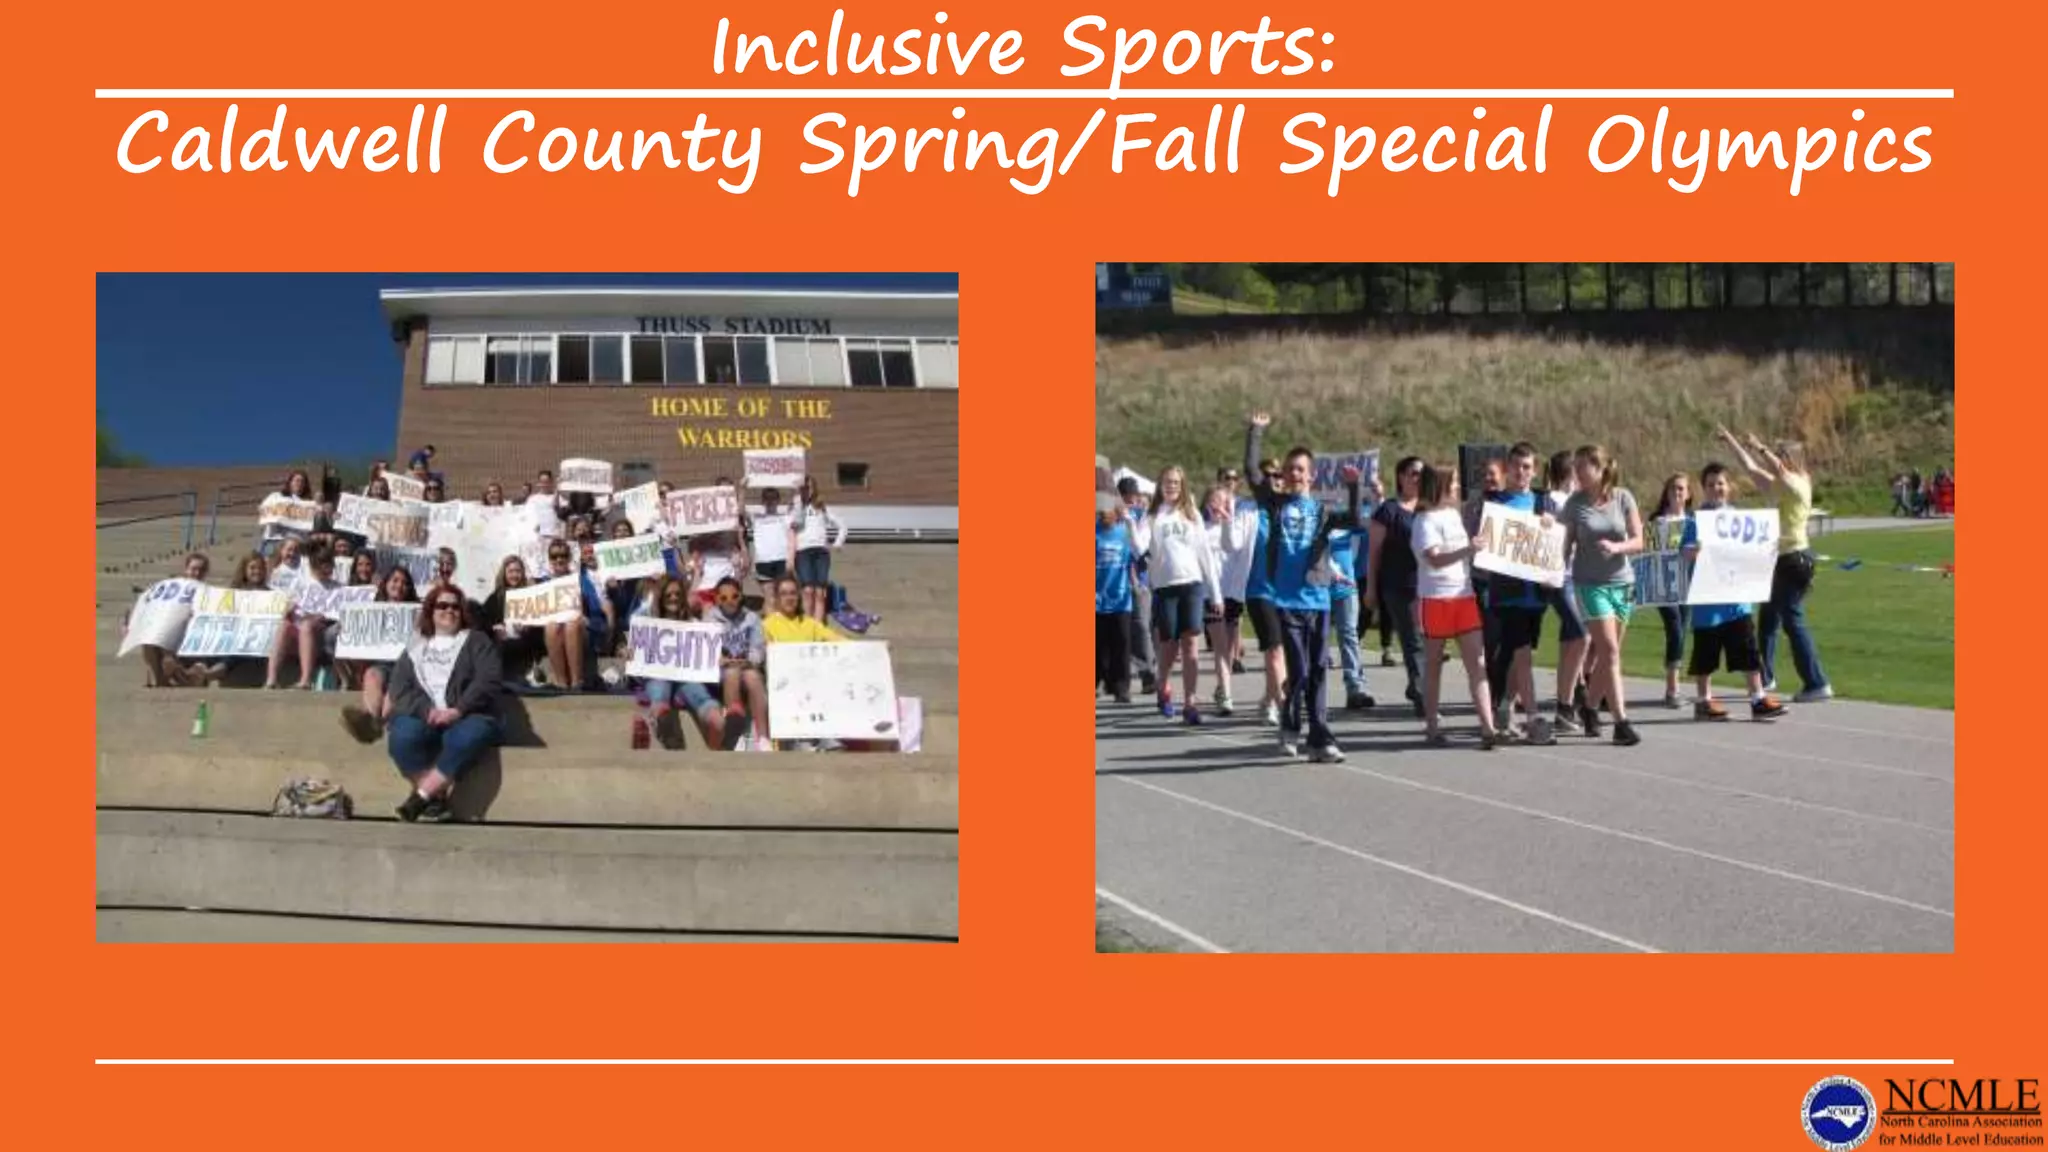


![Where did the reading growth come
from?
2013-14 AMO Targets
All- 38% (Not met)
Black- 22.8% (Not met)
Hispanic- 27.1% (Not met)
Multiple races- 51.4% (Met)
White- 47% (Not met)
EDS- 30.9% (Not met)
SWD- < 5% (Not met)
AIG- 94.1% (Met)
2014-15 AMO Targets
All- 40.5% (Not met) [+]
Black- 24.7% (Not met) [+]
Hispanic- 35.7% (Not met) [+]
Multiple races- 44.7% (Met) [-]
White- 48.9% (Not met) [+]
EDS- 30.0% (Not met) [-]
SWD- 9.4% (Not met) [+]
AIG- 91.5% (Met) [-]](https://image.slidesharecdn.com/ncmleconferencepresentationmarch2016-160314021920/75/Finally-We-Met-Growth-Again-19-2048.jpg)
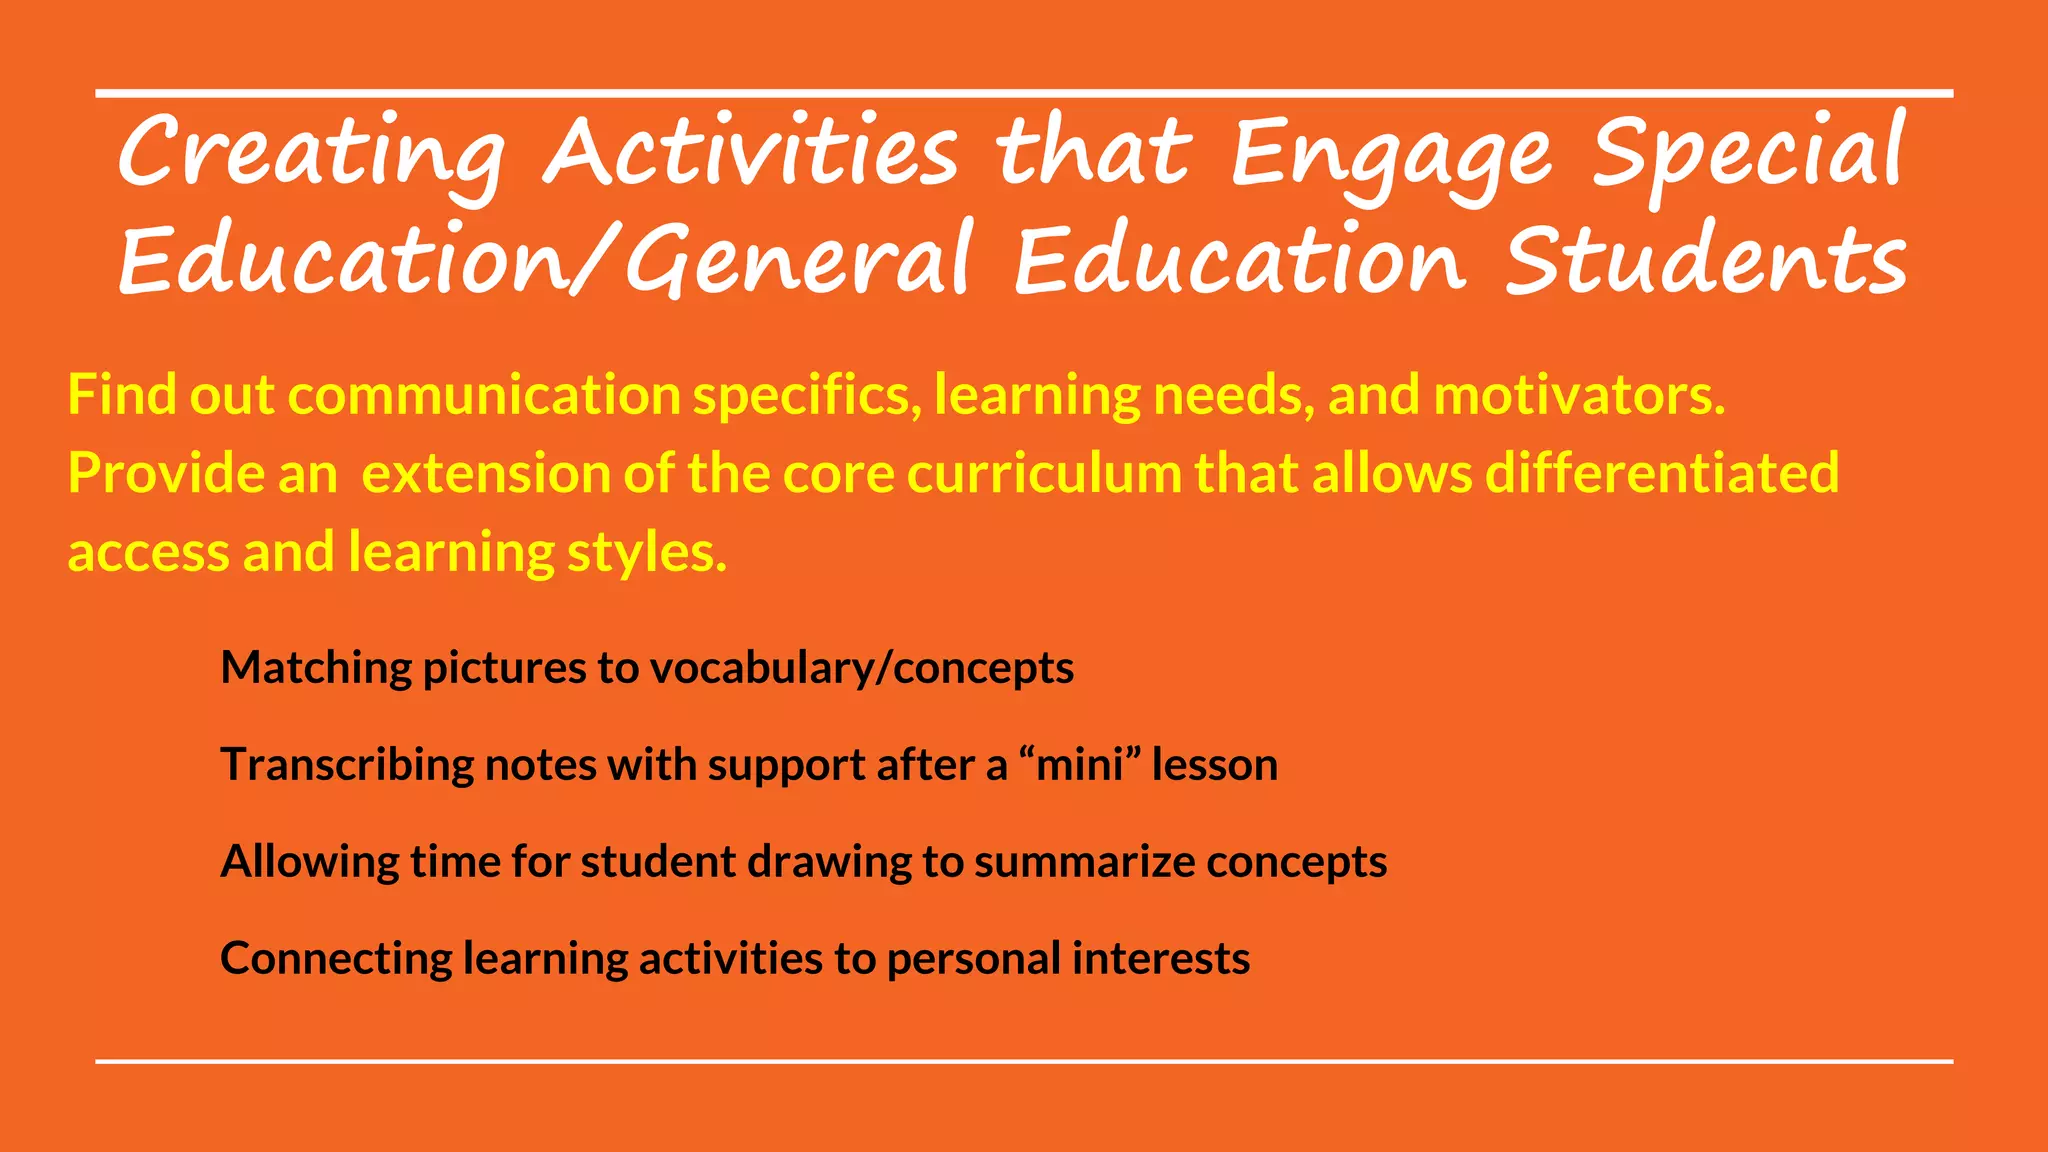
![Where did the math growth come
from?
2013-14 AMO Targets
All- 23.4% (Not met)
Black- 15.6% (Not met)
Hispanic- 18.7% (Not met)
Multiple races- 31.4% (Not met)
White- 27.8% (Not met)
EDS- 17.9% (Not met)
SWD- < 5% (Not met)
AIG- 79.4% (Not met)
2014-15 AMO Targets
All- 31.2% (Not met) [+]
Black- 18.8% (Not met) [+]
Hispanic- 22.3% (Not met) [+]
Multiple races- 28.4% (Not met) [-]
White-40% (Not met) [+]
EDS- 19.2% (Not met) [+]
SWD- < 5% (Not met) [same]
AIG- 85.4% (Met) [+]](https://image.slidesharecdn.com/ncmleconferencepresentationmarch2016-160314021920/75/Finally-We-Met-Growth-Again-20-2048.jpg)

Leland Middle School faced significant challenges in 2012-14, struggling with demographics and performance metrics, but implemented a comprehensive school improvement plan to address these issues. By 2014-15, the school showed progress, meeting growth with improvements in key subjects, particularly in science and reading, while addressing instructional strategies and teacher development. The ongoing focus on data-driven improvements and leadership development aims to continue enhancing student performance and confidence among staff.


![School Title 1 plan final[1]](https://cdn.slidesharecdn.com/ss_thumbnails/schooltitle1planfinal1-100827170125-phpapp02-thumbnail.jpg?width=640&height=640&fit=bounds)


