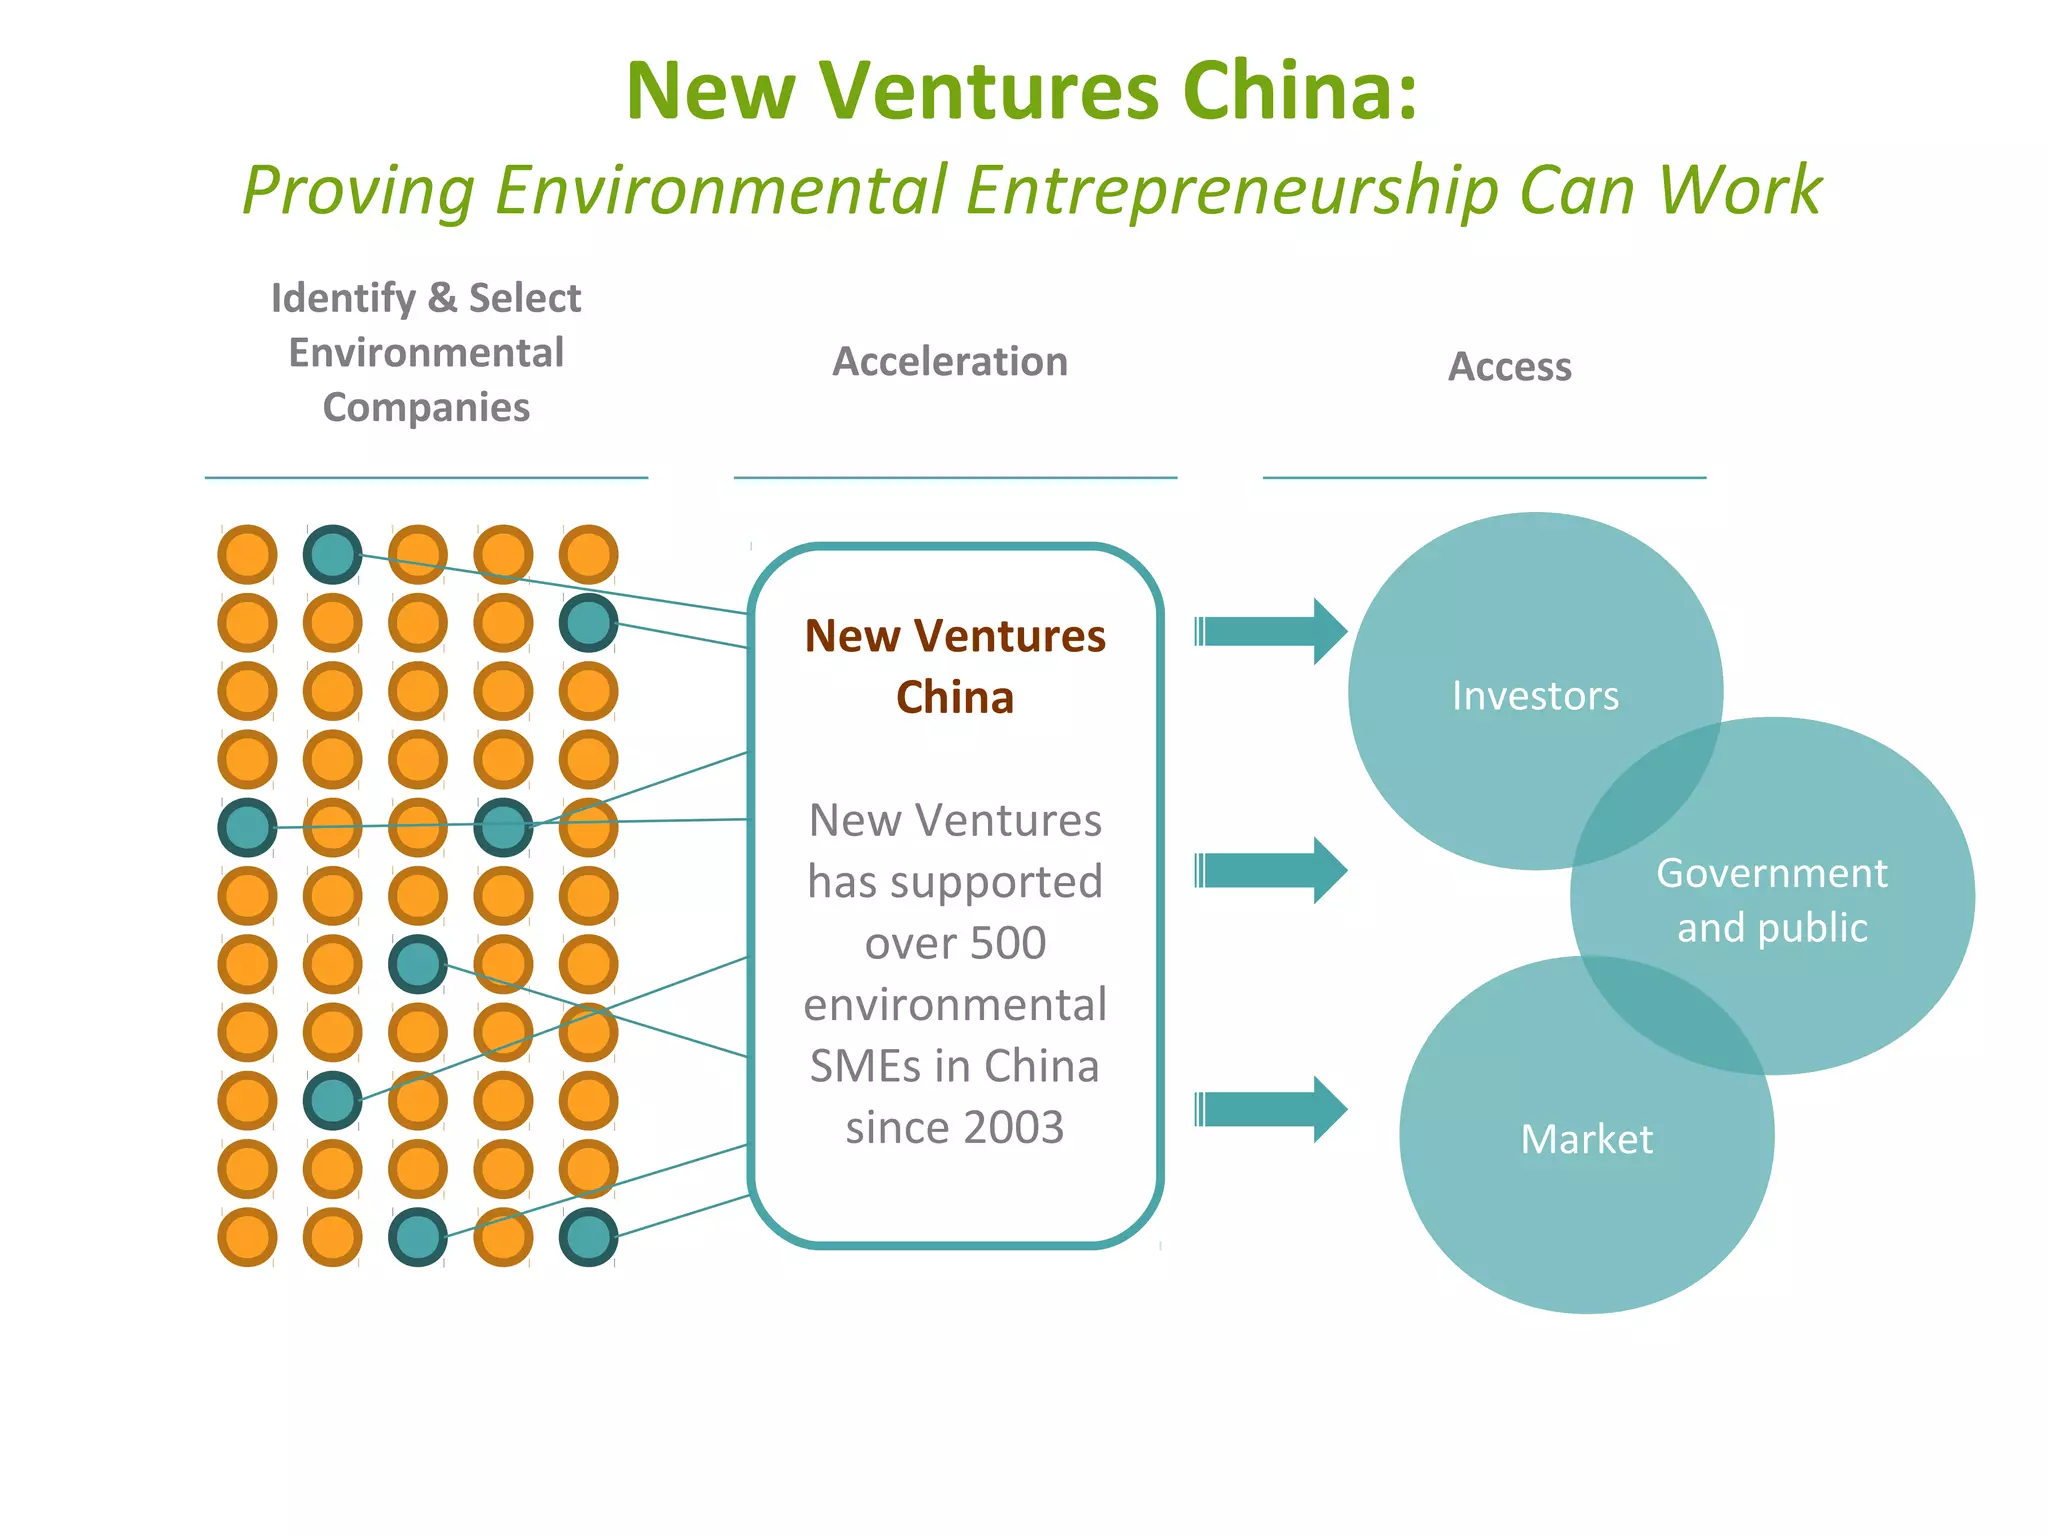
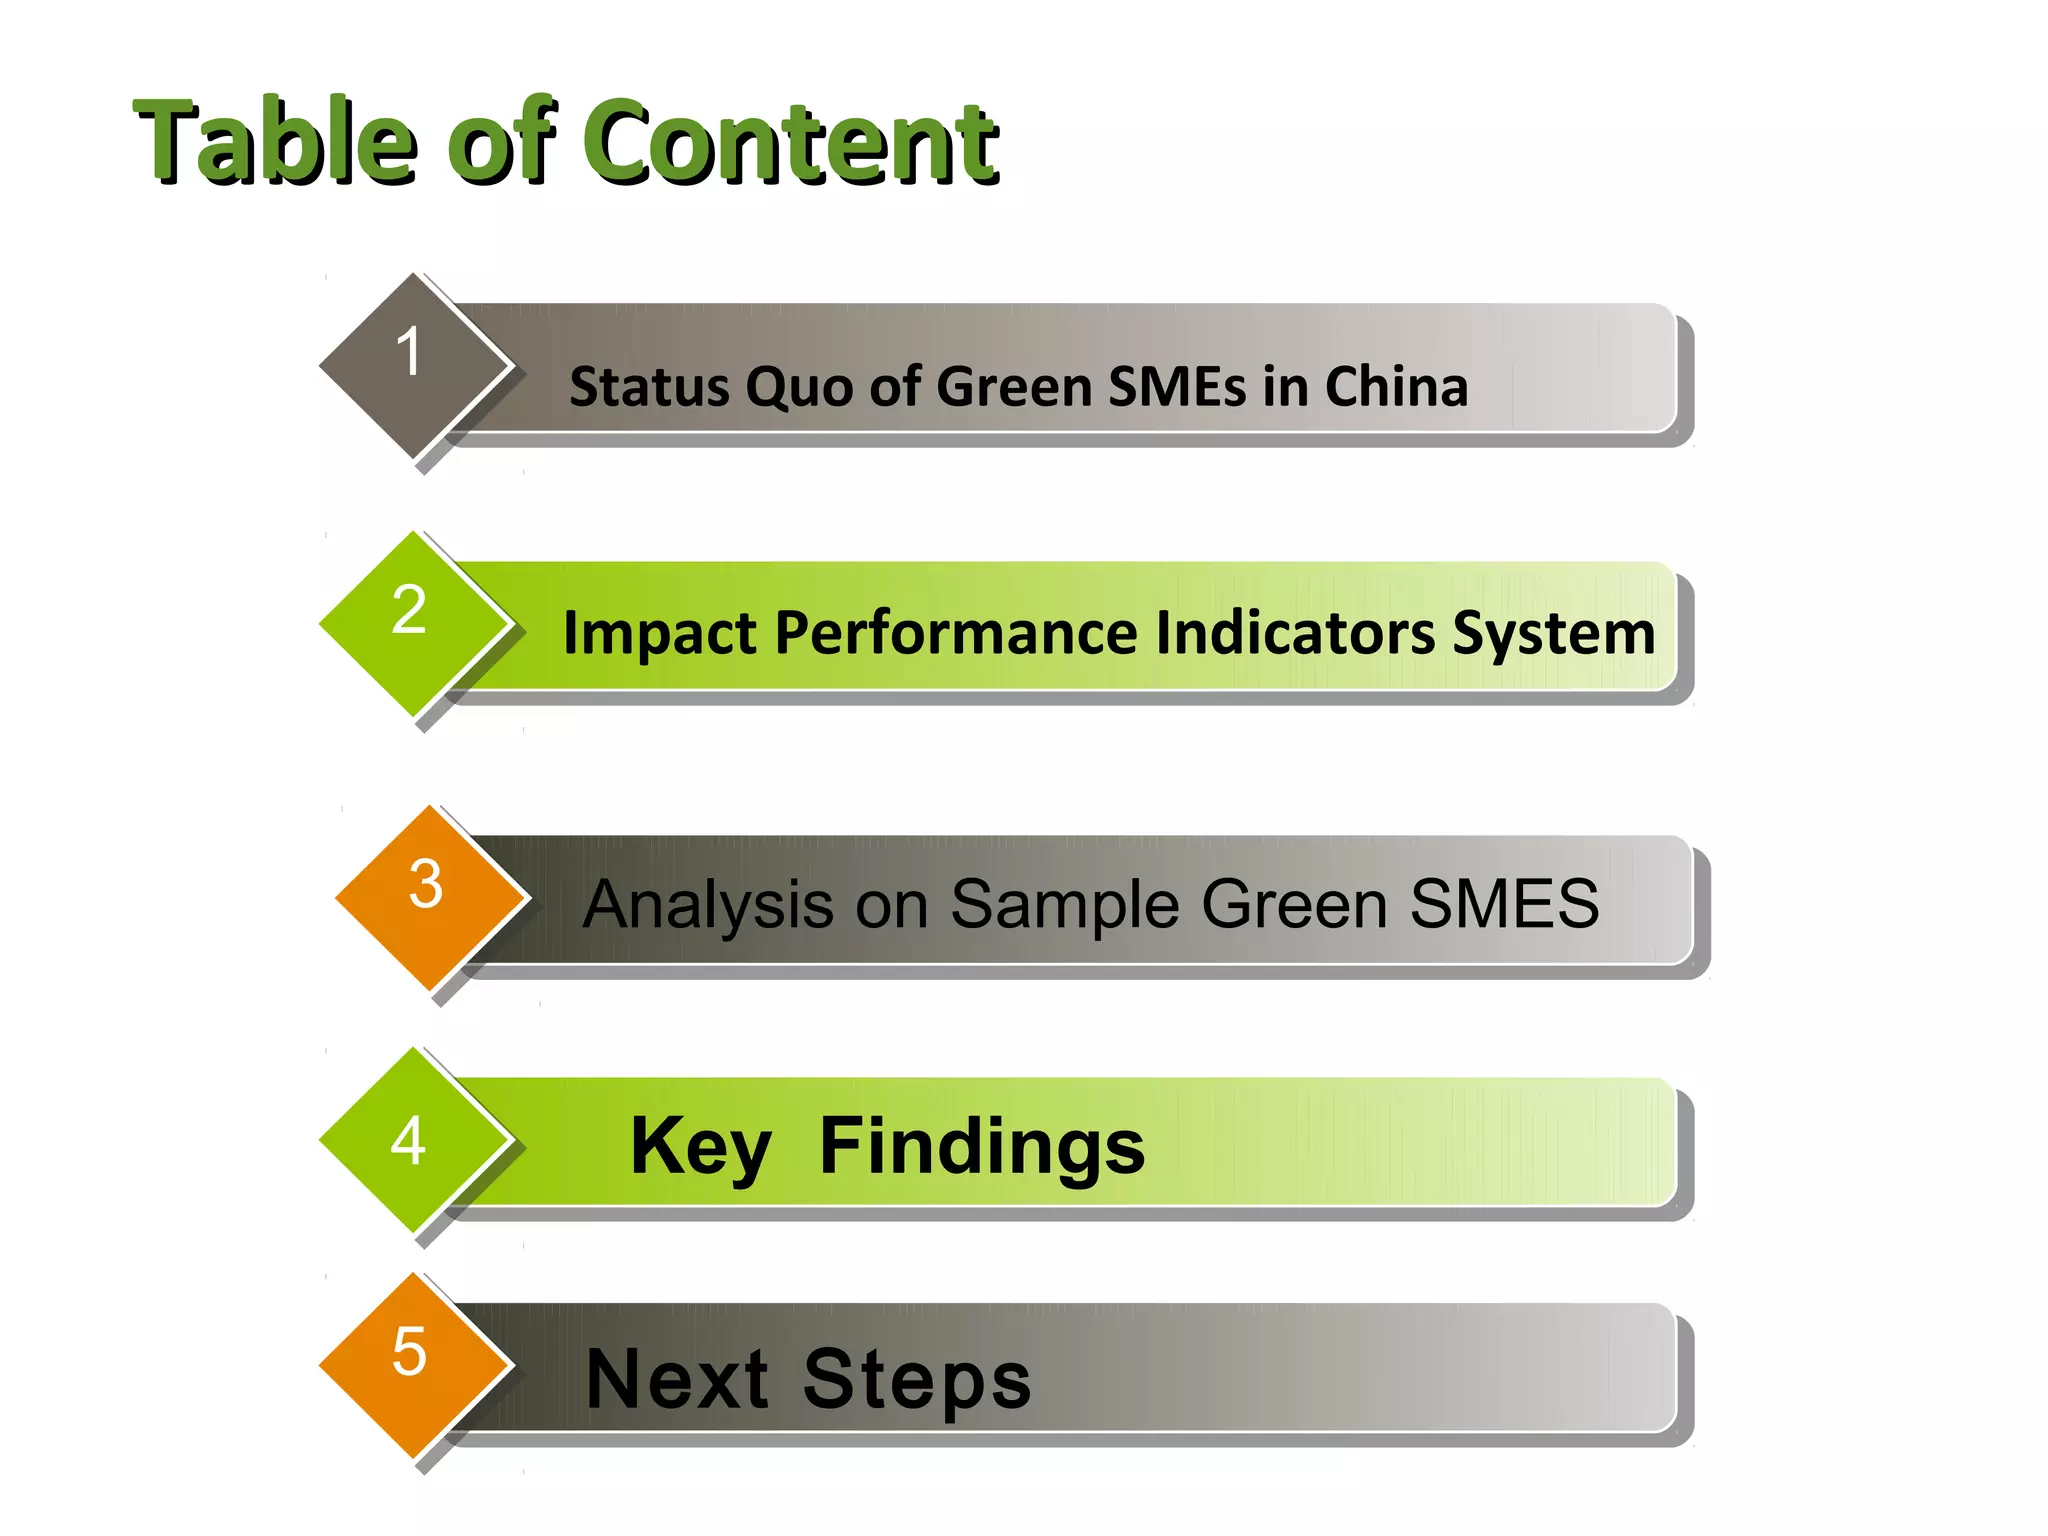
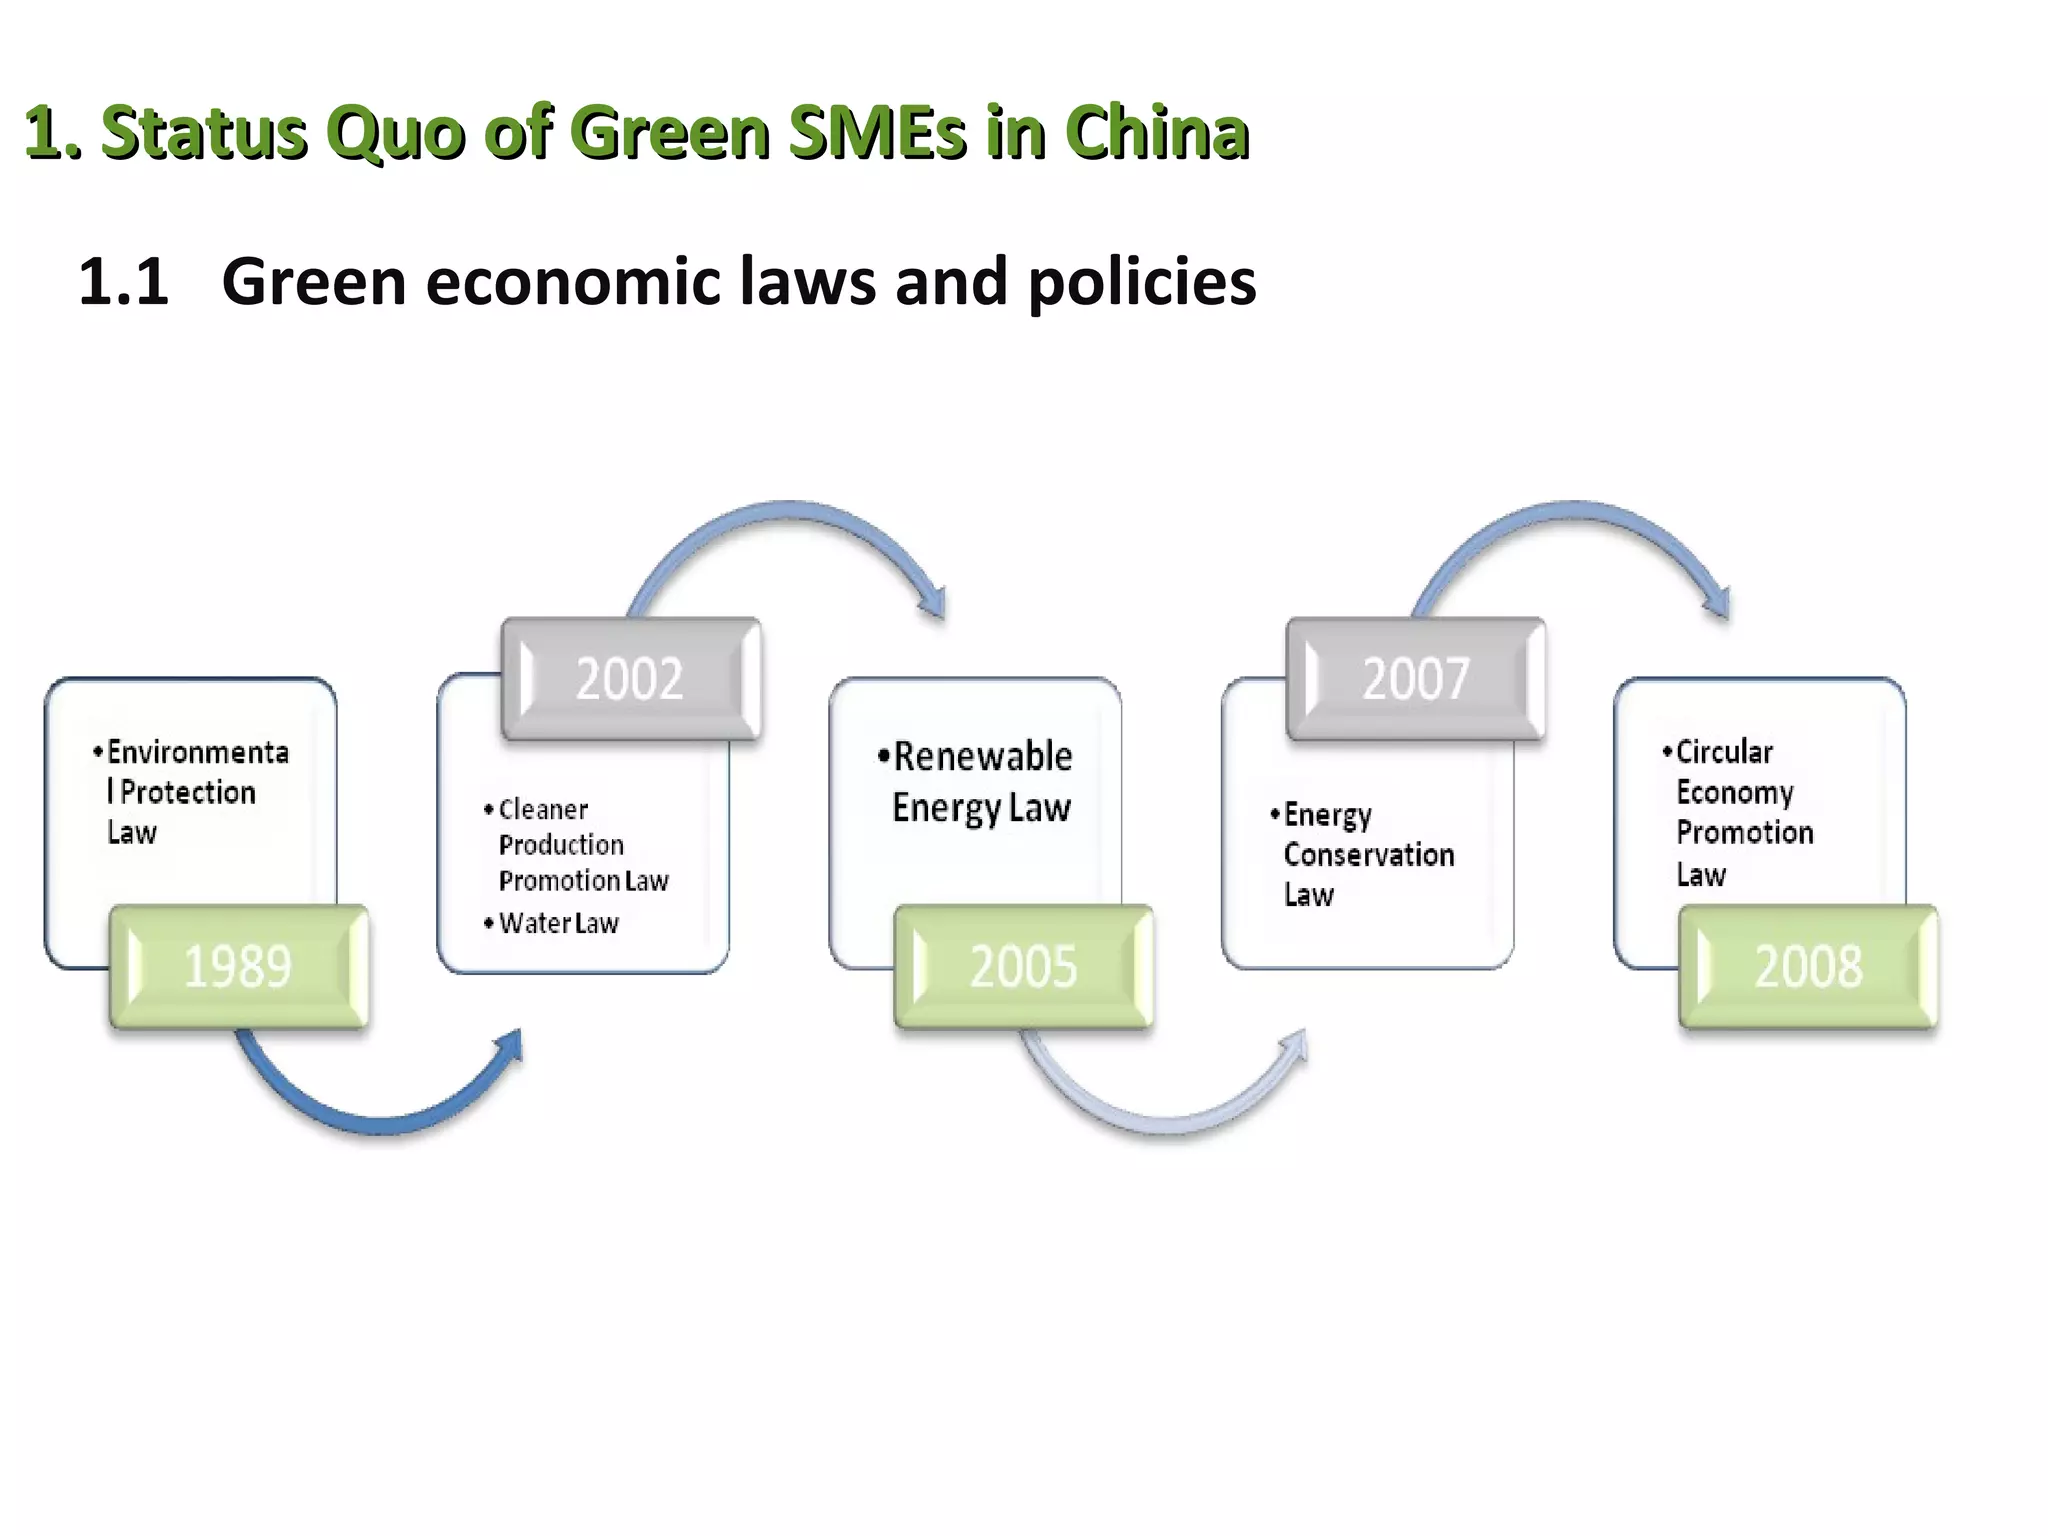
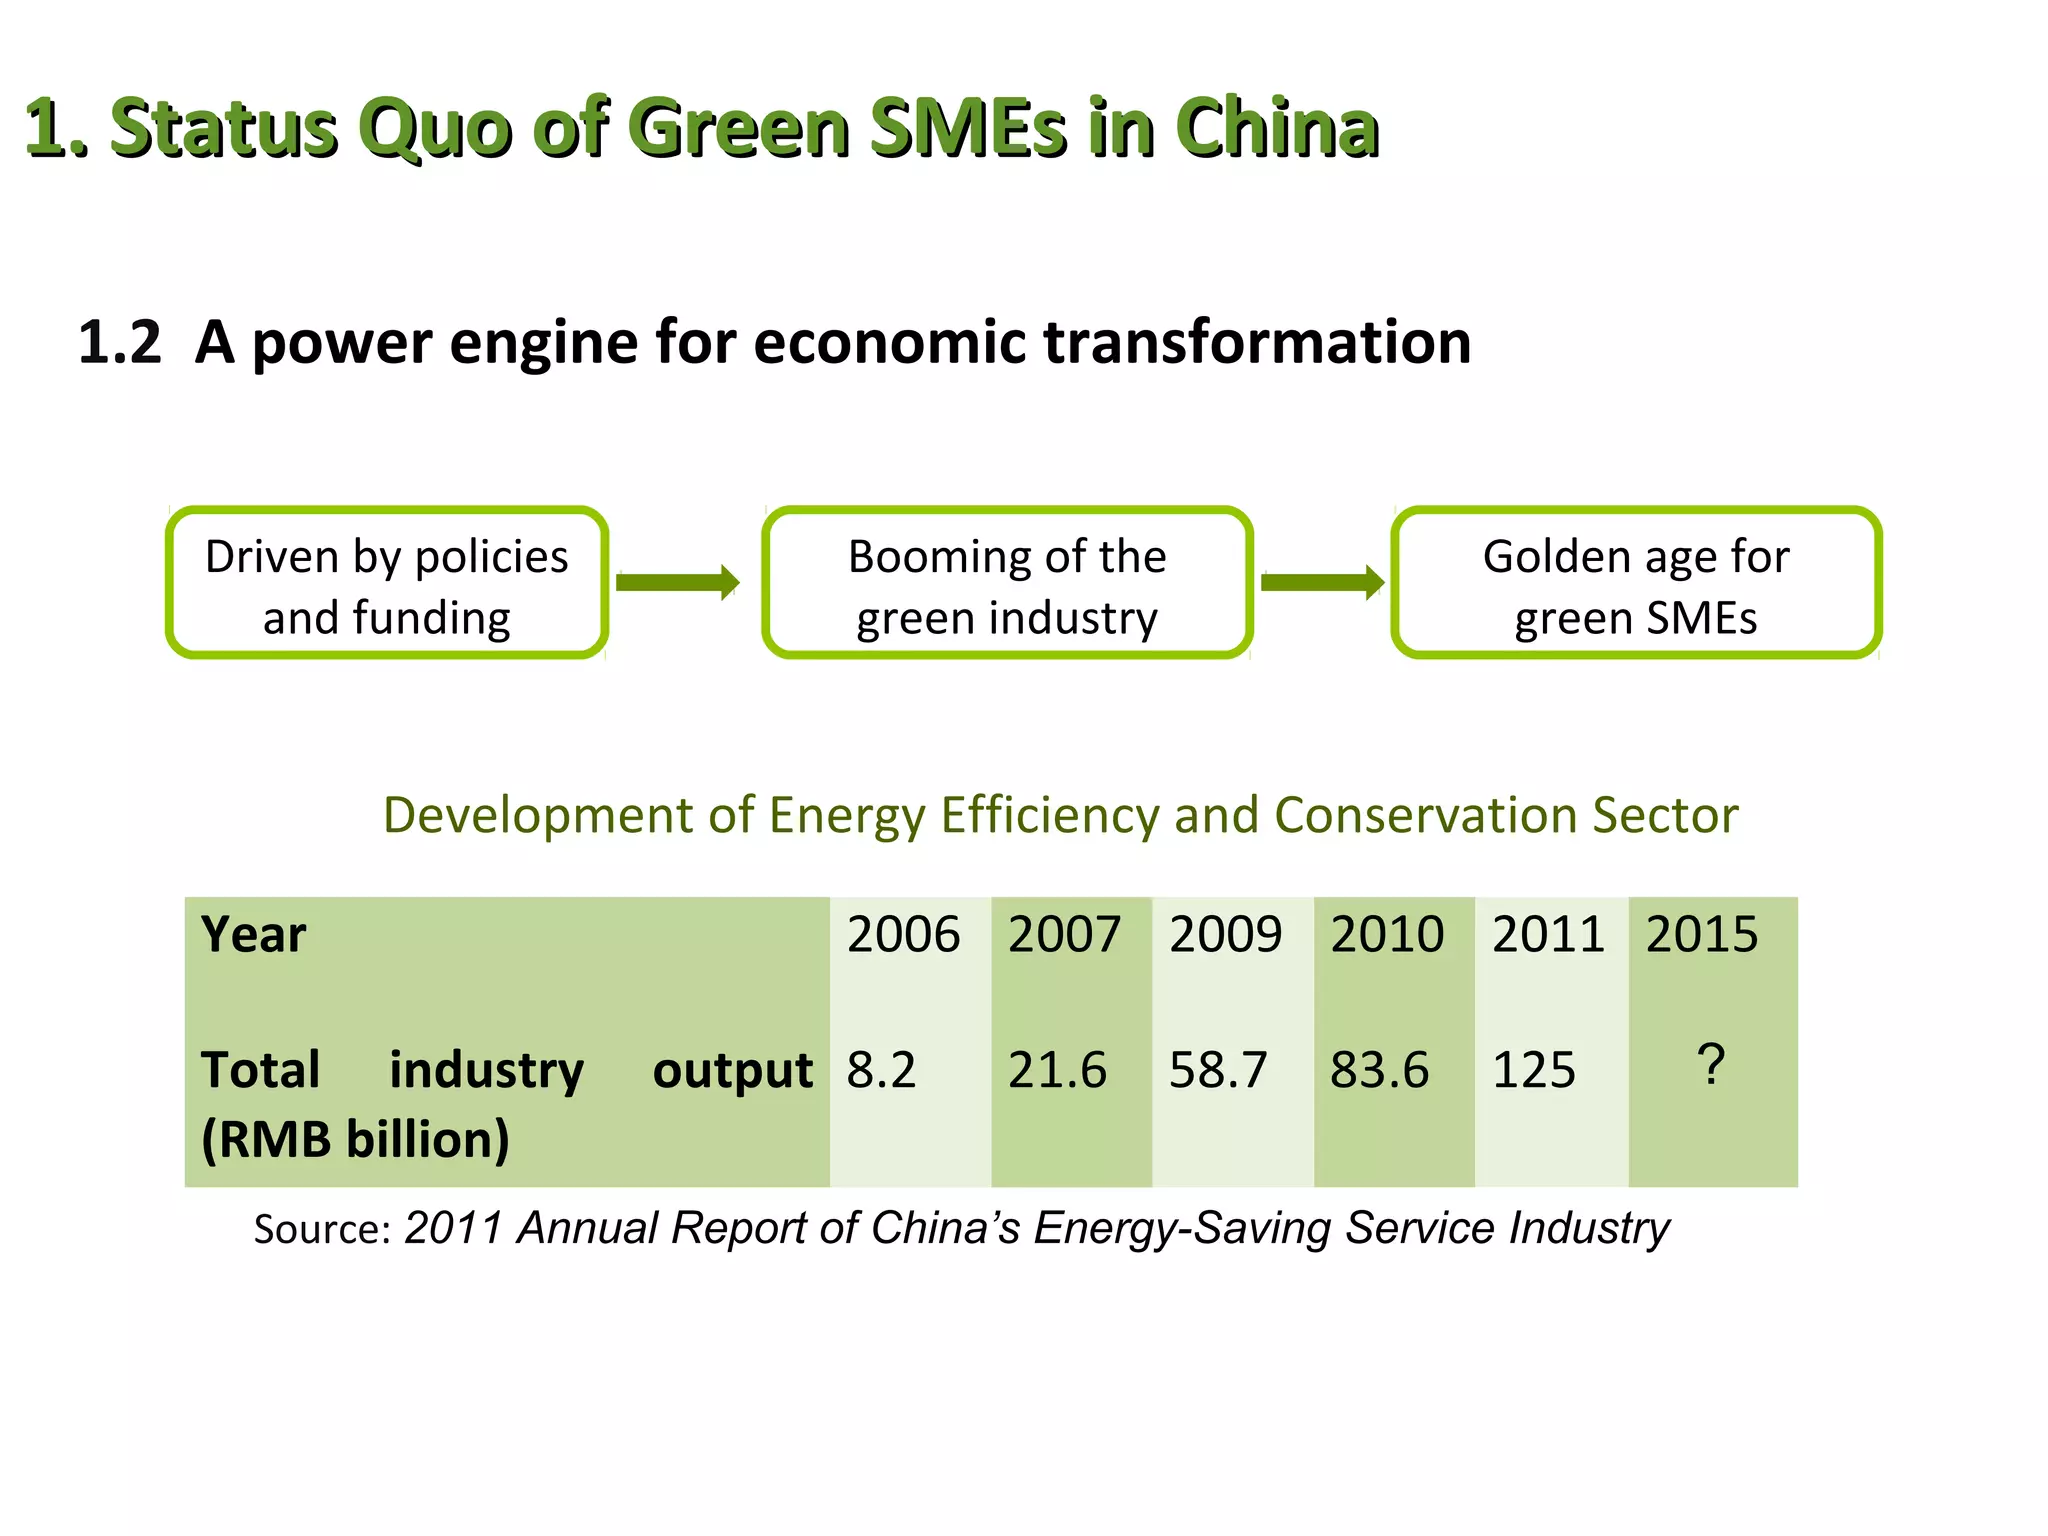
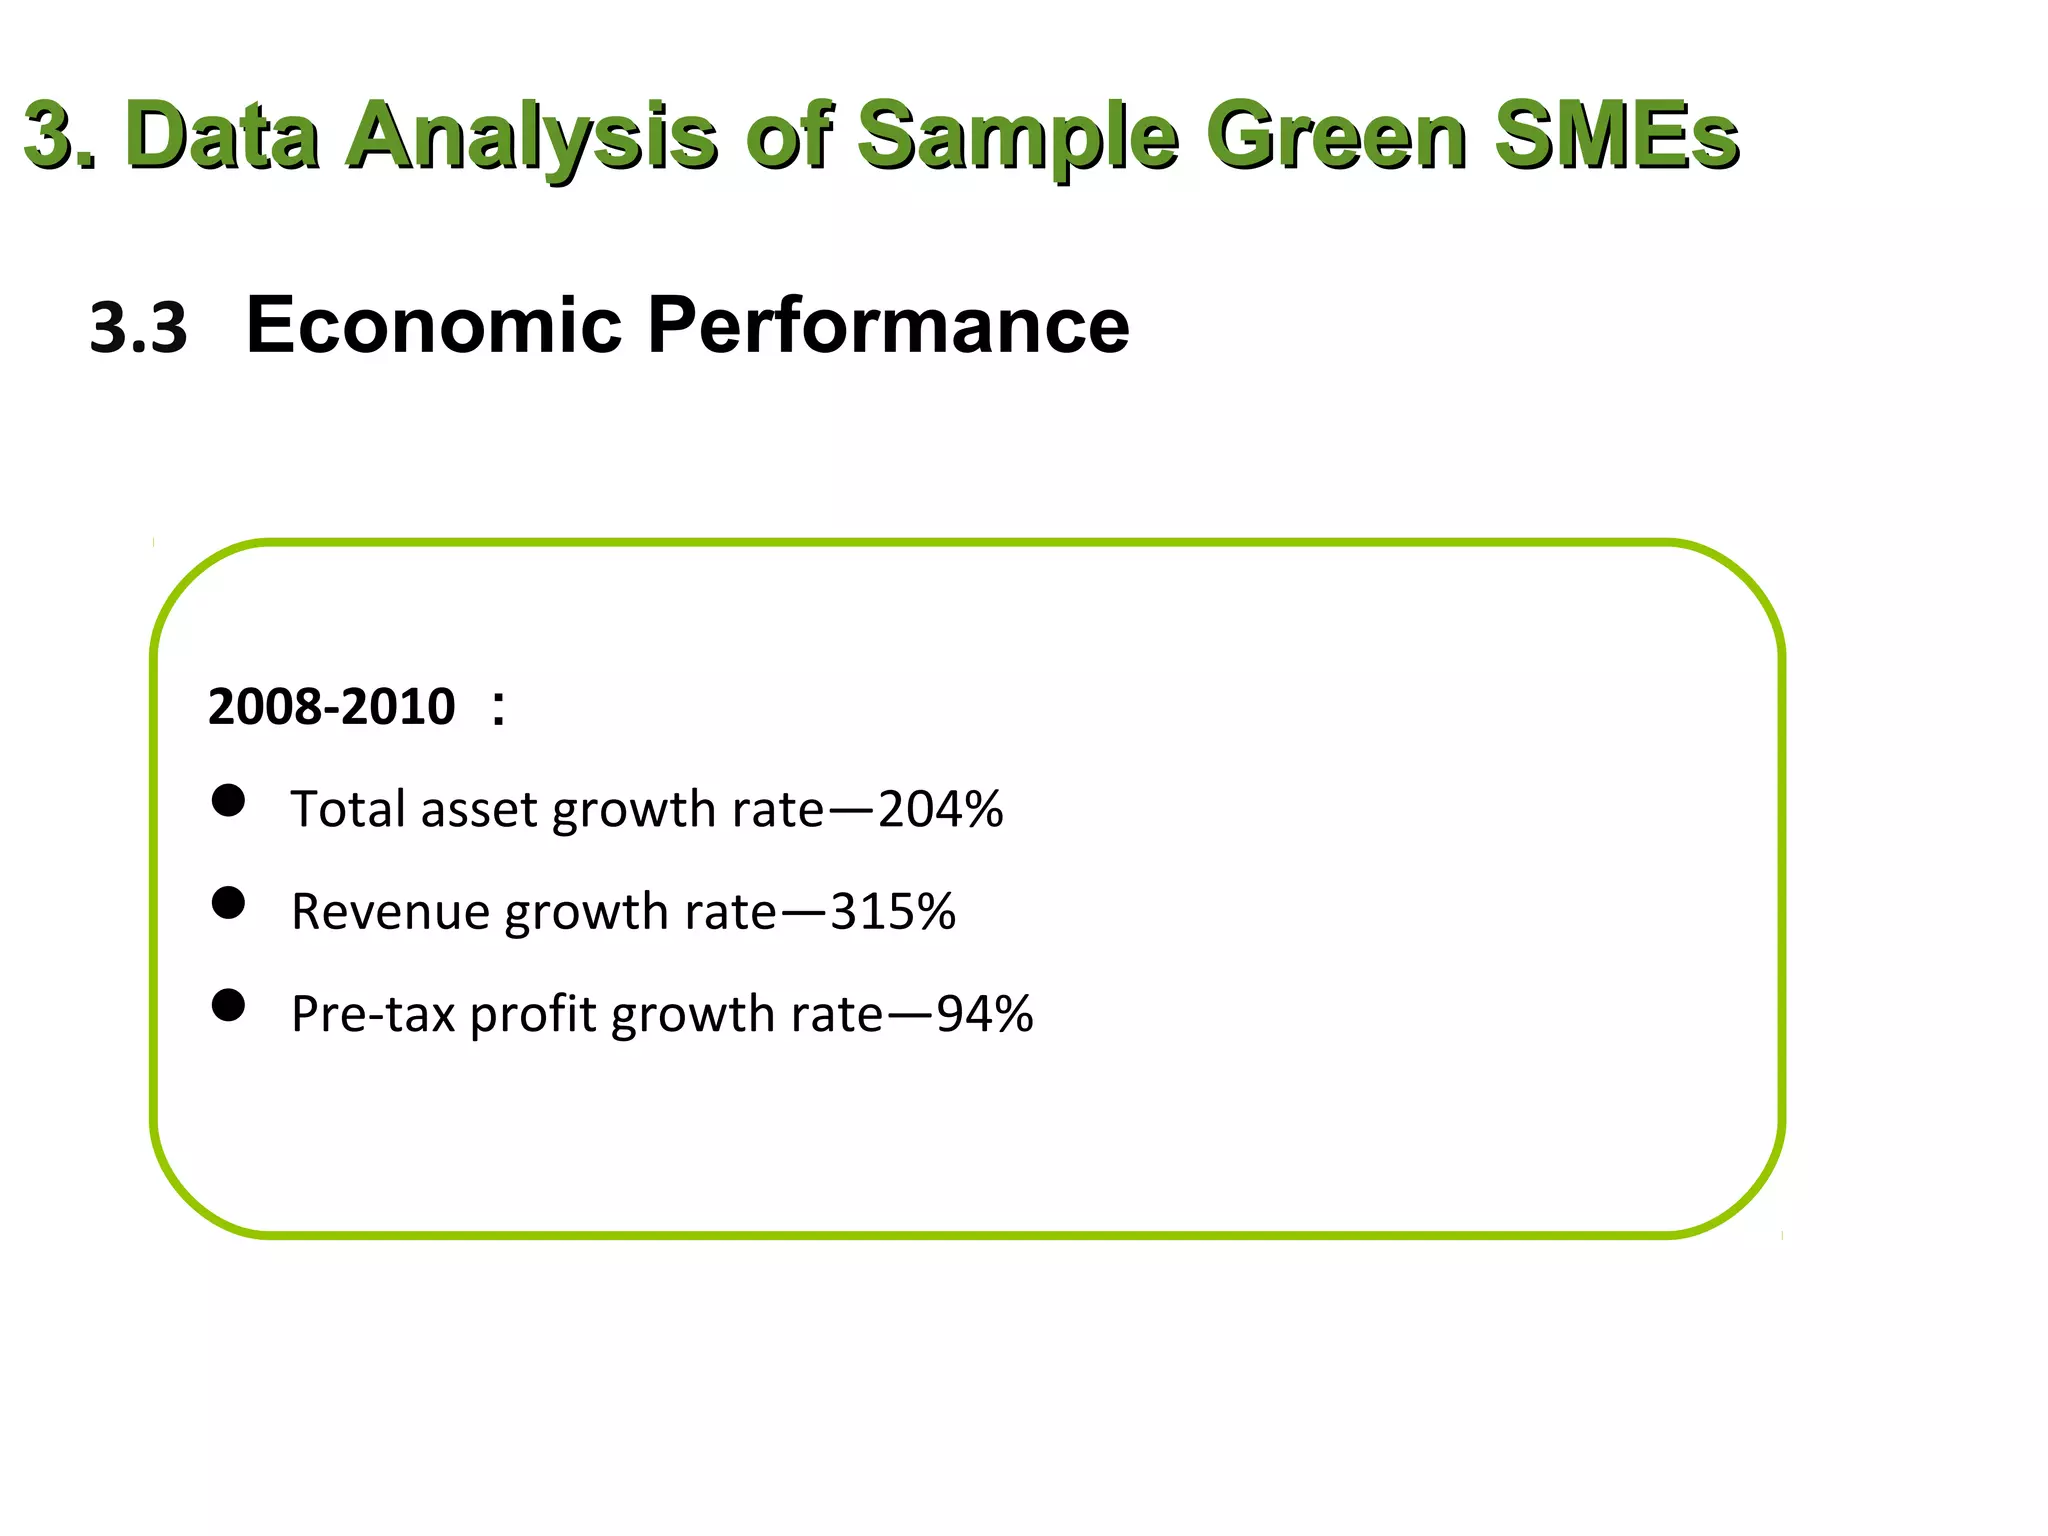
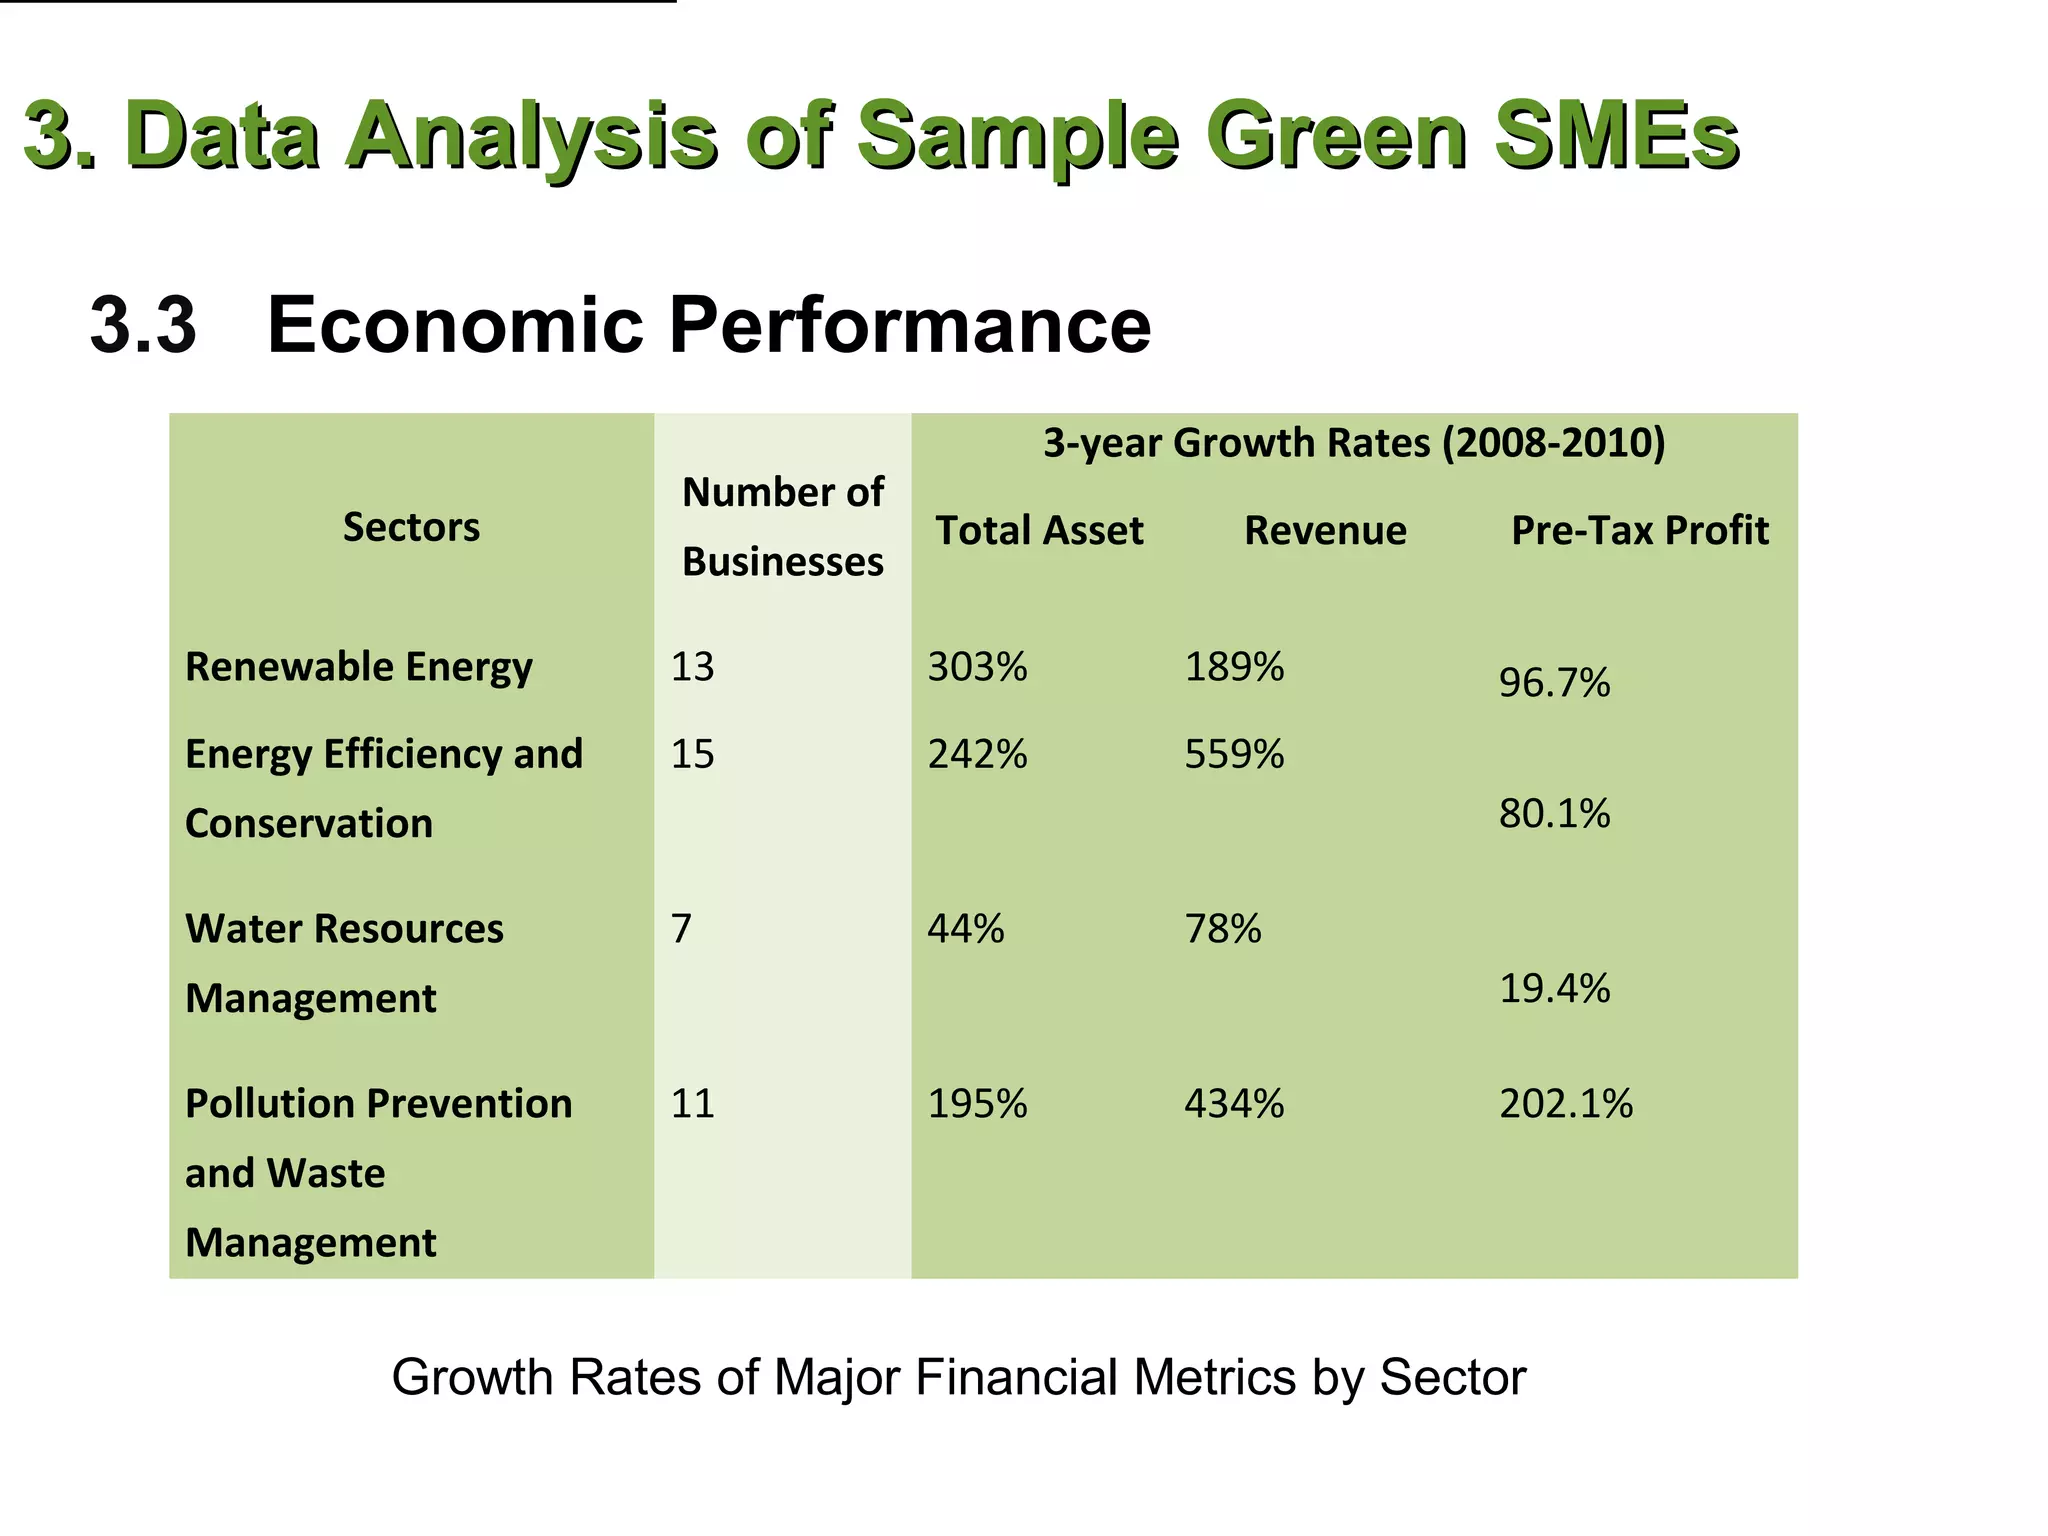
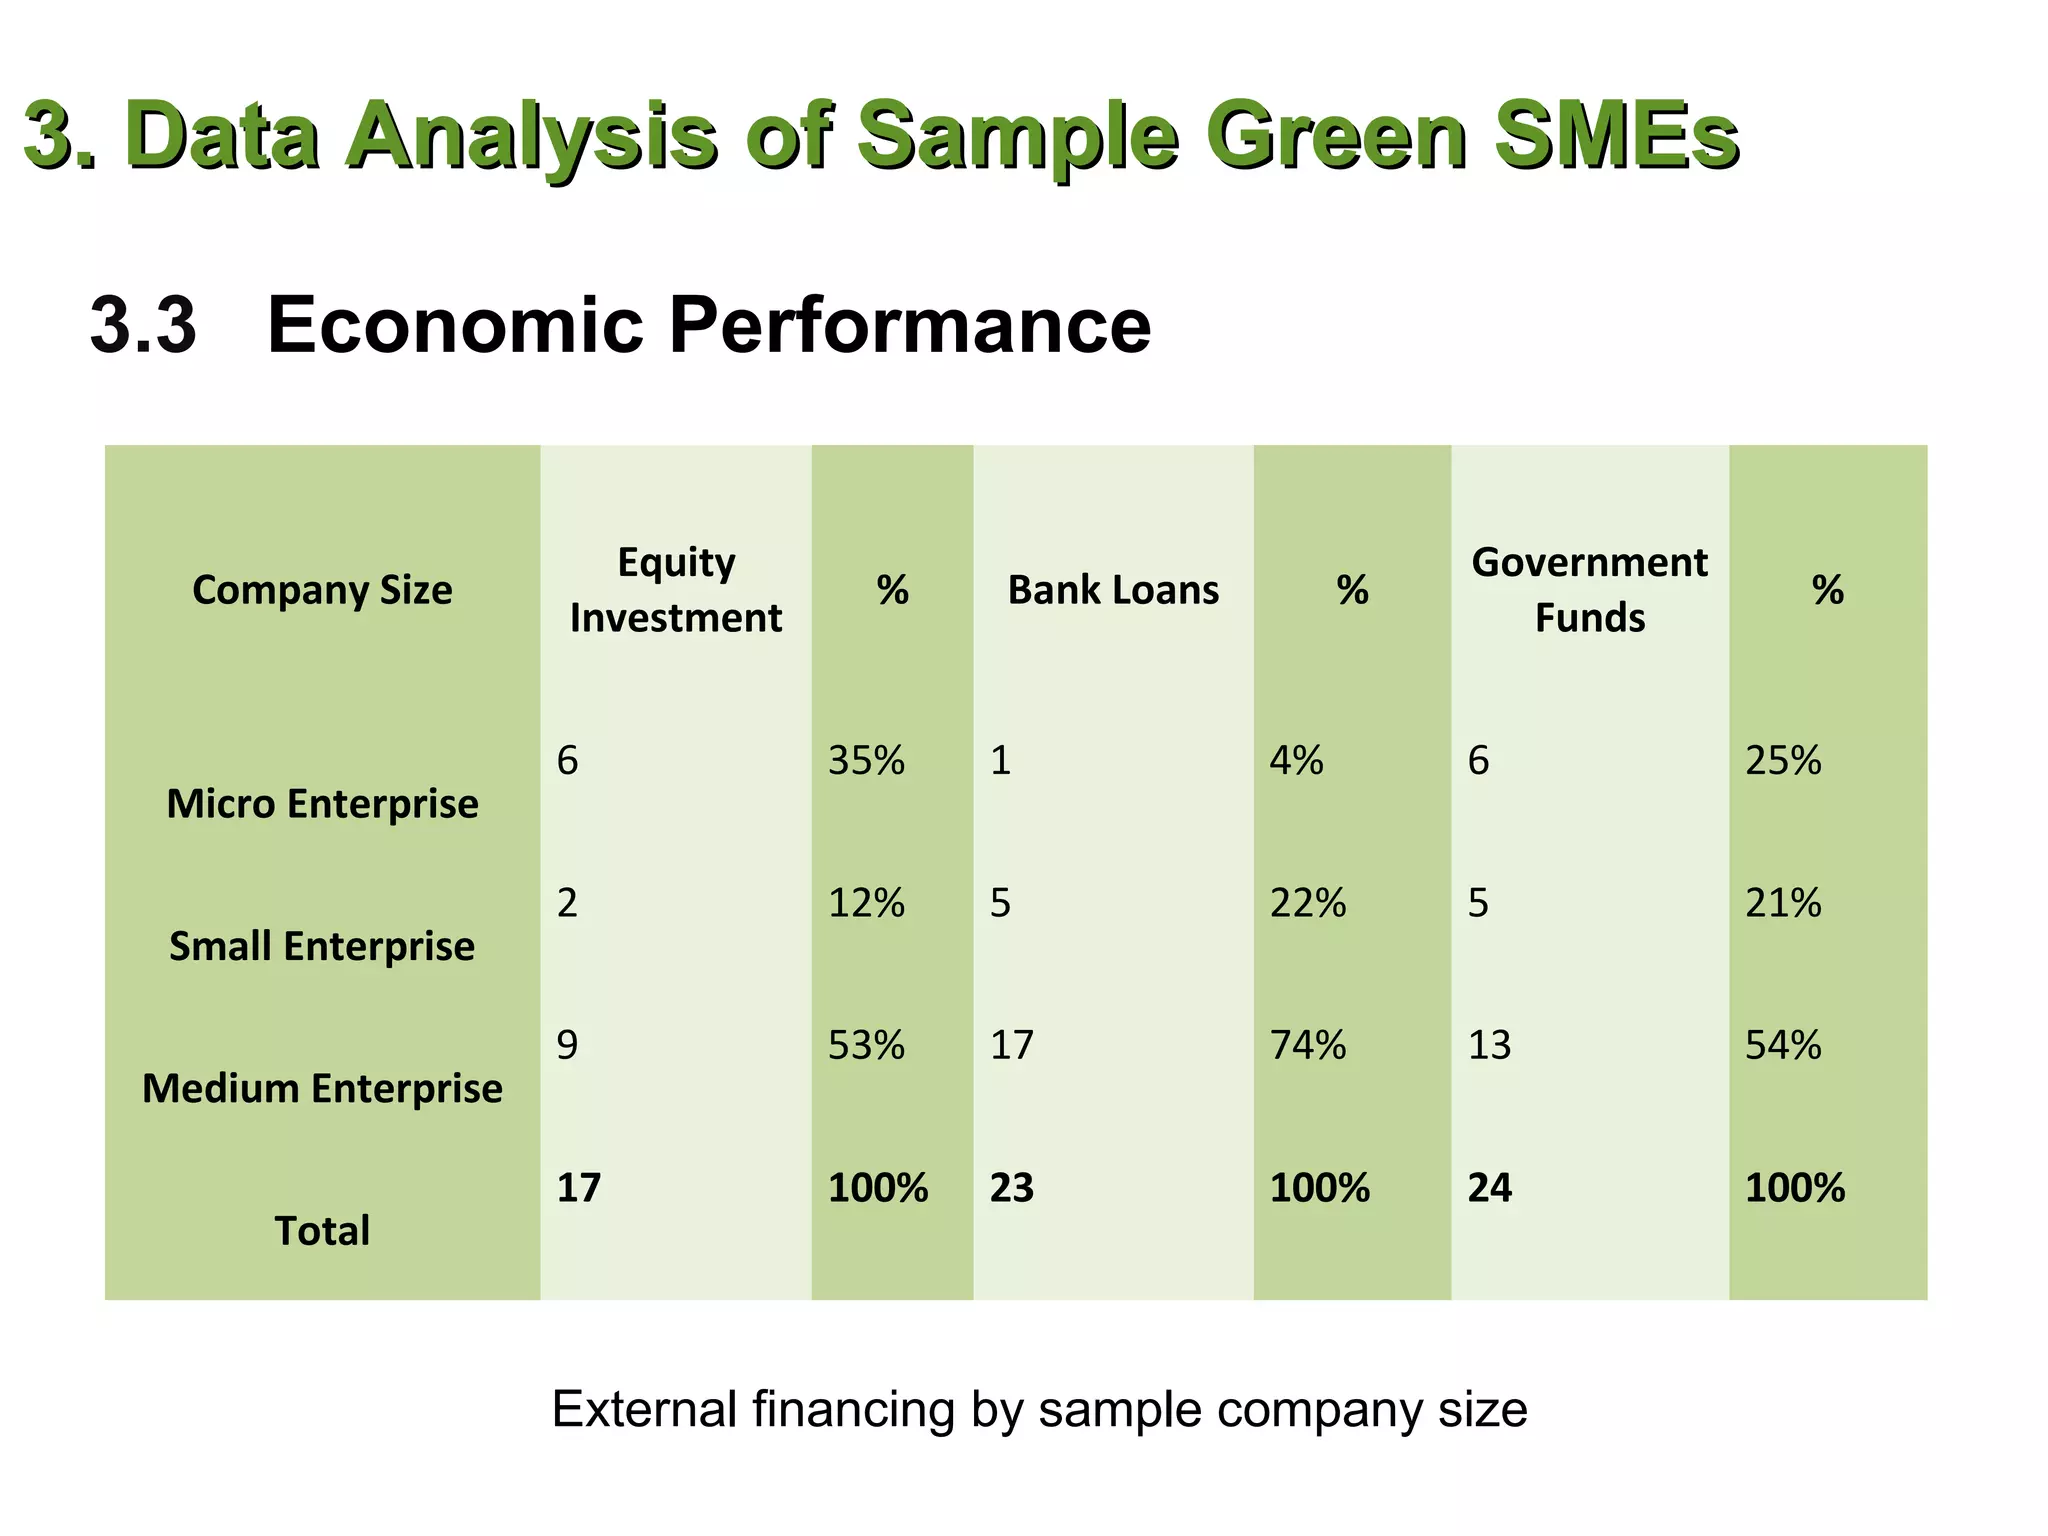
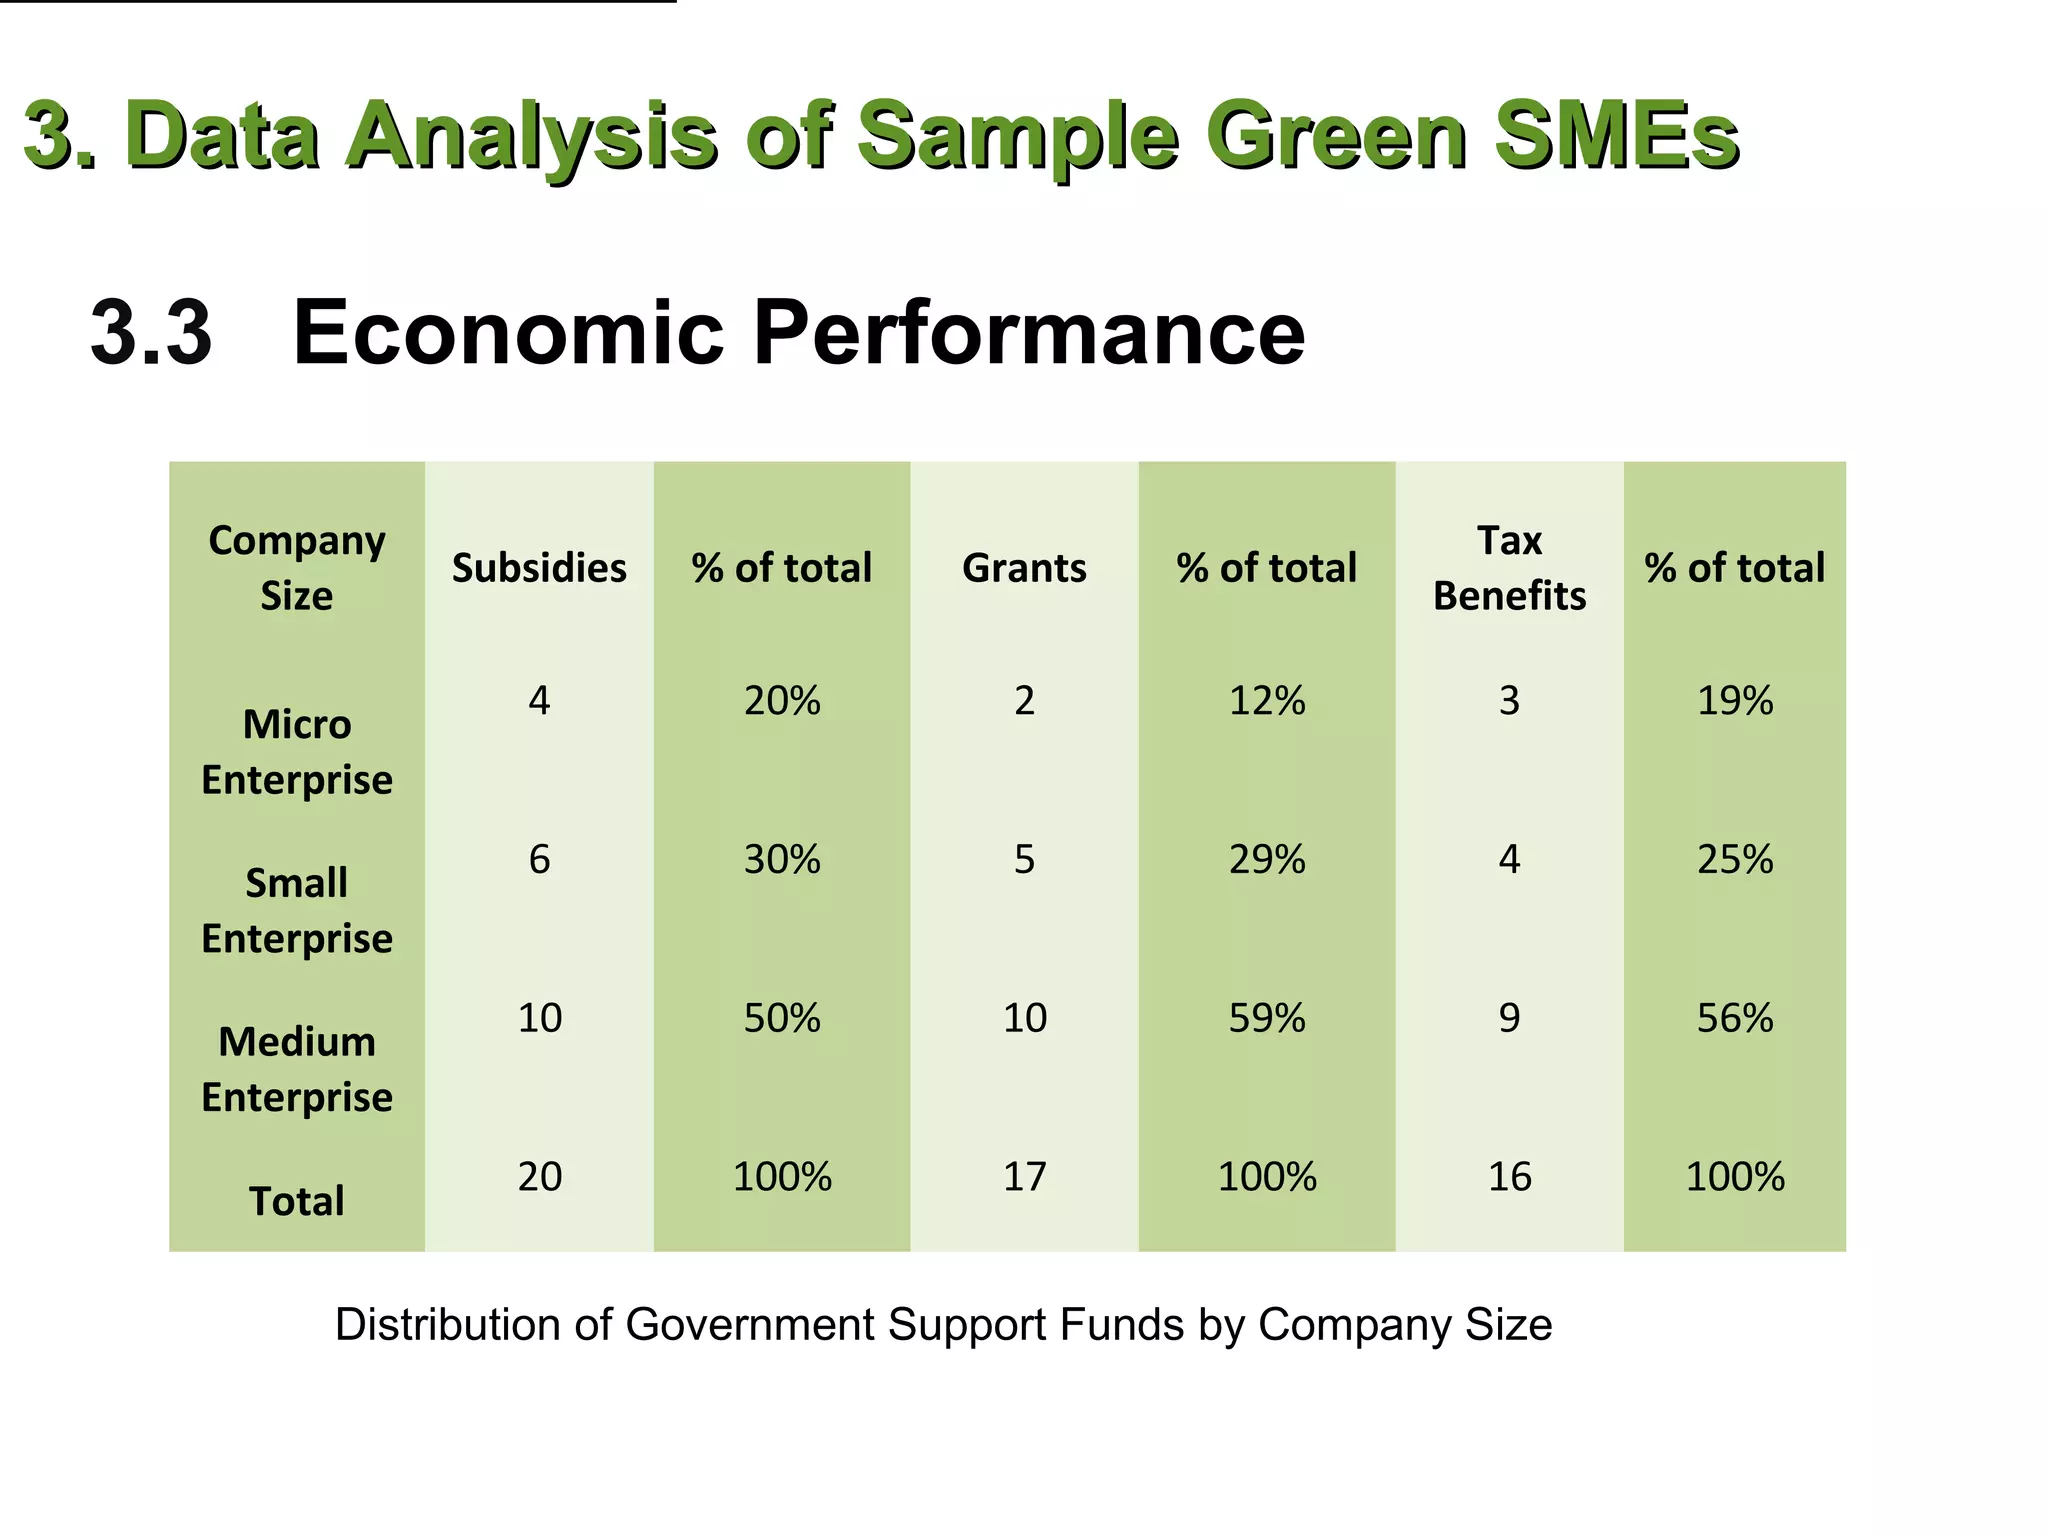
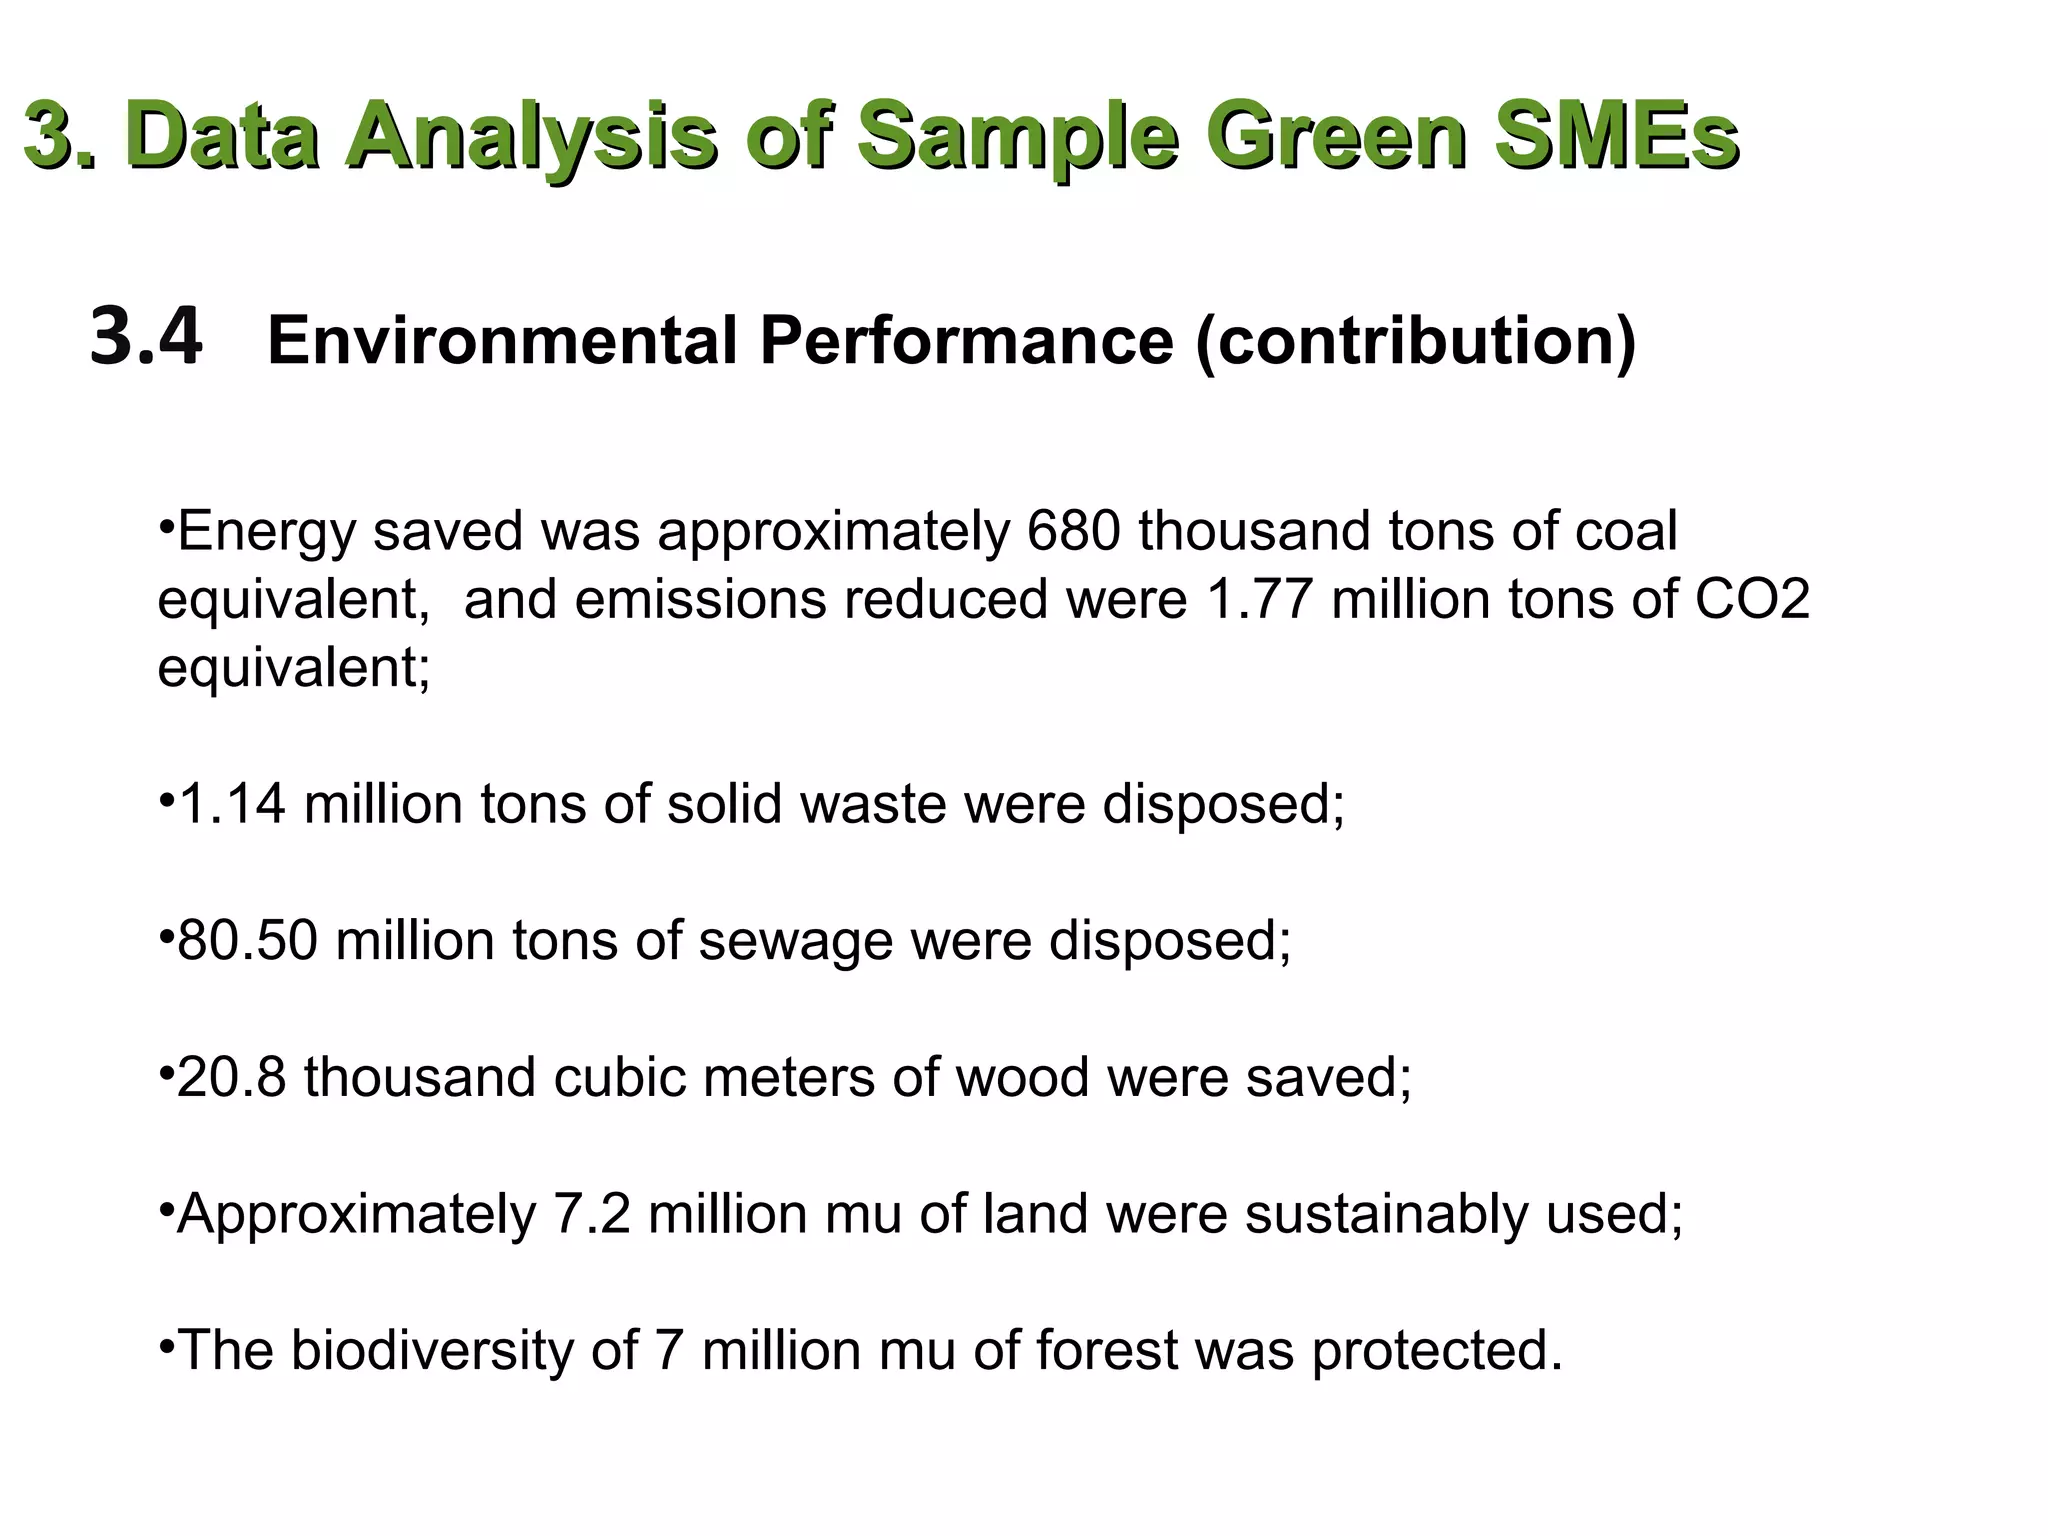
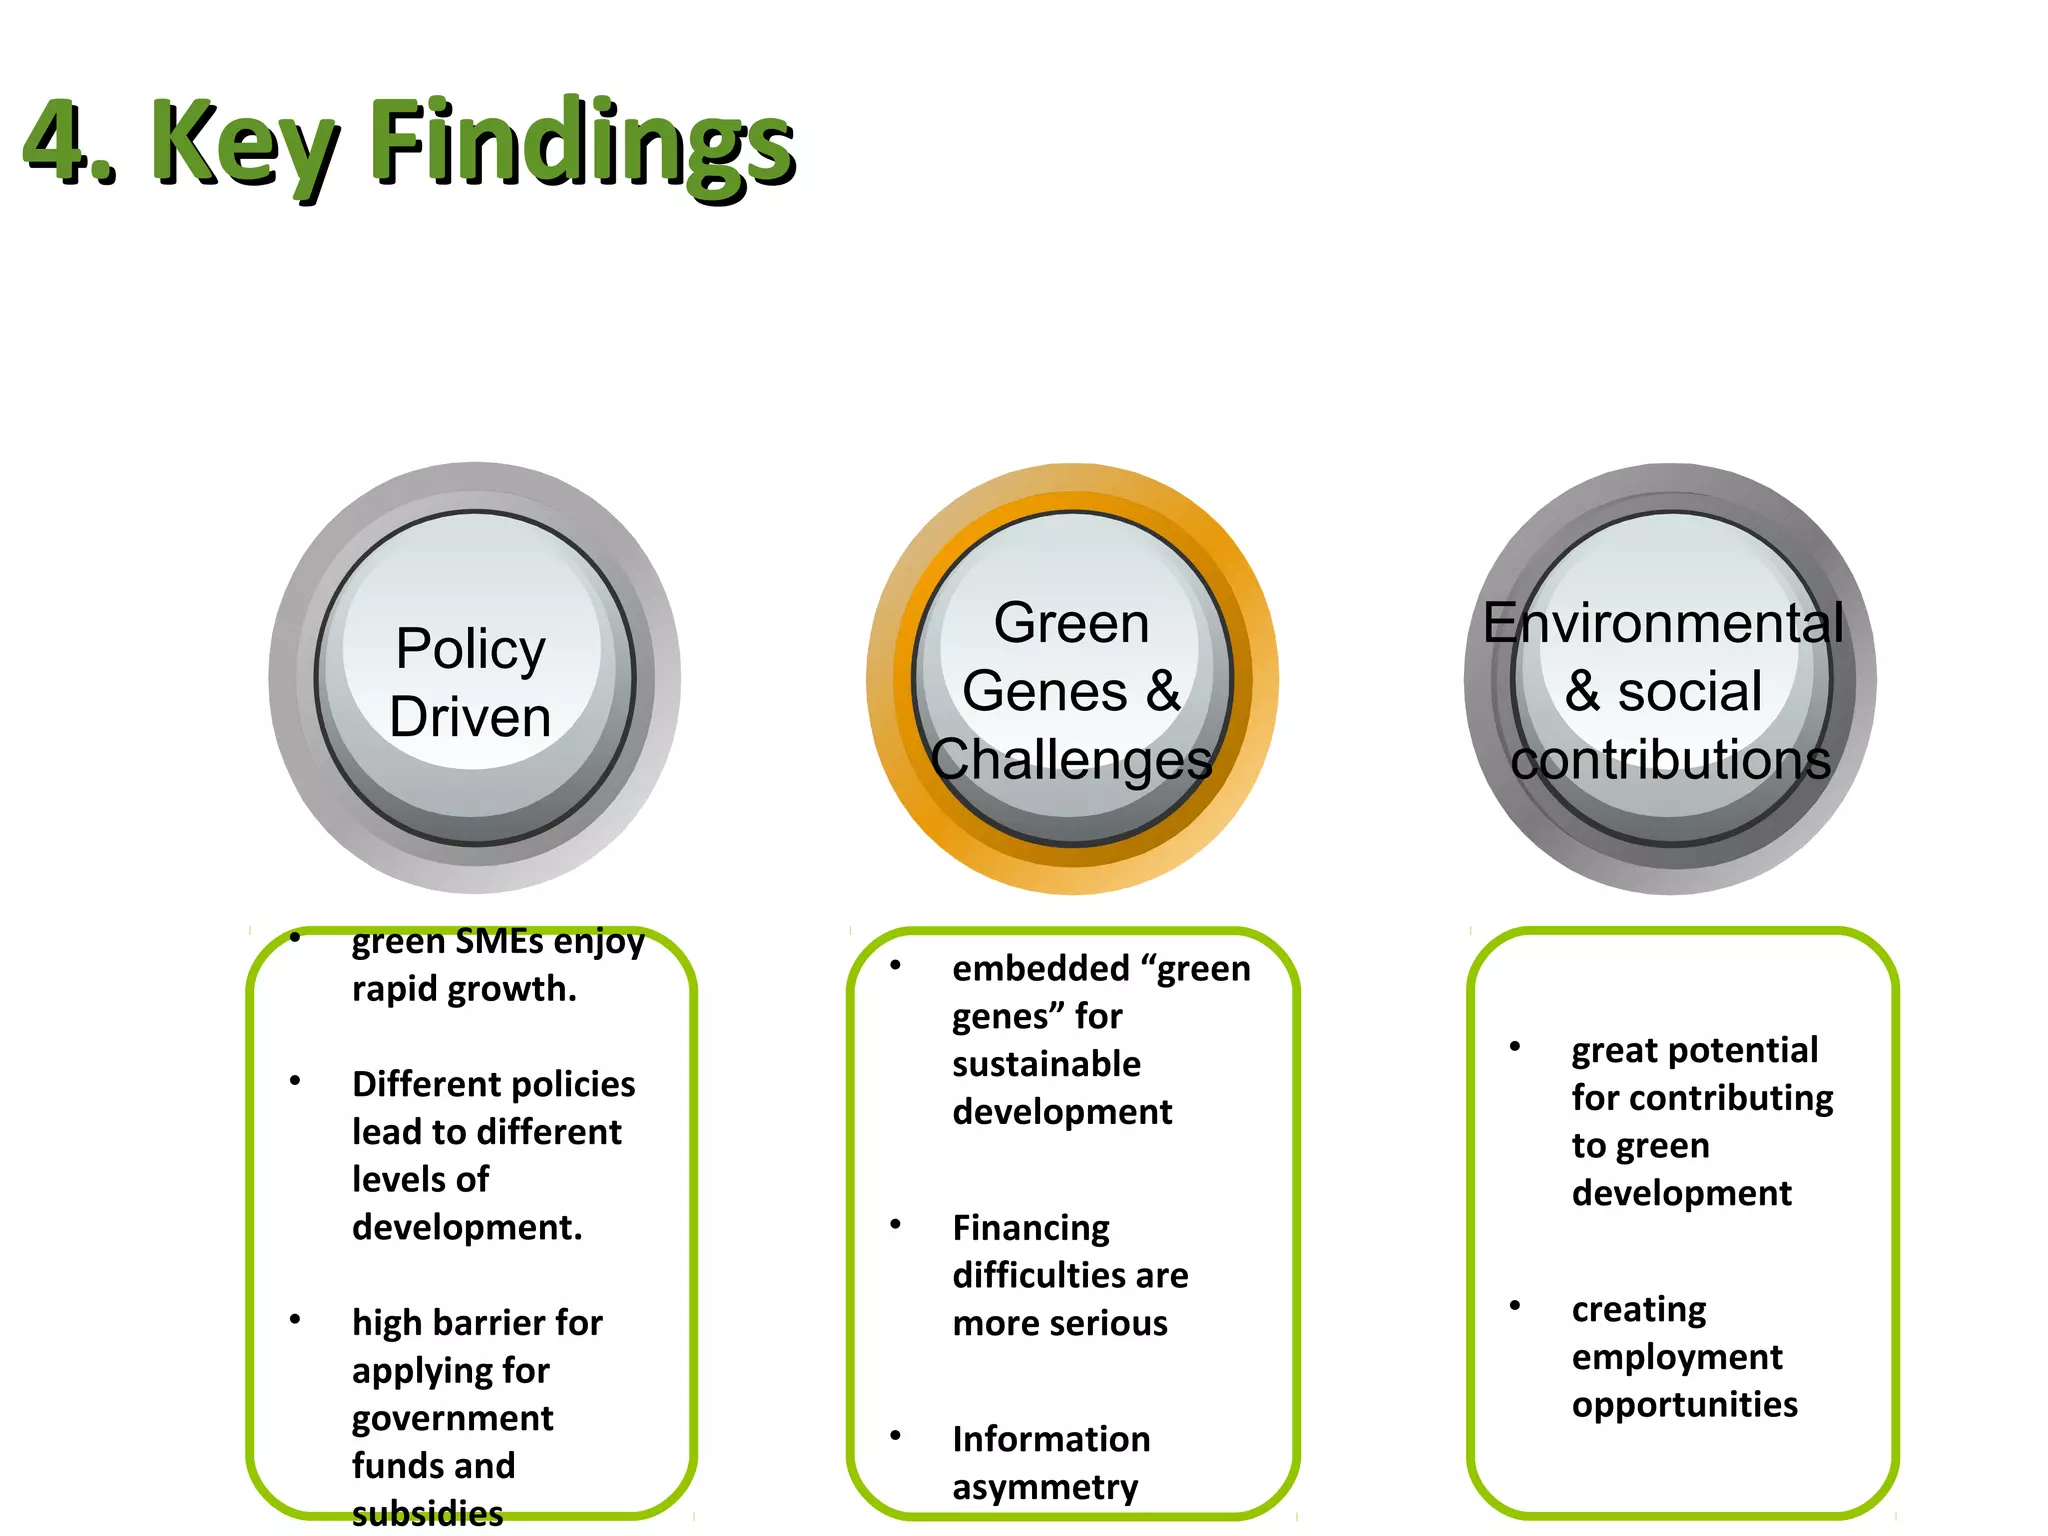
New Ventures China:
Proving Environmental Entrepreneurship Can Work
Identify & Select
 Environmental           Acceleration     Access
   Companies


                        New Ventures
                           China          Investors

                        New Ventures
                        has supported                 Government
                           over 500                    and public
                        environmental
                        SMEs in China
                          since 2003         Market
Table of Content
    1    Status Quo of Green SMEs in China


    2    Impact Performance Indicators System


     3   Analysis on Sample Green SMES


    4      Key Findings
           Key Findings

    5    Next Steps
1. Status Quo of Green SMEs in China
 1.1 Green economic laws and policies


                 Policy


    “ 十二五规划”
    — 12 项环境生
      态相关指标
1. Status Quo of Green SMEs in China

 1.2 A power engine for economic transformation


     Driven by policies            Booming of the                 Golden age for
        and funding                green industry                  green SMEs


             Development of Energy Efficiency and Conservation Sector

     Year                          2006 2007 2009 2010 2011 2015

     Total industry       output 8.2       21.6     58.7   83.6   125         ?
     (RMB billion)
       Source: 2011 Annual Report of China’s Energy-Saving Service Industry
1. Status Quo of Green SMEs in China

 1.3 potential and impact of green SMEs not well recognized

        •Potential of green SMEs in energy efficiency and emissions
        reduction not well received by the government
        •Lack of proper measuring indicators


        The overall sector remains under-developed
        •weak in management
        •poor access to information
2. Impact Performance Indicators System

 2.1 4 major issues studied
2. Impact Performance Indicators System

 2.2 Definition on green SMEs
  Deliver positive impact on improving the natural environment
  through innovative technologies, products, and/or business models


        · Renewable energy
        · Energy efficiency and conservation
        · Water resources management
        · Pollution prevention and waste management
        · Environmentally friendly new materials and processes
        · Sustainable land use
        · Biodiversity protection
        · Other related green fields
2. Impact Performance Indicators System

 2.3 methodology


        Strategies and management

                                              Based on triple-
                                              bottom line principle
                                              records green
                                              SMEs' "double
    Economic      Environment   Social        green" attributes
    performance   al            performance
                  performance
                                              Features :
                                              Measurable
                                              Comparable
                                              Participative
2. Impact Performance Indicators System

 2.4 Impact indicators framework
 First-Level Indicators   Second-Level Indicators                  Third-Level Indicators

      Strategy &             Value proposition      Environmental protection and social contribution
     Management                                     objectives defined in the strategies

                           Management policies      Growth and operations model
                             Business Models        Products, customers, markets and competitive
                                                    advantages

     Performance                Economic            Basic financial and financing indicators over the
                                                    most recent three years

                              Environmental          Environmental performance created by
                                                      technologies and products
                                                     Companies’ internal environmental
                                                      management
                                  Social             External: various social contributions
                                                     Internal: job creation, work environment
3. Data Analysis of Sample Green SMEs

 3.1 Basic Information
           Company size                         Sector distribution


   Revenue Distribution in 2010 (RMB million)     Industry Sector Distribution
3. Data Analysis of Sample Green SMEs

 3.1 Basic Information


        Average Age of Sample Companies by Sector (Year)
3. Data Analysis of Sample Green SMEs
 3.2 Consideration of “Sustainable Development” in trategy

                                               Environmental
                           Operations
    Product Features                          Management and
                          Management
                                                 Response


                             Energy           Social reputation
          R&D
                             Water
      Marketing &                               Response to
                           Resource             challenges
         Sales
                           Utilization
3. Data Analysis of Sample Green SMEs

 3.3 Economic Performance


    2008-2010 :
     Total asset growth rate—204%
     Revenue growth rate—315%
     Pre-tax profit growth rate—94%
3. Data Analysis of Sample Green SMEs

 3.3 Economic Performance
                                               3-year Growth Rates (2008-2010)
                           Number of
           Sectors                      Total Asset     Revenue       Pre-Tax Profit
                           Businesses

   Renewable Energy        13           303%          189%           96.7%
   Energy Efficiency and   15           242%          559%
   Conservation                                                      80.1%

   Water Resources         7            44%           78%
   Management                                                        19.4%

   Pollution Prevention    11           195%          434%           202.1%
   and Waste
   Management


               Growth Rates of Major Financial Metrics by Sector
3. Data Analysis of Sample Green SMEs

 3.3 Economic Performance

                         Equity                                 Government
    Company Size                    %     Bank Loans        %                  %
                      Investment                                  Funds


                      6            35%    1            4%       6            25%
   Micro Enterprise

                      2            12%    5            22%      5            21%
   Small Enterprise

                      9            53%    17           74%      13           54%
  Medium Enterprise

                      17           100%   23           100%     24           100%
        Total


                      External financing by sample company size
3. Data Analysis of Sample Green SMEs

 3.3 Economic Performance

    Company                                                      Tax
                Subsidies   % of total   Grants   % of total              % of total
      Size                                                     Benefits

                   4          20%          2        12%           3         19%
     Micro
   Enterprise
                   6          30%          5        29%           4         25%
     Small
   Enterprise
                   10         50%         10        59%           9         56%
    Medium
   Enterprise
                   20         100%        17        100%         16         100%
     Total

         Distribution of Government Support Funds by Company Size
3. Data Analysis of Sample Green SMEs

 3.4   Environmental Performance (contribution)

  •Energy saved was approximately 680 thousand tons of coal
  equivalent, and emissions reduced were 1.77 million tons of CO2
  equivalent;

  •1.14 million tons of solid waste were disposed;

  •80.50 million tons of sewage were disposed;

  •20.8 thousand cubic meters of wood were saved;

  •Approximately 7.2 million mu of land were sustainably used;

  •The biodiversity of 7 million mu of forest was protected.
3. Data Analysis of Sample Green SMEs
 3.4 Environmental Performance (internal operations)


     Green operations:
     Carbon Emission
     Water resource management
     Energy efficiency management
     Resource utilization efficiency
3. Data Analysis of Sample Green SMEs

 3.5 Social contribution

         Job creation      Decent work


                              Wages
        Total : 5685
                              career
       Average : 102       development

       Full time : 5128     work safety

       Part time : 557      occupational
                               health
4. Key Findings


           Policy                   Green            Environmental
           Driven                  Genes &              & social
                                  Challenges          contributions


     •   green SMEs enjoy
                              •   embedded “green
         rapid growth.
                                  genes” for
                                  sustainable         •   great potential
     •   Different policies                               for contributing
                                  development
         lead to different                                to green
         levels of                                        development
         development.         •   Financing
                                  difficulties are
     •   high barrier for         more serious        •   creating
         applying for                                     employment
         government                                       opportunities
                              •   Information
         funds and
                                  asymmetry
         subsidies
5. Next Steps


  Improve       Working with      Green SMEs
  Impact        the information   Impact Role
  Indicators    center of MIIT
                                  Model
                                  Initiative
   Indicators    Government          Initiatives
                 database
New Ventures China:
 Creating Environmental & Social Impact via Role Models

• To select companies with unique
  technologies/solutions to address serious
  environmental and social problems
• To select entrepreneurs with humanistic care and
  acute awareness of sustainability
• To select industry/sector-leading companies or
  those with a potential to lead, which could exert
  greater and wider impact as role models long-term
Impact Role Model:
  Sinen en-Tech


                                      •Exclusive developer and provider of
                                      high-temperature condensed water
                                      recovery technology, reducing energy
                                      intensity and water usage

                                      •Pioneer in energy performance
                                      contracting (EPC) business model in
                                      China


                                       Impacts and Potentials:
                                       •On company level;
                                       •On industry level;
Pictured above: The Forbes China
                                       •Beyond industry level
Magazine cover story featuring Yang
and Sinen En-Tech
Impact Role Model:
Landwasher


                                            •The Landwasher water-
                                            free flushing toilet reuses
                                            the urine deposited by
                                            users to flush toilet and
                                            saves precious water
                                            resources.


                                            Impacts and Potentials:
                                            •On rural villages
                                            •On residential buildings


 Pictured above: Landwasher water-free
 flushing toilet on Beijing Olympic sites

Impact Report on Green SMEs in China, Walter Ge (August 2012)

  • 2.
    New Ventures China: ProvingEnvironmental Entrepreneurship Can Work Identify & Select Environmental Acceleration Access Companies New Ventures China Investors New Ventures has supported Government over 500 and public environmental SMEs in China since 2003 Market
  • 3.
    Table of Content 1 Status Quo of Green SMEs in China 2 Impact Performance Indicators System 3 Analysis on Sample Green SMES 4 Key Findings Key Findings 5 Next Steps
  • 4.
    1. Status Quoof Green SMEs in China 1.1 Green economic laws and policies Policy “ 十二五规划” — 12 项环境生 态相关指标
  • 5.
    1. Status Quoof Green SMEs in China 1.2 A power engine for economic transformation Driven by policies Booming of the Golden age for and funding green industry green SMEs Development of Energy Efficiency and Conservation Sector Year 2006 2007 2009 2010 2011 2015 Total industry output 8.2 21.6 58.7 83.6 125 ? (RMB billion) Source: 2011 Annual Report of China’s Energy-Saving Service Industry
  • 6.
    1. Status Quoof Green SMEs in China 1.3 potential and impact of green SMEs not well recognized •Potential of green SMEs in energy efficiency and emissions reduction not well received by the government •Lack of proper measuring indicators The overall sector remains under-developed •weak in management •poor access to information
  • 7.
    2. Impact PerformanceIndicators System 2.1 4 major issues studied
  • 8.
    2. Impact PerformanceIndicators System 2.2 Definition on green SMEs Deliver positive impact on improving the natural environment through innovative technologies, products, and/or business models · Renewable energy · Energy efficiency and conservation · Water resources management · Pollution prevention and waste management · Environmentally friendly new materials and processes · Sustainable land use · Biodiversity protection · Other related green fields
  • 9.
    2. Impact PerformanceIndicators System 2.3 methodology Strategies and management Based on triple- bottom line principle records green SMEs' "double Economic Environment Social green" attributes performance al performance performance Features : Measurable Comparable Participative
  • 10.
    2. Impact PerformanceIndicators System 2.4 Impact indicators framework First-Level Indicators Second-Level Indicators Third-Level Indicators Strategy & Value proposition Environmental protection and social contribution Management objectives defined in the strategies Management policies Growth and operations model Business Models Products, customers, markets and competitive advantages Performance Economic Basic financial and financing indicators over the most recent three years Environmental  Environmental performance created by technologies and products  Companies’ internal environmental management Social  External: various social contributions  Internal: job creation, work environment
  • 11.
    3. Data Analysisof Sample Green SMEs 3.1 Basic Information Company size Sector distribution Revenue Distribution in 2010 (RMB million) Industry Sector Distribution
  • 12.
    3. Data Analysisof Sample Green SMEs 3.1 Basic Information Average Age of Sample Companies by Sector (Year)
  • 13.
    3. Data Analysisof Sample Green SMEs 3.2 Consideration of “Sustainable Development” in trategy Environmental Operations Product Features Management and Management Response Energy Social reputation R&D Water Marketing & Response to Resource challenges Sales Utilization
  • 14.
    3. Data Analysisof Sample Green SMEs 3.3 Economic Performance 2008-2010 :  Total asset growth rate—204%  Revenue growth rate—315%  Pre-tax profit growth rate—94%
  • 15.
    3. Data Analysisof Sample Green SMEs 3.3 Economic Performance 3-year Growth Rates (2008-2010) Number of Sectors Total Asset Revenue Pre-Tax Profit Businesses Renewable Energy 13 303% 189% 96.7% Energy Efficiency and 15 242% 559% Conservation 80.1% Water Resources 7 44% 78% Management 19.4% Pollution Prevention 11 195% 434% 202.1% and Waste Management Growth Rates of Major Financial Metrics by Sector
  • 16.
    3. Data Analysisof Sample Green SMEs 3.3 Economic Performance Equity Government Company Size % Bank Loans % % Investment Funds 6 35% 1 4% 6 25% Micro Enterprise 2 12% 5 22% 5 21% Small Enterprise 9 53% 17 74% 13 54% Medium Enterprise 17 100% 23 100% 24 100% Total External financing by sample company size
  • 17.
    3. Data Analysisof Sample Green SMEs 3.3 Economic Performance Company Tax Subsidies % of total Grants % of total % of total Size Benefits 4 20% 2 12% 3 19% Micro Enterprise 6 30% 5 29% 4 25% Small Enterprise 10 50% 10 59% 9 56% Medium Enterprise 20 100% 17 100% 16 100% Total Distribution of Government Support Funds by Company Size
  • 18.
    3. Data Analysisof Sample Green SMEs 3.4 Environmental Performance (contribution) •Energy saved was approximately 680 thousand tons of coal equivalent, and emissions reduced were 1.77 million tons of CO2 equivalent; •1.14 million tons of solid waste were disposed; •80.50 million tons of sewage were disposed; •20.8 thousand cubic meters of wood were saved; •Approximately 7.2 million mu of land were sustainably used; •The biodiversity of 7 million mu of forest was protected.
  • 19.
    3. Data Analysisof Sample Green SMEs 3.4 Environmental Performance (internal operations) Green operations: Carbon Emission Water resource management Energy efficiency management Resource utilization efficiency
  • 20.
    3. Data Analysisof Sample Green SMEs 3.5 Social contribution Job creation Decent work Wages Total : 5685 career Average : 102 development Full time : 5128 work safety Part time : 557 occupational health
  • 21.
    4. Key Findings Policy Green Environmental Driven Genes & & social Challenges contributions • green SMEs enjoy • embedded “green rapid growth. genes” for sustainable • great potential • Different policies for contributing development lead to different to green levels of development development. • Financing difficulties are • high barrier for more serious • creating applying for employment government opportunities • Information funds and asymmetry subsidies
  • 22.
    5. Next Steps Improve Working with Green SMEs Impact the information Impact Role Indicators center of MIIT Model Initiative Indicators Government Initiatives database
  • 23.
    New Ventures China: Creating Environmental & Social Impact via Role Models • To select companies with unique technologies/solutions to address serious environmental and social problems • To select entrepreneurs with humanistic care and acute awareness of sustainability • To select industry/sector-leading companies or those with a potential to lead, which could exert greater and wider impact as role models long-term
  • 24.
    Impact Role Model: Sinen en-Tech •Exclusive developer and provider of high-temperature condensed water recovery technology, reducing energy intensity and water usage •Pioneer in energy performance contracting (EPC) business model in China Impacts and Potentials: •On company level; •On industry level; Pictured above: The Forbes China •Beyond industry level Magazine cover story featuring Yang and Sinen En-Tech
  • 25.
    Impact Role Model: Landwasher •The Landwasher water- free flushing toilet reuses the urine deposited by users to flush toilet and saves precious water resources. Impacts and Potentials: •On rural villages •On residential buildings Pictured above: Landwasher water-free flushing toilet on Beijing Olympic sites