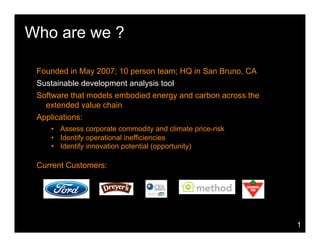
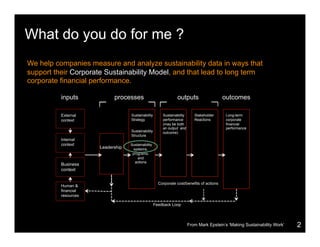
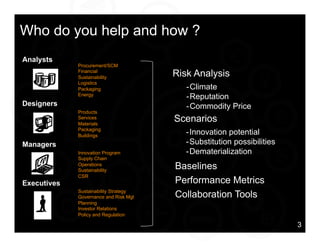
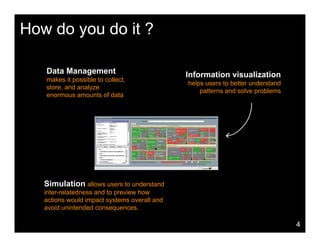
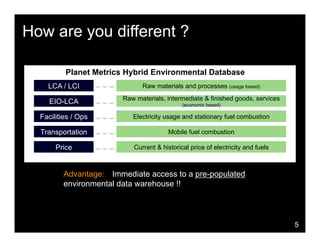
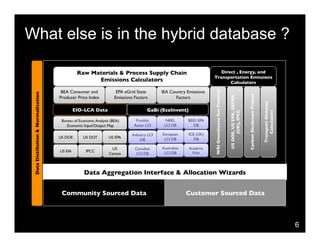
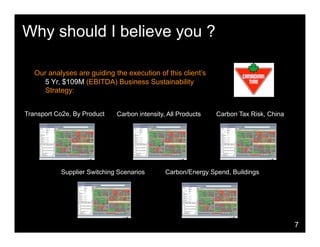
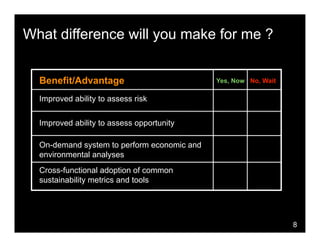
- Planet Metrics is a 10 person company founded in 2007 that provides sustainability analysis software to measure embodied energy and carbon across supply chains.
- The software helps companies assess risks like climate change and commodity prices, identify inefficiencies, and innovation opportunities to support corporate sustainability strategies and long-term financial performance.
- It provides a hybrid environmental database with tools for data management, simulation, and information visualization to analyze sustainability performance and collaborate on metrics.
2. Why are we together today ?
Sustainability is defined as economic development that meets the needs
of the present generation without compromising the ability of future
generations to meet their own needs.
good for the good for
company society
good for the
environment
Opening
2
3. Who are we ?
Founded in May 2007; 10 person team; HQ in San Bruno, CA
Sustainable development analysis tool
Software that models embodied energy and carbon across the
extended value chain
Applications:
• Assess corporate commodity and climate price-risk
• Identify operational inefficiencies
• Identify innovation potential (opportunity)
Current Customers:
1
4. What do you do for me ?
We help companies measure and analyze sustainability data in ways that
support their Corporate Sustainability Model, and that lead to long term
corporate financial performance.
inputs processes outputs outcomes
External Sustainability Sustainability Stakeholder Long-term
Strategy performance Reactions corporate
context
(may be both financial
an output and performance
Sustainability outcome)
Structure
Internal
context Sustainability
Leadership systems,
programs,
and
actions
Business
context
Corporate cost/benefits of actions
Human &
financial
resources
Feedback Loop
2
From Mark Epstein’s ‘Making Sustainability Work’
5. Who do you help and how ?
Analysts
Procurement/SCM
Risk Analysis
Financial
Sustainability
Logistics
- Climate
Packaging
- Reputation
Energy
Designers - Commodity Price
Products
Scenarios
Services
Materials
Packaging
- Innovation potential
Buildings
- Substitution possibilities
Managers
- Dematerialization
Innovation Program
Supply Chain
Baselines
Operations
Sustainability
CSR
Performance Metrics
Executives
Sustainability Strategy
Collaboration Tools
Governance and Risk Mgt
Planning
Investor Relations
Policy and Regulation
3
5
6. How do you do it ?
Data Management Information visualization
makes it possible to collect,
helps users to better understand
store, and analyze
patterns and solve problems
enormous amounts of data
Simulation allows users to understand
inter-relatedness and to preview how
actions would impact systems overall and
avoid unintended consequences.
4
6
8. How are you different ?
Planet Metrics Hybrid Environmental Database
LCA / LCI Raw materials and processes (usage based)
Raw materials, intermediate & finished goods, services
EIO-LCA (economic based)
Facilities / Ops Electricity usage and stationary fuel combustion
Transportation Mobile fuel combustion
Price Current & historical price of electricity and fuels
Advantage: Immediate access to a pre-populated
environmental data warehouse !!
5
8
9. What else is in the hybrid database ?
Direct , Energy, and
Raw Materials & Process Supply Chain
Transportation Emissions
Emissions Calculators
Calculators
WRI Greenhouse Gas Protocol
BEA Consumer and EPA eGrid State IEA Country Emissions
Data Distillation & Normalization
Carbon Disclosure Project
US DOE, US EPA, DEFRA
Producer Price Index
Emissions Factors
Factors
Transport Distance
EIO-LCA Data
GaBi (EcoInvent)
Calculators
(UK), IPCC
Franklin
NREL
BEES EPA
Bureau of Economic Analysis (BEA)
Assoc LCI
LCI DB
DB
Economic Input/Output Map
European ICE (UK)
Industry LCI
US DOE
US DOT
US EPA
LCI DB
DB
DB
Australian Academic
US Canadian
US EIA
IPCC
LCI DB
Pubs
Census
LCI DB
Data Aggregation Interface & Allocation Wizards
Community Sourced Data
Customer Sourced Data
6
10. Why should I believe you ?
Our analyses are guiding the execution of this client’s
5 Yr, $109M (EBITDA) Business Sustainability
Strategy:
Transport Co2e, By Product Carbon intensity, All Products Carbon Tax Risk, China
Supplier Switching Scenarios Carbon/Energy Spend, Buildings
7
10
11. What difference will you make for me ?
Benefit/Advantage Yes, Now No, Wait
Improved ability to assess risk
Improved ability to assess opportunity
On-demand system to perform economic and
environmental analyses
Cross-functional adoption of common
sustainability metrics and tools
8
11
12. What does it cost ?
Purchase type: Software-as-a-Service (on-demand)
Monthly service price: $7,500 - $15,000 per month,
depending on number of users; contract term
One time costs: $10,000 - $30,000, depending on
model types and quantity of datasets
Term: One-year and two-year subscription options
9
12
13. Do you offer a guarantee ?
Yes, a Proof of Concept
$5,000 - $15,000 depending on model types, and datasets
Termination option – 60 days; no penalties
Getting started on a Proof of Concept:
Lay out a vision for how you’ll use carbon modeling and what
Step 1
types of models you’ll use.
Assess what data you already have, where it is and in what
Step 2
form.
Plan data migrations (if possible) with relevant business
Step 3
information systems
Upload the data you have and enable the models you need.
Step 4
Kick off and train your people on using carbon models for
Step 5
sustainability analyses.
10
14. THANK YOU
Craig Ramini
Director of Sales and Business Development
(415) 690-6633
craig@planetmetrics.com
www.planetmetrics.com