Download to read offline

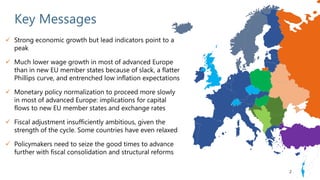

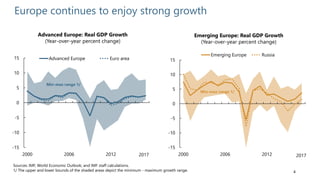
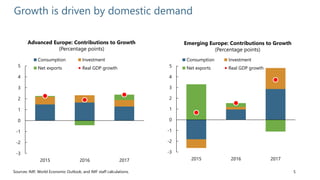
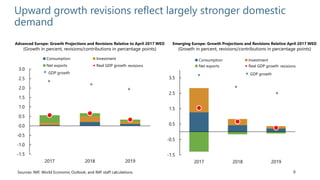
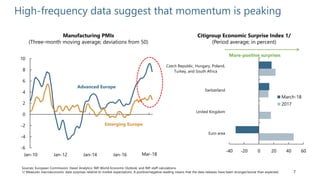

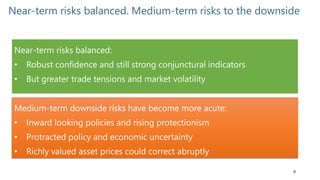
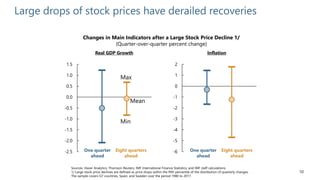
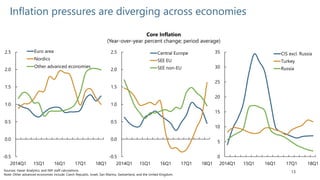

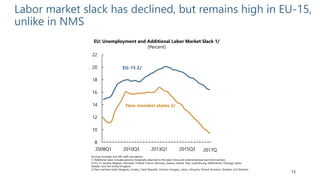
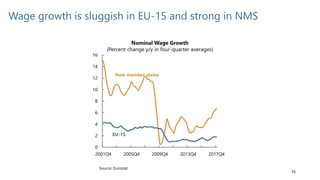

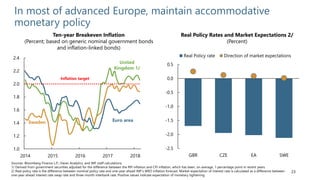
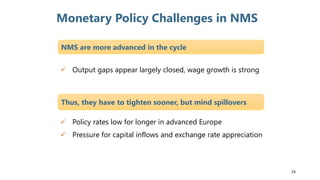


This document discusses economic trends and policy priorities in advanced and emerging Europe. It finds that while growth has been strong, leading indicators point to a peak. Inflation pressures are diverging, with sluggish wage growth in most advanced Europe but stronger growth in new EU member states. Near-term risks are balanced, but medium-term risks are to the downside. It recommends that advanced Europe use favorable economic conditions to rebuild fiscal buffers and enact structural reforms, while emerging Europe should focus on fiscal sustainability and improving institutions and business environments.


