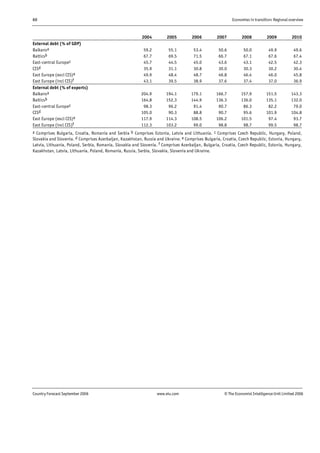
Country Forecast
Economies in transition
Eastern Europe and the former Soviet Union
Regional overview
September 2006
The Economist Intelligence Unit
26 Red Lion Square
London WC1R 4HQ
United Kingdom
The Economist Intelligence Unit
The Economist Intelligence Unit is a specialist publisher serving companies establishing andmanaging
operations across national borders. For over 50 years it has been a source of information on business
developments, economic and political trends, government regulations and corporate practice worldwide.
The Economist Intelligence Unit delivers its information in four ways: through its digital portfolio, where the
latest analysis is updated daily; through printed subscription products ranging from newsletters to annual
reference works; through research reports; and by organisingseminars and presentations. The firm is a
member of The Economist Group.
London
The Economist Intelligence Unit
26 Red Lion Square
London
WC1R 4HQ
UnitedKingdom
Tel: (44.20) 7576 8000
Fax: (44.20) 7576 8500
E-mail: london@eiu.com
New York
The Economist Intelligence Unit
The Economist Building
111 West 57th Street
New York
NY 10019, US
Tel: (1.212) 554 0600
Fax: (1.212) 586 0248
E-mail: newyork@eiu.com
Hong Kong
The Economist Intelligence Unit
60/F, Central Plaza
18 Harbour Road
Wanchai
HongKong
Tel: (852) 2585 3888
Fax: (852) 2802 7638
E-mail: hongkong@eiu.com
Website: www.eiu.com
Electronic delivery
This publication can be viewed by subscribing online at www.store.eiu.com
Reports are alsoavailable in various other electronic formats, such as CD-ROM, Lotus Notes, online databases
and as direct feeds to corporate intranets. For further information, please contact your nearest Economist
Intelligence Unit office
Copyright
© 2006 The Economist Intelligence Unit Limited. All rights reserved. Neither this publication nor
any part of itmay be reproduced, stored in a retrieval system, or transmitted in any form or byany means,
electronic, mechanical, photocopying, recording or otherwise, without the prior permission
of The Economist Intelligence Unit Limited.
All information in this report is verified to the best of the author's and the publisher's ability. However, the
Economist Intelligence Unit does not accept responsibility for any loss arising from reliance on it.
ISSN 1356-4005
Symbols for tables
“n/a” means not available; “–” means not applicable
Printed and distributed by Patersons Dartford, Questor Trade Park, 151 Avery Way, Dartford, Kent DA1 1JS, UK.
Economies in transition: Regional overview 1
Country Forecast September 2006 www.eiu.com © The Economist IntelligenceUnit Limited 2006
Contents
2 Fact sheet
3 Summary
3 Financial sector development and growth
3 Political outlook
3 Economic forecast
3 Business environment rankings
4 The subregions
5 Financial sector development and economic growth in transition
economies
5 Introduction
5 Patterns of growth
6 Sources of growth
9 Financial sectors in transition
12 Empirical results
17 Conclusions
20 Political outlook
24 Further EU enlargement
27 Economic forecast
29 Short-term outlook
35 Inflation
36 External sector
38 Foreign direct investment
43 EMU membership
49 The long-term outlook
53 Business environment rankings
55 Articles from previous issues
58 Data summary
61 Guide to the business rankings model
62 List of indicators in the business rankings model
2 Economies in transition: Regional overview
Country Forecast September 2006 www.eiu.com © The Economist IntelligenceUnit Limited 2006
Fact sheet
Annual data 2005 Historical averages (%) 2001-05
Population (m) 405.7a Population growth -0.2a
GDP (US$ bn; market exchange rates) 1,868 Real GDP growth 4.9
GDP (US$ bn; PPP) 3,788 Inflation (av) 8.3
GDP per head (US$; market exchange rates) 4,600 Current account balance (US$ bn) 15.6
GDP per head (US$; PPP) 9,760 FDI inflows/GDP 3.6
a Economist Intelligence Unit estimate.
Background: Political developments since 1989 have been dominated by the break-up of the former communist federations
and the move to multiparty parliamentary democracy. The economic transition of the east-central European countries
(Poland, Hungary, Slovenia, the Czech Republic and Slovakia) has generally proceeded more smoothly than elsewhere in
the region. The effects of war in former Yugoslavia and a slower pace of reform have determined developments in south-
eastern Europe. Political democratisation has proceeded slowly and unevenly in many former Soviet republics.
Political structure: Democratic traditions are weak in most countries in the region. The exceptions, nearly all of them in
central Europe, now have systems that approach west European practice. The communist period lasted much longer in the
former Soviet Union, and political developments in most parts of the region have been characterised by a drift
towards authoritarianism. The end of the cold war has led to open or latent disputes over boundaries and the position of
ethnic minorities.
Policy issues: The speed and extent of reform and of institutional change varies widely across the region. Countries with
proximity to Western markets and stable political outlooks have proceeded faster and more successfully with stabilisation,
liberalisation and privatisation. In parts of the Commonwealth of Independent States (CIS), the number of reform reversals
has increased since 1996. Although the post-1989 collapse in output ended by 2000, the average level of real GDP in the
region is still only around 95% of its 1989 level. The difficult tasks of financial sector reform and institution-building
represent the second stage of reforms. Institutional weaknesses, such as the weak rule of law and widespread corruption,
continue to plague much of the region.
Taxation: Most countries have carried out sweeping fiscal reforms, including the introduction of value-added tax (VAT) and
the overhaul of corporate and personal income-tax systems. Inadequate tax collection by central governments remains a
problem in many CIS and Balkan states.
Foreign trade: The collapse of the Council for Mutual Economic Assistance (CMEA, or Comecon) and the break-up of the
Soviet Union disrupted trade and output patterns. Some countries have been successful in reorienting their trade to the
West. Attempts to promote trade and integration within the CIS have so far been largely unsuccessful. Total merchandise
trade in the region in 2005 amounted to an estimated US$1.35trn. Because of the continuing large surplus in Russia, the
region's total current-account surplus in 2005 was an estimated US$43bn.
Exports (2005) US$ bn Imports (2005) US$ bn
East-central Europe 286.0 East-central Europe 292.6
Balkans 58.9 Balkans 97.3
Baltics 24.9 Baltics 32.6
CIS 345.9 CIS 216.6
Eastern Europe excl former Soviet Union 344.9 Eastern Europe excl former Soviet Union 389.9
Eastern Europe incl former Soviet Union 715.7 Eastern Europe incl former Soviet Union 639.1
Economies in transition: Regional overview 3
Country Forecast September 2006 www.eiu.com © The Economist IntelligenceUnit Limited 2006
Summary
Few empirical studies have looked specifically at the contribution of financial
sector development to transition economies' growth, although developed
financial markets have been generally assumed to be crucial to supporting
growth performance. An empirical exercise that relates GDP growth to a range
of variables finds some support for the proposition that financial sector
development—in particular the role of foreign-owned banks—had a significant
positive impact on transition economies' growth during the past decade.
The results of elections held in eastern Europe this year do not indicate any clear
shifts in regional trends or direction. Bulgaria and Romania are set to join the EU
on January 1st 2007 (at most there could have been a one-year delay until
January 2008), but this will be under the strictest conditions ever applied to new
members. Acrimonious negotiations on the final status of Kosovo appear to be
grinding towards an impasse and possible crisis. It is difficult to predict the
effects on developments in the wider region—not only in restive and resentful
Serbia, but also in Bosnia and Hercegovina (BiH), Macedonia and possibly
further afield. This is occurring when the EU's most effective instrument for
influencing developments in the region—the offer of EU membership—has been
seriously weakened by the anti-enlargement mood sweeping western Europe.
The short- and medium-term economic outlook for the transition region appears
good, despite the political uncertainty affecting many countries, with growth
averaging well above 5% per year in the forecast period of 2006-10. However,
there are risks to the baseline outlook, ranging from slow reform in much of the
Commonwealth of Independent States (CIS) to threats to the global outlook.
Risks are also associated with large external imbalances in some countries and
commodity dependence in the CIS. Across the region, rapid credit growth is a
sign of financial sector development, but it also raises concerns about financial
stability. Inflows of foreign direct investment (FDI) into eastern Europe reached a
record total of US$74.9bn in 2005. In 2006 FDI inflows are expected to increase
further to about US$79bn, before tailing off gradually in 2007-10 as major
privatisation programmes are completed. Despite its ambivalence towards FDI
in some sectors, Russia has emerged as the main FDI destination in the region.
East European business environments are expected to continue to improve over
the medium term. The intra-regional gap between the leading reformers and the
later-reforming countries will narrow.
Key indicators
Eastern Europea and CISb 2005 2006 2007 2008 2009 2010
Real GDP growthc (%) 5.6 6.4 5.7 5.2 4.8 4.6
Consumer price inflation (av; %) 9.0 7.1 7.0 6.1 5.5 5.2
Current-account balance (% of GDP) 2.5 2.8 1.9 0.9 -0.1 -1.2
a The Balkan states of Bulgaria, Croatia, Romania and Serbia and the eight new EU members in
east-central Europe and the Baltic states. b Russia, Kazakhstan, Ukraine and Azerbaijan.
c Weighted averages for the 16 countries.
Editors: Laza Kekic (editor); Stuart Hensel (consulting editor) Editorial closing date: September 15th 2006
All queries: Tel: (44.20) 7576 8000 E-mail: london@eiu.com Next report: Full schedule on www.eiu.com/schedule
Business environment
rankings
Economic forecast
Political outlook
Financial sector development
and growth
4 Economies in transition: Regional overview
Country Forecast September 2006 www.eiu.com © The Economist IntelligenceUnit Limited 2006
The subregions
The region comprises 28 countries as a result of the break-up of the Soviet, Yugoslav and Czechoslovak federations. Montenegro
became the region's latest and smallest independent state following an independence referendum on May 21st 2006. Based on
geographical and associated political criteria, four main subregions can be identified.
East-central Europe: Czech Republicab, Hungaryab, Polandab, Slovakiaab, Sloveniaab; Balkans: Albania, Bosnia and
Hercegovina, Bulgariaa, Croatiac, Macedonia, Montenegro, Romaniaa, Serbiaa; Baltics: Estoniaab, Latviaab, Lithuaniaab;
Commonwealth of Independent States (CIS): Russiaa, Ukrainea, Belarus, Moldova, Armenia, Azerbaijana, Georgia,
Kazakhstana, Kyrgyz Republic, Tajikistan, Turkmenistan, Uzbekistan
The articles and the Fact sheet refer to trends throughout the region. The medium-term economic forecast summary relates only
to east-central Europe, the Baltic states, four Balkan countries (Bulgaria, Croatia, Romania and Serbia), and four CIS countries
(Azerbaijan, Russia, Kazakhstan and Ukraine)
a Covered by individual Country Forecasts. b EU member state.
Basic data, 2005
Population
(m)
GDP per
heada
GDP per
headb
Real GDP
indexc
Growth
(av; %)d
Inflation
(av; %)d Exportse Importse
Current
accounte
East-central Europe 65.8 14,990 9,390 144.7 3.5 4.3 286.0 292.6 -19.2
Czech Republic 10.2 18,690 12,150 168.1 3.6 2.2 78.3 76.5 -2.5
Hungary 10.0 16,930 10,920 128.8 4.2 5.9 61.8 63.8 -8.0
Poland 38.2 12,940 7,940 148.6 3.0 2.7 95.8 98.5 -4.3
Slovakia 5.4 15,900 8,720 123.2 4.6 5.8 32.0 34.5 -4.1
Slovenia 2.0 23,160 17,200 135.3 3.4 5.5 18.0 19.3 -0.4
Balkans 53.0 7,960 4,020 90.0 5.2 8.5 58.9 97.3 -19.1
Albania 3.1 5,440 2,620 136.1 5.6 3.1 0.7 2.5 -0.6
Bosnia and
Hercegovina 3.9 6,130 2,560 76.9 5.0 1.8 2.6 7.5 -2.1
Bulgaria 7.7 9,150 3,480 97.2 4.9 5.3 11.7 17.1 -3.1
Croatia 4.6 12,190 8,620 97.9 4.7 2.7 9.0 18.3 -2.5
Macedonia 2.0 7,070 2,760 87.9 1.4 1.9 2.0 3.1 -0.1
Montenegro 0.6 6,710 3,290 67.1 0.0 10.8 0.5 1.2 -0.2
Romania 21.6 8,740 4,490 104.9 5.7 18.3 27.7 37.3 -8.4
Serbia 9.5 6,490f 3,230f 51.1f 5.5f 27.0f 4.6f 10.2f -2.1f
Baltics 7.1 14,280 7,710 106.9 7.8 2.7 24.9 32.6 -5.2
Estonia 1.3 16,310 9,740 126.1 7.6 3.5 7.8 9.6 -1.4
Latvia 2.3 12,920 6,860 106.9 8.1 4.0 5.3 8.3 -2.0
Lithuania 3.4 14,390 7,480 100.1 7.6 0.9 11.8 14.7 -1.8
CIS 279.8 8,230 3,510 84.0 6.8 11.0 345.9 216.6 86.3
Russia 143.4 11,010 5,320 84.0 6.1 14.8 243.6 125.3 83.6
Ukraine 46.7 6,930 1,770 58.0 7.7 8.0 35.0 36.2 2.5
Belarus 9.8 7,910 3,030 112.5 7.5 30.9 16.1 16.6 0.5
Moldova 4.0 2,540g 860g 45.5g 6.9g 10.1g 1.1g 2.3g -0.3g
Armenia 3.0 4,830 1,620 97.6 12.2 2.4 1.0 1.6 -0.2
Azerbaijan 8.4 5,210 1,490 77.5 13.5 4.5 7.6 4.3 0.2
Georgia 4.5 3,650 1,430 43.3 7.3 5.8 1.5 2.7 -0.8
Kazakhstan 15.2 8,300 3,660 103.8 10.3 7.1 28.3 18.0 -0.5
Kyrgyz Republic 5.1 2,000 480 85.2 3.7 4.1 0.7 1.1 -0.2
Tajikistan 6.8 1,270 330 54.7 9.4 15.7 1.1 1.4 0.0
Turkmenistan 6.5 6,290 980 129.1 12.0 8.5 4.9 3.6 0.3
Uzbekistan 26.3 1,990 480 109.8 4.6 14.2 4.9 3.5 1.3
Transition
economies total 405.7 9,760 4,600 95.6 4.9 8.3 715.7 639.1 42.8
a US$ at purchasing power parity. b US$ at market exchange rates. c 1989=100. d 2000-04. e US$ bn. f Data exclude Kosovo. g Data exclude the
Transdniestr region.
Economies in transition: Regional overview 5
Country Forecast September 2006 www.eiu.com © The Economist IntelligenceUnit Limited 2006
Financial sector development and economic growth
in transition economies
By Helios Padilla Mayer, Consultant to the European Investment Bank
This article investigates the role of financial sector development in explaining
economic growth during the transition. In recent years a large literature has
been built up that investigates the sources and patterns of growth during the
transition. Studies initially focused on the causes of the sharp decline in output
in the initial years of the transition, and later on the main driving forces of
recovery. Empirical investigations have assessed the impact on growth of initial
conditions at the start of transition, macroeconomic policies, privatisation and
other reforms, external conditions and other factors. Few studies have looked
specifically at the contribution of financial sector development to growth.
A growth accounting exercise to decompose the proximate sources of growth in
transition economies in 1990-94, 1995-99 and 2000-03 finds that growth in
physical capital and total factor productivity explain almost all of the growth
since the nadir of the transition recession in the mid-1990s.
It is hypothesised that effective and developed financial markets are crucial to
supporting the growth performance of transition economies, and that financial
sector development has played a significant role in facilitating increased
investment and physical capital growth, and the efficiency improvements
captured by the total factor productivity variable.
In the final part of the article, a cross-country empirical exercise that relates GDP
growth to a range of variables, including indicators of financial sector develop-
ment, examines the proposition of whether financial sector development has
had a significant positive impact on transition economies' growth.
We can distinguish between three phases of growth in the transition: 1990-94,
1995-99 and the period from 2000 (in the empirical analysis, data availability
dictates that we focus only on 2000-03 for this subperiod). During the first
phase of transition (1990-94) most economies experienced very steep declines
in GDP. In 1994 real output in the transition region as a whole was more than
one-third lower than its 1989 level. The rate of contraction varied from 12% in
east-central Europe (the Polish transition recession was the most short-lived,
only up to 1992) to 40% in the Commonwealth of Independent States (CIS).
Real GDP began to recover, in some cases strongly, in the second phase
(1995-99)—especially in the leading reformers of east-central Europe and the
Baltic states, despite the impact of the 1998 Russian financial crisis. In 1996 east-
central Europe recovered its 1989 level of output, although other subregions
remained well below their 1989 level.
Since 2000 recovery growth has spread to the entire region, including the
previously weakly performing Balkan and CIS economies. GDP growth has been
supported by buoyant private-sector activity and rapid growth in exports. High
rates of GDP growth since 2000 have occurred in many countries, despite the
Patterns of growth
Introduction
6 Economies in transition: Regional overview
Country Forecast September 2006 www.eiu.com © The Economist IntelligenceUnit Limited 2006
global economic slowdown in the early part of the decade. The strong oil-led
recovery in Russia has also had an important positive impact on many other CIS
states. By 2005 average output in the region was, however, still 4% below its 1989
level; Balkan real GDP was 10% below its 1989 level, and CIS output 16% below.
40
60
80
100
120
140
160
1989 90 91 92 93 94 95 96 97 98 99 2000 01 02 03 04 05
East-central Europe Balkans Baltics CIS
Real GDP trends
(1989=100)
Source: Economist Intelligence Unit.
We employ a standard growth accounting approach, based on the neoclassical
production function, to identify the main sources of growth during the various
transition subperiods. The level of output, Y, depends on the level of inputs—
physical capital, K, human capital, H, and labour, L—and the level of
technology, A.
The growth of output can be decomposed into the weighted growth of factor
inputs and a residual that reflects technological progress or total factor
productivity growth. Thus GY = a*GK + b*GH + c*GL + GA, where GY is growth
of real GDP, GK growth of the capital stock, GH growth in human capital and
GL growth of labour input. GA stands for the growth in total factor productivity.
Under certain assumptions, the shares of physical capital, labour and human
capital in income can be used to represent the weights a, b and c.
The variables for 1990-2003 for 26 transition economies (all except Bosnia and
Hercegovina—BiH—for which data were unavailable) were measured in the
following way. Output is represented by real GDP expressed in constant 1995
national prices. Since there are few official estimates of the physical capital stock
we use real investment growth rates as a proxy for growth rates of the physical
capital stock. Whole-economy employment levels are used to measure labour
input.1 An index based on the educational attainment of the workforce is used to
measure human capital. The index is constructed by expressing the educational
attainment (primary, secondary and tertiary levels of education) of the labour
force in each country as deviations from the sample mean.
1 Caution is called for when using employment data as a measure of labour input. The
more accurate measure would be hours worked, not a head-count. This is important since
both the business cycle and trend factors involve variations in average working hours.
Without a measure ofhours worked, the variation will be captured in the estimates oftotal
factor productivity growth. However, since data on hours worked are not available for all
countries, there is no alternative to usingnumbers ofemployed to measure labour input.
Sources of growth
Measurement
Economies in transition: Regional overview 7
Country Forecast September 2006 www.eiu.com © The Economist IntelligenceUnit Limited 2006
Table 1
Factor income shares, 1990-2003
Physical capital Labour Human capital
1990-94 1995-99 2000-03 1990-94 1995-99 2000-03 1990-94 1995-99 2000-03
East-central Europe 0.30 0.35 0.39 0.43 0.26 0.27 0.27 0.39 0.34
Balkans 0.26 0.27 0.32 0.41 0.11 0.42 0.33 0.62 0.26
Baltics 0.41 0.41 0.41 0.43 0.43 0.43 0.16 0.16 0.16
CIS 0.24 0.27 0.31 0.46 0.10 0.19 0.30 0.63 0.50
Source: Author's calculations.
In the absence of reliable or readily available data on factor income shares, many
growth accounting exercises simply assume values for the factor income shares/
weights (a, b and c) and also assume that these are the same across countries.
One way of estimating factor shares is to use the underlying production
function, and regress output on the factor inputs. We rely on this method only
in part. Dobrinsky (2001) presented data on capital income shares for the
transition economies. This was calculated on the basis of the share of the gross
operating surplus in gross output. We use Dobrinsky's approach to estimate the
capital income share for 1990-2003. This is combined with using panel
regressions that relate factor inputs to output in order to obtain estimates of
income shares for labour and human capital.
The results of our growth accounting exercise are presented in Table 2. In all
transition economies the contribution of human capital to economic growth in
all subperiods appears to have been negligible. Human capital growth rates
have been generally low during the transition. They have varied from an
annual average rate of 5% in the CIS countries, 3% in the east-central European
countries, and near to zero in the Baltic and Balkan countries. However, these
results may not be surprising, given the erosion of human capital endowments
from the initially relatively high levels inherited from the communist era (at
least in terms of educational attainment). In addition, many transition countries
have had a significant increase in tertiary education enrolment only in recent
years, and many of these additional students have not yet entered the labour
force. Therefore, it is expected that human capital will begin to have a more
significant impact on economic growth in the future.
The contribution of employment growth to economic growth has also been low,
and was negative in all country groups in 1990-94, and after that did not even
approach 1 percentage point. Under the communist regime, both participation
and employment rates were high. The initial output shock at the onset of transi-
tion was accompanied by a drastic adjustment and reflected in sharp declines in
participation and employment rates. State-owned enterprises in all transition
economies experienced large falls in employment and/or real wages in the early
1990s. In east-central Europe, the initial fall in industrial employment ranged
between 10% (in the Czech Republic and Poland) to over 20% (in Hungary).
In the early transition period investment was falling and physical capital contri-
buted negatively to economic growth. In 1995-99 physical capital made a strong
contribution to recovery in the leading reformers of east-central Europe and the
Baltics. From 2000 investment started to make a positive contribution to growth
in other subregions, which became more attractive for investment after the end
Contribution of human capital was
negligible
8 Economies in transition: Regional overview
Country Forecast September 2006 www.eiu.com © The Economist IntelligenceUnit Limited 2006
of the Balkan wars and owing to growing interest in oil and natural resources in
some CIS economies. Therefore, the growth in physical capital started to make a
significant contribution to economic growth in these subregions as well.
The contribution of total factor productivity to GDP growth is calculated as the
difference between real GDP growth and the weighted growth of factor inputs.
The contribution of total factor productivity to economic growth was negative
in 1990-94. It tended to increase throughout the period and became positive
and highly significant in all subregions, except the Balkans, in 2000-03. In east-
central Europe almost the entire annual average real GDP growth rate of 3% in
2000-03 can be explained by growth in total factor productivity. This probably
reflects the fact that this subregion was the most advanced in reform and thus
the region in which growth was most likely to be driven by improvements in
the efficiency of use of factor inputs.
Table 2
Sources of growth, 1990-2003
(percentage points of growth)
Real GDP growth Physical capital Labour force
1990-94 1995-99 2000-03 1990-94 1995-99 2000-03 1990-94 1995-99 2000-03
East-central Europe -2.32 3.67 2.98 -0.30 3.11 0.14 -1.34 0.05 -0.19
Czech Republic -2.62 0.85 2.41 -0.47 -0.31 2.04 -1.10 -0.49 0.03
Hungary -3.31 3.72 3.47 -0.03 4.66 -1.50 -3.09 0.23 0.02
Poland 1.03 5.42 2.05 -1.17 5.24 -2.40 -0.84 0.32 -0.31
Slovenia -4.99 4.10 4.13 -0.81 2.00 0.83 -0.95 0.13 -1.06
Slovakia -1.72 4.27 2.84 0.97 3.97 1.71 -0.72 0.07 0.35
Balkans -5.65 0.92 3.99 -0.21 0.69 3.44 -2.15 0.18 0.40
Baltics -11.93 4.74 6.97 -7.44 5.60 6.09 -0.96 -0.29 -0.89
Estonia -9.48 4.97 6.26 -6.69 2.27 4.99 -1.68 -0.81 -0.33
Latvia -12.88 5.00 7.30 -14.42 8.40 7.51 -1.12 -0.81 -0.07
Lithuania -13.44 4.25 7.36 -1.20 6.14 5.77 -0.08 0.76 -2.25
CIS -14.16 2.13 8.63 -4.89 0.46 4.68 -1.21 -0.24 0.13
Russia -10.28 -0.38 5.70 -6.18 -5.22 2.78 -1.31 -0.04 0.08
Ukraine -14.01 -3.87 7.92 -6.41 -1.38 3.35 -1.36 -0.21 -0.03
Human capital TFP
1990-94 1995-99 2000-03 1990-94 1995-99 2000-03
East-central Europe 0.02 0.41 0.21 -0.70 0.10 2.83
Czech Republic 0.28 0.15 0.18 -1.32 1.51 0.17
Hungary -0.03 0.70 0.80 -0.16 -1.88 4.14
Poland -0.03 0.70 0.80 3.07 -0.85 3.97
Slovenia -0.15 -0.07 -0.71 -3.07 2.04 5.07
Slovakia 0.03 0.56 -0.01 -2.00 -0.33 0.79
Balkans -0.07 0.53 -0.18 -3.11 -0.20 0.33
Baltics 0.00 0.03 0.01 -3.54 -0.60 1.76
Estonia 0.07 -0.04 -0.09 -1.18 3.55 1.69
Latvia -0.05 0.10 0.15 2.71 -2.68 -0.29
Lithuania -0.01 0.03 -0.04 -12.15 -2.67 3.88
CIS 0.15 0.24 0.06 -8.47 1.52 3.86
Russia 0.09 -0.62 -0.13 -2.88 5.51 2.97
Ukraine 0.09 0.71 -0.06 -6.32 -2.99 4.66
Source: Author's calculations.
Although a useful starting-point for at least identifying the proximate sources of
growth, the growth accounting framework cannot provide an explanation of
Total factor productivity increases begin
to drive growth
Economies in transition: Regional overview 9
Country Forecast September 2006 www.eiu.com © The Economist IntelligenceUnit Limited 2006
the underlying causes or drivers of growth (what explains factor accumulation
and total factor productivity growth). This is the case even if we abstract from
some of the measurement and methodological difficulties of growth accounting
exercises, which are especially acute in the context of the transition.
We hypothesise that financial sector development is likely to have played a
significant role in facilitating increased investment and physical capital growth,
and the efficiency improvements captured by the total factor productivity
variable. Before turning to our empirical exercise to test the hypothesis, we
briefly review in the next section the main aspects of financial sector
development of the transition economies.
The relationship between financial sector development and economic growth
has been the subject of much debate. A body of empirical work supports the
proposition that financial development contributes significantly to growth,
especially long-term growth—for example King and Levine (1993) and Levine
(1998). There is also some evidence to suggest that the link is stronger for
emerging markets—that is, less financially developed countries such as the
economies in transition. The channels of impact of financial sector
development on growth are varied and range from the mobilisation of savings
for investment to helping direct capital to its most profitable uses and thereby
boosting efficiency of the use of resources.
The creation of financial sectors compatible with a market economy was one of
the most difficult challenges for most transition economies—many of which
started practically from scratch in this respect. After the fall of the communist
regimes, transition economies needed capital to restructure the real economy. In
particular, state-owned enterprises had to modernise in order to compete in
international markets. Transition economies also needed the creation of new
enterprises that could provide basic consumer goods and services, but
entrepreneurs lacked access to start-up capital.
Most transition economies followed the same broad paradigm for the
transformation of their banking sector from the communist mono-bank system.
The standard model of financial reform involved the establishment of a two-
tier banking system, the abolition of restrictions on the internal convertibility of
money, liberalisation of interest rates, restructuring and privatisation of state
banks and their enterprise borrowers, and the entry of new private banks. At
the same time, the state had to take on the important new roles of providing
effective prudential regulation and supervision of banks.
There has been remarkable process in financial sector reform, although this pro-
gress has been uneven across regions, countries and market segments (Buiter and
Taci, 2003). There have been significant achievements in the privatisation and
restructuring of state banks in most transition economies; there has been exit by
failing institutions and entry and development of new domestic and foreign
banks; and the legal, supervisory and regulatory framework has improved,
supporting enhanced competition in the provision of banking services.
The pace and sequencing of reforms differed significantly across the transition
economies. In east-central Europe and the Baltic states, the state liberalised early
Financial sectors in transition
Remarkable progress in financial
reforms
10 Economies in transition: Regional overview
Country Forecast September 2006 www.eiu.com © The Economist IntelligenceUnit Limited 2006
the market for banking services and developed its capacity for effective
prudential supervision and regulation in step with the growing role of private
banks in the system. Elsewhere, the banking sector remained a source of directed
subsidised lending to politically well-connected, financially troubled enterprises.
Transition economies chose very different strategies for the method and speed
of privatisation of state-owned enterprises, including banks. Until 1993 or 1994
state banks still dominated the banking sector even in the advanced reforming
countries. In this period state-owned banks controlled more than 70% of
banking in Hungary, Poland and Slovakia, with the share of state banks lower
only in the Czech Republic and Estonia.
Table 3
The financial sector and transition
Asset share of state-
owned banks (%)
Asset share of foreign-
owned banks (%)
EBRD index of
banking reform
EBRD index of
non-bank financial
sector reform
1999 2004 1999 2004 1999 2005 1999 2005
East-central Europe 33.4 8.6 35.6 71.3 3.3 3.7 2.9 3.4
Czech Republic 41.2 2.9 38.4 84.9 3.3 4.0 3.0 3.7
Hungary 7.8 6.6 61.5 83.5 4.0 4.0 3.3 4.0
Poland 24.9 19.4 49.3 71.4 3.3 3.7 3.3 3.7
Slovakia 50.7 1.3 24.1 96.7 2.7 3.7 2.3 2.7
Slovenia 42.2 12.6 4.9 20.1 3.3 3.3 2.7 2.7
Balkans 55.6 13.5 23.0 63.5 2.3 3.1 1.7 2.1
Albania 81.1 51.9 18.9 47.1 2.0 2.7 1.7 1.7
Bosnia and Hercegovina 75.9 4.0 3.8 80.9 2.3 2.7 1.0 1.7
Bulgaria 50.5 2.3 42.8 81.6 2.7 3.7 2.0 2.3
Croatia 39.8 3.3 40.3 91.2 3.0 4.0 2.3 2.7
Macedonia 2.5 1.9 11.5 47.3 2.7 2.7 1.7 2.0
Romania 50.3 7.5 43.6 58.5 2.7 3.0 2.0 2.0
Serbia and Montenegro 89.0 23.4 0.4 37.7 1.0 2.7 1.0 2.0
Baltics 17.5 1.3 67.0 79.1 3.2 3.8 2.7 3.1
Estonia 7.9 0.0 89.8 98.0 3.7 4.0 3.0 3.3
Latvia 2.6 4.0 74.0 48.6 3.0 3.7 2.3 3.0
Lithuania 41.9 0.0 37.1 90.8 3.0 3.7 2.7 3.0
CIS 35.3 30.5 18.6 23.5 1.8 2.3 1.7 1.9
Russia n/a n/a 10.6 7.4 1.7 2.3 1.7 2.7
Ukraine 12.5 8.0 10.5 12.1 2.0 2.7 2.0 2.3
Belarus 66.6 70.2 2.9 20.0 1.0 1.7 2.0 2.0
Moldova 7.9 17.6 34.4 33.6 2.3 2.7 2.0 2.0
Armenia 3.5 0.0 44.3 56.7 2.3 2.7 2.0 2.0
Azerbaijan 82.5 56.1 4.4 5.8 2.0 2.3 1.7 1.7
Georgia 0.0 0.0 16.1 58.1 2.3 2.7 1.0 1.7
Kazakhstan 19.9 3.7 n/a 5.5 2.3 3.0 2.0 2.3
Kyrgyz Republic 25.8 4.1 16.5 70.1 2.0 2.3 2.0 2.0
Tajikistan 6.9 12.2 60.9 6.2 1.0 2.0 1.0 1.0
Turkmenistan 96.9 96.1 1.6 1.6 1.0 1.0 1.0 1.0
Uzbekistan 65.8 67.6 2.0 4.4 1.7 1.7 2.0 2.0
Transition economies 38.3 18.3 28.6 48.9 2.4 2.9 2.0 2.3
Memorandum item
New EU members 27.4 5.9 47.4 74.3 3.3 3.8 2.8 3.3
Note. The values of the EBRD indices range from 1 (no reform) to 4.3 (developed-country standards).
Source: EBRD, Transition Report, 2005.
Different privatisation strategies
Economies in transition: Regional overview 11
Country Forecast September 2006 www.eiu.com © The Economist IntelligenceUnit Limited 2006
Privatisation of the banking sector in the transition countries gained speed in
the mid-1990s. Over a period of a few years a drastic shift in ownership took
place. Whereas Hungary early on went for a quick sale of its banks to foreign
direct investors, Poland combined public offerings with management buyouts
and some placements with foreign strategic investors. The mass voucher
privatisation strategy of the Czech Republic and the resulting complex cross-
ownership structure of banks and enterprises led to persistent bank bailouts by
the government. The state retained a significant ownership in banks, and only
later opted for their sale to foreign strategic investors. By 1999 on average only
about one-third of banking assets remained in state hands in east-central
Europe and the CIS, and less than 20% in the Baltic states.
Large-scale privatisation was delayed in the Balkan countries. However,
Bulgaria, Croatia and Romania have made significant progress in privatisation
in recent years and the main remaining state-owned banks are in the process of
being privatised. Serbia and Macedonia have also made major progress with
bank sales to strategic investors. In some CIS countries, the government still
exerts a high degree of control over the banking sector (the exceptions are
Russia, Armenia, Kazakhstan and Tajikistan). Furthermore, the method of
privatisation has limited the gains from the ownership transformation. The
mass voucher privatisation in some CIS countries and the rapid creation of a
large number of small banks established by non-financial enterprises created
the twin problems of connected lending and excessive sectoral concentration of
bank loans.
Ongoing banking sector privatisation throughout most of the transition region
meant that by 2004 less than 20% of the region's banking assets were still in state
hands. In the new EU member states only about 6% of assets were still under
state ownership. In all, the extent of the transformation of ownership structures
in the banking sector in such a short space of time has been extraordinary.
In countries with underdeveloped financial systems such as the transition
economies, the role of foreign banks is likely to be particularly important. There
has been extensive penetration by foreign banks, which are modernising the
sector, improving efficiency and deepening financial intermediation.
Political as well as economic considerations explain the different country
experiences across the region regarding the scope and efficiency-enhancing
implications of foreign entry in the banking sector. By the beginning of this
decade foreigners had gained control of most of the assets of the banking sector
in east-central Europe (except for Slovenia) and the Baltic states. Hungary was
the first country to open its banking sector to foreign participation, but others
soon followed. The Czech Republic resisted foreign ownership of its larger
banks until the failure of several of those banks between 1996 and 1998
prompted the sale of all large banks to foreign strategic investors. Foreign entry
in the Balkan countries was initially slow, but has picked up markedly in recent
years (see Shinkman, 2004). In the CIS, the entry of foreign banks has been
restricted, with liberalisation a recent phenomenon.
Overall, however, foreign penetration of banking sectors gathered pace in most
countries after 2000, and by 2004 about 80% of bank assets in the Baltic states,
The role of foreign banks
12 Economies in transition: Regional overview
Country Forecast September 2006 www.eiu.com © The Economist IntelligenceUnit Limited 2006
70% in east-central Europe and 64% in the Balkans were in foreign hands. The
share has continued to increase since then. Only in the CIS is the average share
of foreign-owned bank assets still relatively low.
Despite the far-reaching change and financial sector reform over the past
decade, the banking sector still lags behind best practice as regards the scale and
scope of the provision of financial services. This is true even of most advanced
reformers in the region. The level of bank intermediation between domestic
savers and potential investors in the domestic real economy remains low. The
degree of development of non-banking financial institutions is less than that of
the banking system, as evidenced by the European Bank for Reconstruction and
Development (EBRD) indicators in Table 3. Despite considerable financial sector
reform, most transition economies thus display a lower degree of financial
deepening than market economies at similar levels of economic development.
Consumer credit has led the way in bank activity, and, despite continuing
problems of access to loans, enterprises in the region are also benefiting from
improved borrowing conditions and new products. The banks of the region
are likely to play an increasingly active role in the coming years. The ultimate
goal of strengthening and deepening the banking sectors of the region is, of
course, to spur faster economic growth.
There is an extensive empirical literature on growth in the transition—for
example, Fisher et al. (1997); Berg et al. (1999); Havrylyshyn et al. (1999 and
2000); Campos and Coricelli (2002); Falcetti et al. (2005). Most of these studies
use cross-section regressions, looking at average growth across the transition
countries in a given period. Some studies have used panel regressions, in which
cross-section and time-series observations are combined.
Most empirical studies have confirmed that standard growth model
assumptions perform poorly in explaining growth patterns during the unique
and turbulent period of the transition. Instead ad hoc approaches have
attempted to assess the impact on growth of initial conditions at the start of
transition, macroeconomic policies, privatisation and other reforms, external
conditions and other factors.
Few studies have looked specifically at the contribution of financial sector
development to growth. A rare exception is a study by Andriesz, Asteriou and
Pilbeam (2003), which examined Polish experience from 1990 to 2002 and
showed that financial liberalisation had a positive impact on economic growth.
They measured financial liberalisation with the EBRD indices of banking
reform, reform of non-banking financial institutions, as well as other indicators
of the development of banking sector (the number of banks, the share of
privately owned banks, and loan-deposit rate spreads).
In our empirical investigation of the impact of financial sector development on
transition economies' growth we also need to take account of other factors, or
control variables, that are likely to have influenced growth over the whole
period or in certain subperiods.
Control variables
Empirical results
Economies in transition: Regional overview 13
Country Forecast September 2006 www.eiu.com © The Economist IntelligenceUnit Limited 2006
Among the main ones considered are:
• Y, output per worker at the start of a period, to capture the convergence
hypothesis (that poor countries will grow more quickly than rich ones, other
things being equal);
• ID, a measure of initial conditions in 1990; and
• REF, a measure of overall market reforms in the first phase of transition,
1990-94.
Despite a common legacy of planning, transition economies started out under
different circumstances. There were significant differences in terms of initial
level of development, macroeconomic distortions, integration into the trading
system of the communist countries, and the extent of prior reforms. Prior
studies have shown that this had a strong impact on performance, especially in
the initial years of the transition. Our composite measure of initial conditions is
similar to the ones constructed by de Melo et al. (1997), EBRD (1997) and Falcetti
et al. (2005). It is based on six indicators of market distortions in 1990 taken
from de Melo et al.:2
• the share in GDP in 1990 of trade with countries in the Council for Mutual
Economic Assistance (CMEA, or Comecon) trading bloc;
• an estimate of "repressed inflation" in 1987-90;
• the black-market exchange-rate premium;
• a measure of the degree of "over-industrialisation";
• the number of years spent under communism; and
• a dummy variable taking the value of 1 if the transition country had a
capitalist economy for a neighbour prior to 1990, and 0 otherwise.
The extent of economic reform in 1990-94 (REF) is measured on the basis of the
EBRD's ratings for progress in various types of reforms. The various dimensions
of reform are rated for each year and each transition country on a scale of 1 to
4.3 (the standard achieved in developed countries). The indicators can be
divided into three subsets: enterprise reforms; liberalisation; and financial
institutions. Enterprise reform covers small- and large-scale privatisation and
enterprise restructuring. Liberalisation covers price liberalisation, trade and
foreign-exchange system liberalisation and competition policy. Financial sector
reform is measured by progress in banking reform and interest rate
liberalisation, and the development of securities markets and non-financial
institutions (as reported for 1999 and 2005 in Table 3). To avoid a clear overlap
with our measures of financial sector development, we omit the EBRD's
financial sector reform subset and calculate REF as the simple average of the
values of the six indicators in the enterprise reform and liberalisation subsets.
2 Other studies have used up to a dozen indicators to construct a composite index of
initial conditions.
14 Economies in transition: Regional overview
Country Forecast September 2006 www.eiu.com © The Economist IntelligenceUnit Limited 2006
Financial sector development is measured by three indicators:
LLY is the ratio of liquid liabilities to GDP, where liquid liabilities consist of
currency held outside the banking system plus demand-bearing liabilities of
banks and non-bank financial intermediaries. This indicator measures the
extent of financial intermediation.
BANK represents the role of commercial banks in the overall financial sector. It
is the ratio of commercial bank domestic assets to the sum of commercial bank
and central bank domestic assets.
FOREIGN is the share of foreign banks' assets in total bank assets.
Data were also gathered on a fourth indicator, PRIV, the ratio of claims on the
non-financial private sector to GDP. However, this indicator tended to be
insignificant or even to appear with the wrong sign in almost all the empirical
tests, probably because of a high degree of collinearity between this indicator
and other financial sector indicators.
Other control variables used in the empirical estimates include our estimates of
the growth of human and physical capital and employment growth in the
given subperiods. As with PRIV, the results were generally insignificant and are
not reproduced here.
The data in Table 4 show that in all periods the ratio of liquid liabilities to GDP
increased, but has generally still remained low, especially in the CIS countries.
Liquidity ratios have been clearly affected by different inflation rates in
transition economies. In many CIS economies throughout much of the period
liquidity ratios remained low as a result of an extensive reliance on the use of
non-monetary surrogates and barter arrangements.
Table 4
Liquidity (LLY) ratios, 1990-2003
(%)
1990-94 1995-99 2000-03
East-central Europe 37.6 44.8 51.7
Czech Republic 58.5 63.4 68.8
Hungary 39.6 39.4 41.2
Poland 21.5 29.0 39.6
Slovakia 53.2 57.8 62.2
Slovenia 15.2 34.5 46.8
Balkansa 28.6 25.4 37.2
Baltics 17.6 21.6 29.3
Estonia 14.1 24.0 35.5
Latvia 23.2 23.8 28.8
Lithuania 15.7 17.1 23.6
CISb 5.1 8.7 12.5
Russia 4.1 13.9 13.3
Ukraine 2.6 11.6 22.6
a Excluding Serbia and Montenegro. b Excluding Uzbekistan and Turkmenistan.
Source: IMF, International Financial Statistics.
Economies in transition: Regional overview 15
Country Forecast September 2006 www.eiu.com © The Economist IntelligenceUnit Limited 2006
Financial systems in transition economies have been dominated by banks. In
part this was the result of the insufficient scope and effectiveness of legal
contract enforcement, and weakly defined property rights. As the data in
Table 5 demonstrate, banking sector assets in transition countries account for a
very high proportion of overall financial assets.
Table 5
Banking sector assets/total financial assets (BANK), 1990-2003
(%)
1990-94 1995-99 2000-03
East-central Europe 85.7 85.2 84.8
Czech Republic 89.4 89.0 89.8
Hungary 99.9 99.9 99.9
Poland 68.1 69.2 69.2
Slovakia 84.8 82.7 82.0
Slovenia 86.6 85.2 83.0
Balkansa 92.7 91.3 90.4
Baltic s 85.61 84.78 84.32
Estonia 82.23 81.32 80.37
Latvia 81.43 79.25 77.89
Lithuania 93.16 93.77 94.68
CISb 93.4 92.9 92.4
Russia 88.9 88.0 89.5
Ukraine 95.7 95.2 92.7
a Excluding Serbia and Montenegro. b Excluding Uzbekistan and Turkmenistan.
Source: Bankscope.
As argued above, the entry of foreign banks was crucial for transition countries'
financial sector development. Table 6 gives the average ratios of foreign banks'
assets to total bank assets for the three subperiods in our empirical exercise.
Table 6
Foreign banks' assets/total bank assets (FOREIGN), 1990-2003
(%)
1993-94a 1995-99 2000-03
East-central Europe 12.9 20.3 39.0
Czech Republic 20.0 21.0 78.0
Hungary 33.5 49.0 76.0
Poland 5.0 16.2 68.9
Slovakia 5.0 12.2 70.4
Slovenia 1.0 3.0 16.4
Balkans 0.7 11.6 52.0
Baltics 1.0 41.6 71.0
Estonia 1.0 57.0 90.4
Latvia 1.0 53.8 79.1
Lithuania 1.0 14.0 43.7
CISb 0.0 6.1 25.1
Russia 0.0 8.0 23.8
Ukraine 0.0 5.0 12.3
a Owing to lack of data, first-period average covers 1993 and 1994 only. b Excluding Turkmenistan.
Source: Bankscope.
16 Economies in transition: Regional overview
Country Forecast September 2006 www.eiu.com © The Economist IntelligenceUnit Limited 2006
0
10
20
30
40
50
60
70
80
90
100
Czech
Republic
Hungary
Poland
Slovakia
Slovenia
Estonia
Latvia
Lithuania
Russia
Ukraine
1993-94
1995-99
2000-03
Foreign banks
(ratio of foreign banks' assets to total bank assets)
Source: Bankscope.
The estimated impact of financial development indicators on economic growth
are reported in Table 7. In the first transition period (column 1), a measure of
initial conditions (ID) seems to be the most important explanatory variable for
economic growth. Financial development indicators explain economic growth
only to a very limited extent. The coefficient on LLY is positive and statistically
significant at the 10% level. The BANK variable is actually estimated to have
had a statistically negative impact on growth. This result may not be all that
surprising, since in the stages of transition the banking sector was dominated by
underdeveloped or unreformed domestic banks.
In the second period, 1995-99 (column 2), the measure of foreign banks'
presence, FOREIGN, is included and has—as might have been expected—a
positive and highly significant impact on economic growth. Foreign banks
brought in new capital and skills. They encouraged competition and
innovation, strengthened corporate governance and management, and rendered
the sector more efficient by introducing new skills, products and technology.
Table 7
Growth and financial sector development
1990-94 1995-99 2000-03
ln Y -0.026 -0.014 -0.014
(-0.149) (-2.282)* (-2.159)*
ID90 -0.01
(-3.38)**
REF1990-94 0.002 0.007
(2.449)** (1.749)
LLY 0.002 0.002 0.002
(-2.249)* (-2.05)* (-2.053)*
BANK -0.004 -0.091 0.086
(-2.527)** (-2.998)** (3.505)**
FOREIGN 0.072** 0.066*
(5.514) (1.921)
R2 adj 0.396 0.576 0.558
Note. t statistics in parentheses; * and ** denote 10% and 5% statistical significance, respectively.
The dependent variable in each subperiod is the annual average growth rate of real GDP per worker.
The results
Economies in transition: Regional overview 17
Country Forecast September 2006 www.eiu.com © The Economist IntelligenceUnit Limited 2006
In the estimated equations LLY, BANK and FOREIGN stand for the annual
average growth rates of the ratios in the years of the given subperiod.
For 1995-99, LLY is estimated to have had a positive but only marginally
significant impact, providing further evidence for the proposition that increases
in liquidity supported economic growth. However, the BANK variable
continues to be estimated with a significant negative coefficient, as for 1990-94.
Since foreign banks did not yet represent a significant share in the total banking
system, the overall banking sector remained inefficient. However, FOREIGN is
estimated to have had a strong positive impact on growth in this subperiod.
For the 2000-03 period, LLY again has a marginally positive impact. The
banking sector is by now dominated by foreign banks and this means that
BANK is estimated to have a very strong impact on growth. The coefficient for
FOREIGN is also estimated with a positive sign, although (unlike for 1995-99) it
is only weakly significant, which is unsurprising, given the strong collinearity
for this period between BANK and FOREIGN.
Among the control variables, in addition to the role of the initial conditions
variable in explaining growth in 1990-94, output per worker at the start of a
period had a significant negative impact, in line with the convergence
hypothesis, in 1995-99 and 2000-03. The indicator of lagged market reforms in
1990-94 (REF) had a significant positive impact in 1995-99, which became much
weaker, and statistically insignificant, for 2000-03.
Our results, however, need to be treated with caution. Given the manifold
measurement and methodological difficulties that plague empirical
investigations of the determinants of growth, especially for transition
economies, our results can only be seen as suggestive and not conclusive. As in
many regression analyses, there is uncertainty as to the primary direction of
causation—whether it is from financial development to growth, or whether
financial deepening merely tends to accompany or follow growth. It is also
possible that variables that might also have been important influences on
growth have been omitted from the estimations, or that some of the financial
sector indicators are actually proxies for other factors that affected growth.
Nevertheless, there are some strong and plausible a priori arguments that
suggest that financial development has been crucial for transition economies'
growth. This is especially the case with respect to the role of foreign banks, and
this thus increases confidence in our empirical results.
Overall, our results suggest a positive growth impact of certain financial sector
development indicators—especially of foreign bank penetration—on transition
economies' growth since the mid-1990s.
Our growth accounting analysis showed that the main sources of growth for
the transition economies since the mid-1990s have been growth in physical
capital and total factor productivity growth. The contributions of total factor
productivity to economic growth were negative in the early stage of the
transition period, but then turned positive and increased thereafter in almost all
subregions. Our empirical analysis also confirmed previous findings that initial
conditions and economic reforms were in certain subperiods important
Conclusions
Caution is called for
18 Economies in transition: Regional overview
Country Forecast September 2006 www.eiu.com © The Economist IntelligenceUnit Limited 2006
determinants of transition countries' growth, as was the initial level of income
per worker.
There was also evidence that financial sector development had a positive
impact on growth. In the early stage of transition period, only an increased
liquidity had a positive effect on growth. In the second period, foreign banks
are identified as being important, since their efficiency and ability to use new
skills, products and technology in transition economies contribute strongly to
economic growth. The learning-by-doing process, spillover effects and the fact
that foreign banks acquired a majority of domestic banks appear to have
enabled banking systems to generate a strong contribution to economic growth
over the past decade.
Andriesz, Ewa; Asteriou, Dimitrios and Pilbeam, Keith (2003): The Linkage
between Financial Liberalization and Economic Development: Empirical Evidence
from Poland, Discussion Paper Series, City University Department of Economics,
London.
Berg, Andrew; Borenzstein, Eduardo; Sahay, Ratna and Zettelmeyer, Jeromin
(1999): The Evolution of Output in Transition Economies: Explaining the Differences,
IMF Working Paper no. 73.
Berglof, Erik and Bolton, Patrick (2001): The Great Divide and Beyond: Financial
Architecture in Transition, The William Davidson Institute at the University of
Michigan, Working Paper no. 414.
Buiter, Willem and Taci, Anita (2003): "Capital Account Liberalization and
Financial Sector Development in Transition Countries" in Bakker, Age F P and
Chapple, Bryan (eds), Capital Liberalization in Transition Countries: Lessons from
the Past and for the Future, Edward Elgar, Cheltenham.
Campos, Nauro F and Coricelli, Fabrizio (2002): "Growth in Transition: What We
Know, What We Don’t and What We Should", Journal of Economic Literature,
vol. 40, no. 3.
Coricelli, Fabrizio (1999): Financial Market Development and Financial
Liberalization in Economies in Transition, Mimeo, University of Sienna.
De Melo, Martha; Denizer, Cevdet; Gelb, Alan and Tenev, Stoyan (1997):
Circumstance and Choice: The Role of Initial Conditions Policies in Transition
Economies, World Bank Policy Research Working Paper no. 1866.
Dobrinsky, Rumen (2001): Convergence in Per-Capita Income Levels, Productivity
Dynamics and Real Exchange Rates in the Candidate Countries On the Way to the
EU Accession, International Institute for Applied System Analysis, Laxenberg,
Austria.
European Bank for Reconstruction and Development (EBRD): Transition Reports,
various years.
Falcetti, Elisabetta; Lysenko, Tatiana and Sanfey, Peter (2005): Reforms and
Growth in Transition: Re-examining the Evidence, EBRD Working Paper no. 90.
References
Economies in transition: Regional overview 19
Country Forecast September 2006 www.eiu.com © The Economist IntelligenceUnit Limited 2006
Fischer, Stanley; Sahay, Ratna and Vegh, Carlos: "From Transition to Market:
Evidence and Growth Prospects" in Zecchini, Salvatore (ed.), Lessons from the
Economic Transition: Central and Eastern Europe in the 1990s, Kluwer Publishers,
Dordrecht.
Giannetti, Mariassunta and Ongena, Steven (2005): Financial Integration and
Entrepreneurial Activity: Evidence from Foreign Bank Entry in Emerging Markets,
European Central Bank Working Paper Series.
Havrylyshyn, Oleh and van Rooden, Ron (2000): Institutions Matter in
Transition, but So Do Policies, IMF Working Paper no. 70.
Havrylyshyn, Oleh; Wolf, Thomas; Berengaut, Julian; Castello-Branco, Marta;
van Rooden, Ron and Mecer-Blackman, Valerie (1999): Growth Experience in
Transition Countries: 1990-98, IMF Occasional Paper no. 184.
King, Robert G and Levine, Ross (1993): "Finance, Entrepreneurship, and Growth:
Theory and Evidence", Journal of Monetary Economics, vol. 32.
Levine, Ross (1998): "The Legal Environment, Banks and Long-Run Economic
Growth", Journal of Money, Credit and Banking, vol. 30.
Shinkman, Matthew (2004), "The Banking Sector in the Countries of Former
Yugoslavia", Economies in Transition: Eastern Europe and the former Soviet
Union—Regional Overview, June 2004, Economist Intelligence Unit.
20 Economies in transition: Regional overview
Country Forecast September 2006 www.eiu.com © The Economist IntelligenceUnit Limited 2006
Political outlook
Election watch
Presidential Parliamentarya
East-central Europe
Czech Republic 2008b 2010
Hungary 2010b 2010
Poland Oct 2010 Sep 2009
Slovakia 2009 2010
Slovenia Nov 2006 2008
Balkans
Albania 2007b 2009
Bulgaria Oct 2006 2009
Bosnia and Hercegovina Oct 2006 Oct 2006
Croatia 2010 2007
Macedonia 2009 2010
Montenegro 2007 2010
Romania 2008 2008
Serbia 2009 2007
Baltics
Estonia 2006b 2007
Latvia 2007b Oct 2006
Lithuania 2009 2008
CIS
Russia Mar 2008 Dec 2007
Ukraine 2009 2011
Belarus 2011 2008
Moldova 2009b 2009
Armenia 2008 2007
Azerbaijan 2008 2010
Georgia 2009 2008
Kazakhstan 2012 2008
Kyrgyz Republic 2010 2010
Tajikistan 2006 2010
Turkmenistan 2008-10 2009
Uzbekistan Dec 2007 2009
a For lower houses unless otherwise indicated. b President chosen by parliament. In Estonia chosen
by a combination of parliament and local councils.
There have been a number of elections in the region in 2006. Parliamentary
elections were held in Ukraine in March; in Hungary in late April; in the Czech
Republic and Slovakia in June; in Macedonia in July; and in Montenegro in
September. There are still more to follow this year, with voters going to the polls
in October in Latvia to elect a new parliament. Bosnia and Hercegovina (BiH)
will hold both parliamentary and presidential elections in October. Belarus
held a presidential election in March, and Bulgaria will hold one in October.
The results of recent elections do not indicate any clear shifts in regional trends
or direction. It appeared that the victory by conservatives and populists in
Poland's parliamentary and presidential elections in 2005 might set the tone for
the rest of central Europe in 2006. In particular, it looked fairly likely that
Hungary would embrace the right-wing Fidesz-Hungarian Civic Union (Fidesz),
led by Viktor Orban. However, the ruling Hungarian Socialist Party (MSZP) won
Economies in transition: Regional overview 21
Country Forecast September 2006 www.eiu.com © The Economist IntelligenceUnit Limited 2006
the election in April, with a somewhat increased majority. This was the first
time that an incumbent had won in Hungary since the transition began.
However, the idea that this might be the beginning of a possible new regional
trend of incumbents winning elections was not confirmed in either the Czech
election—in which the ruling Czech Social Democratic Party (CSSD) lost power,
at least temporarily—or Slovakia, where the reformist coalition government of
Mikulas Dzurinda lost the election on June 17th. The same happened in
Macedonia, where the opposition Internal Macedonian Revolutionary
Organisation-Democratic Party of Macedonian National Unity (VMRO-DPMNE)
defeated the incumbent Social Democratic Alliance of Macedonia (SDSM) in
the parliamentary election on July 5th.
Thus the Hungarian result appears to have been an exception to the long-
standing trend in the region of incumbents almost invariably losing elections.
The Hungarian result may have had much to do with the inept strategy of the
right-wing opposition. Specific circumstances related to the recent successful
pro-independence drive in May affected developments in Montenegro, where
the incumbent government held comfortably on to power in recent elections.
The ruling Democratic Party of Socialists (DPS) and its coalition partner, the
Social Democratic Party (SDP), won a majority in the election held on
September 10th.
In some respects, the region appears now to be going backwards politically.
Reform momentum throughout much of the region, especially in the new EU
member states, is petering out. Poland's government is seen as eccentric—
preoccupied with cultural and national issues—and incompetent; Slovakia's as
populist and anti-reformist; Hungary's as spendthrift and ineffectual. The Czech
Republic has been unable to find a workable government following its
parliamentary election in June. Estonia, Latvia and Slovenia all have cautious or
fragile coalitions, preoccupied with sharing the fruits of power rather than with
pursuing further reform. In Slovakia and Poland the coalitions have an added
ingredient: extremist populist parties of left and right. Lithuania has a weak
minority government. Hungary's government looks weak and there are doubts
over whether it can cope with serious macroeconomic problems.
Robert Fico's leftist Smer-SD (Direction-Social Democracy) came to power in
July in Slovakia, in coalition with the far-right Slovak National Party (SNS) and
the People's Party-Movement for a Democratic Slovakia (LS-HZDS) of
authoritarian former prime minister Vladimir Meciar. The populist Mr Fico's
choice of coalition partners caused dismay among foreign investors and EU
states, not least because it threatened to undo many of the reform gains made
since 1998 under Mr Dzurinda, who had served two terms as prime minister.
The new government's programme includes a promise to halt strategic
privatisations; partly reverse tax, healthcare and pension reforms; increase taxes
for high-earners; and to boost welfare spending.
The Czech election in June was a tie. The most obvious coalition government,
of the conservative Civic Democratic Party (ODS), the Christian Democratic
Union-Czechoslovak People's Party (KDU-CSL) and the Green Party, had 100
seats, with the same number going to the CSSD, led by the outgoing prime
Political backsliding
22 Economies in transition: Regional overview
Country Forecast September 2006 www.eiu.com © The Economist IntelligenceUnit Limited 2006
minister, Jiri Paroubek, and the Communist Party of Bohemia and Moravia
(KSCM). The conservative ODS (which won a plurality of votes in the election)
is in power only until a confidence vote on October 4th, which it will almost
certainly lose. The party's leader, Mirek Topolanek, will continue as caretaker
prime minister, at least until local and Senate elections later that month.
Months of political uncertainty loom.
In Hungary, the main opposition party, Fidesz, has already launched a
campaign to transform the October municipal elections into a sort of
referendum on the fiscal austerity package adopted in July. Potential major
losses for the centre-left governing parties (coupled with loss of the Budapest
mayoralty) would intensify internal pressure both between the governing
coalition parties (the MSZP and its junior partner, the liberal Alliance of Free
Democrats) and within the senior ruling MSZP.
So far the region's well-performing economies (with the exception of Hungary)
appear to have been remarkably immune to the trend of political uncertainty
and weakness. A similar pattern can also be observed in parts of the
Commonwealth of Independent States (CIS), where good economic
performance has accompanied even worse political trends or similar political
uncertainty (for example, Ukraine's economy has been recovering strongly
despite the months-long political impasse that followed that country's
parliamentary election in March 2006). However, it cannot be assumed that this
disconnect between the economic and political developments in the region can
persist indefinitely. In many countries there are important decisions and policy
initiatives that need to be taken—such as preparing economies for euro
membership, reforming the health, pension and tax systems, and other reforms
to lay the basis for sustainable growth.
The situation in Kosovo—the breakaway Serbian province that has been run by
the UN since 1999—continues to cast a shadow over the entire region. The
security situation remains fragile, and acrimonious negotiations on the final
status of the province appear to be grinding towards an impasse and a possible
crisis. It is difficult to predict the effects on developments in the wider region—
not only in restive and resentful Serbia, but also in BiH, Macedonia and possibly
further afield. Furthermore, all this is occurring when the EU's most effective
instrument for influencing developments in the region and increasing the
chances of stability—the offer of EU membership—has been seriously eroded
and weakened by the anti-enlargement mood sweeping western Europe.
The internationally mediated talks on the status of Kosovo between the Serbian
authorities and representatives of Kosovo's ethnic Albanian majority have been
under way in Vienna since February. Little progress has been made on any of
the issues discussed so far—economic relations, minority rights, the extent of
self-government for the Serb minority in the province and its links with
Belgrade. The key issue of Kosovo's final status has not even been discussed yet.
The UN's chief negotiator, Martti Ahtisaari, is under pressure from the Western
powers to produce a solution to the intractable problem by the end of the year.
A consensus of sorts appears to have been reached among the five Western
members of the "Contact Group" (the UK, the US, France, Italy and Germany—
Risk in the Balkans
Economies in transition: Regional overview 23
Country Forecast September 2006 www.eiu.com © The Economist IntelligenceUnit Limited 2006
the remaining member is Russia) over the long-standing UK/US position of
independence for Kosovo as the preferred solution. Russia stands apart from the
rest of the Contact Group—although it remains unclear how Russia will behave
at the end of the present process. Russia has warned that the solution for
Kosovo had to be based on general principles and that it would have universal
implications, including for frozen conflicts in the former Soviet Union.
Some see Serbia's assent for independence as the key to a lasting and stable
settlement, but no Serbian government will sign an agreement that grants
Kosovo independence. Many appear to have genuinely believed that it would
be possible to entice Serbia into giving its assent to "conditional independence",
and that Serbia might be tempted by the compensation of "accelerated Euro-
Atlantic integration" (at least until French and Dutch voters put a dampener on
further EU enlargement in 2005 by rejecting the EU's constitutional treaty).
Furthermore, the decision by the EU in early May to suspend talks with Serbia
and Montenegro on a stabilisation and association agreement (SAA) owing to
the failure of Serbia to capture Ratko Mladic and extradite him to the Inter-
national Criminal Tribunal for former Yugoslavia (ICTY) in The Hague has
further complicated matters and reduced the scope for EU influence on Belgrade.
A recommendation by the West for an independent Kosovo would not be easy
to push through. It would require a new UN Security Council resolution, and
Russia might well oppose this. Today's assertive Russia is not the Russia of the
1990s that backed most Western decisions on the Balkans. Indeed, in a recent
interview with Western journalists, Russia's president, Vladimir Putin, for the
first time stated explicitly that Russia would use its veto in the UN Security
Council to prevent a solution for Kosovo that "was not acceptable to us". He
repeated warnings from earlier this year that independence for Kosovo could
not be treated as a sui generis case and that it would set a precedent for other
troubled regions, including breakaway territories in the former Soviet Union
such as Abkhazia and South Ossetia.
All this might mean a fudged solution, and at the very least delay considerably
the implementation of any envisaged Kosovo independence. The UN might be
bypassed altogether. However, this would mean a messy process of bilateral
recognitions of Kosovo and would mean that Kosovo could not become a
UN member.
Even if all these obstacles are overcome, the absence of Serbian agreement
poses risks. On the one hand, Serbian rejection may not have any practical
consequences, especially in the short to medium term. The Serbian position
would become a classical revisionist one of waiting until international
circumstances changed. Although the issue could be a harmful distraction in
Serbian political life for years, Serbia's claim over Kosovo might assume the
same character—with little practical significance—as, for example, the
constitutional commitment of the Republic of Ireland to the island's unification.
However, there could also be more immediate destabilising consequences, and
the present equanimity with which the risks for Serbia and the fallout for the
region are sometimes viewed may not prove justified.
A messy denouement
24 Economies in transition: Regional overview
Country Forecast September 2006 www.eiu.com © The Economist IntelligenceUnit Limited 2006
The EU is still struggling to recover its sense of direction following the rejection
of the EU's constitutional treaty by French and Dutch voters in mid-2005. The
agreement reached by EU heads of state and government in December 2005 on
the EU's budget for 2007-13 removed an important irritant between key
member states, but it has not restored a renewed sense of purpose. The EU is
no closer to resolving the deep disagreements among its existing member states
about the future structure and reach of the EU.
The current political climate in the EU clearly poses problems for future
enlargements. A major cause of opposition to the EU's constitutional treaty was
the perceived negative economic impact of the 2004 enlargement—namely
through competition for jobs and investment. Public opposition to further
enlargement has increased in many EU member states, along with concerns
about the ability of the EU's institutions to cope with additional members.
According to the most recent Eurobarometer poll, in the 15 "old" EU members,
only 41% of the public are now in favour of further enlargement. The French
constitution had already been amended earlier in 2005 to require referendums
to ratify any enlargement following the accession of Bulgaria, Romania and
Croatia. For many of the states still clamouring to join, there is now a risk that
political hostility to enlargement in the EU15 will close off their membership
prospects for the foreseeable future.
Bulgaria and Romania are set to join the EU on January 1st 2007 (at most there
could have been a one-year delay until January 2008), but this will be under
the strictest conditions ever applied to new members. Bulgaria, in particular,
will come under tough EU scrutiny and faces possible legal and financial
sanctions unless it demonstrates progress in tackling organised crime and high-
level corruption.
The European Commission, which is due to issue a report on the two countries'
readiness at the end of September, appears to have rejected the idea of
postponing Bulgaria or Romania's entry until 2008 on the grounds that it would
discourage reformers. However, the two countries, especially Bulgaria, are likely
to be subject to "safeguard measures"—sanctions that can be activated after a
country joins the EU. The EU has the power to suspend regional aid payments
worth billions of euro to either Bulgaria or Romania if they are shown to be
subject to persistent fraud. If Bulgaria fails to tackle crime and corruption, it
could be excluded from EU legal co-operation and its courts' judgements would
not be recognised by the EU.
In Bulgaria's case, the Commission wants the establishment of a system for
assessing farmers' claims for aid; results in investigating and prosecuting
organised crime networks; implementation of anti-corruption laws; the
enforcement of anti-money-laundering provisions; and improved financial
controls of structural and cohesion funds. The demands on Romania are
considerably less onerous and involve the setting up of an agency for dealing
with direct payments to farmers; establishing a system for assessing farmers'
claims for aid; and providing "real time" information on value-added tax (VAT)
refunds in order to fight fraud.
Further EU enlargement
Slipping support for further
enlargement
Bulgarian and Romanian EU
membership
Economies in transition: Regional overview 25
Country Forecast September 2006 www.eiu.com © The Economist IntelligenceUnit Limited 2006
Official concern in Brussels about Bulgaria's and Romania's preparations is
likely to heighten the mood of "enlargement fatigue" in the EU. There are fears
in some member states that the accession of the two poor countries in south-
eastern Europe could lead to mass immigration and increased organised crime.
In 2005 the EU decided to open membership negotiations with Croatia, after a
ruling that Croatia was co-operating fully with the ICTY in The Hague.
Macedonia has received a positive (if qualified) European Commission avis
(opinion) on its application. After long delays, on June 12th Albania signed with
the EU an SAA—the EU's main pre-candidate status instrument. The EU also
commenced negotiations on SAAs with BiH and with Serbia and Montenegro—
talks with the latter were, as mentioned, suspended at the beginning of May
because of Serbia's failure to capture and deliver Mr Mladic to the Hague war-
crimes tribunal. Montenegro is hoping that independence will provide it with a
"fast track" towards EU membership, although that looks doubtful given the
unfavourable climate to further EU expansion and the EU's concerns about
corruption, organised crime and weak administrative capacity in Montenegro.
That the process is proceeding formally is, however, hardly a surprise. It could
scarcely have been otherwise, given the challenges faced by the EU in the
region, including the Kosovo issue; the West's efforts to make BiH a unitary
state; and the fragility of Macedonia. At such a time the EU was hardly going to
jettison its main (and arguably only effective) foreign policy tool of the prospect
of membership.
Croatia's path to the EU has been smoothed by the capture last year of Croatia's
main war-crimes indictee, Ante Gotovina. However, the growing anti-
enlargement mood in many EU countries—and the wish by some to signal to
other membership aspirants that the enforcement of admission criteria will be
tougher in the future than it has been in the past—also poses potential problems
for Croatia. Even if, as expected, Croatia succeeds in implementing all the
necessary reforms for membership, its chances of admission to the EU in the
near future are uncertain. Croatia is well aware that the failure of the EU
constitution has been interpreted by leading European political figures as a vote
against further expansion. Securing the approval of all 25 member states (or 27
after Bulgaria and Romania are admitted) may prove difficult. The Treaty of
Nice, which provides for only 27 members, would also have to be amended in
order to accommodate Croatia and any other new members.
For the rest of the Balkans, the backlash against enlargement looks even more
serious. The western Balkan countries were pretty much promised eventual
membership at the EU's Thessaloniki summit in 2003. The region has struggled
to come to terms with its post-war legacy, and views future EU membership as
a key to peace and economic development. Even more than in the case of
central Europe, the hope of EU membership seems to be the main driver of
political and economic reform in the region. The conclusions of the meeting of
EU foreign ministers in Salzburg in March will hardly have reassured the
countries of the western Balkans. The closing statement confirmed that "the
future of the western Balkans lies in the EU", but added the dampener that "the
EU also notes that its absorption capacity has to be taken into account".
The western Balkans
Croatia's prospects
26 Economies in transition: Regional overview
Country Forecast September 2006 www.eiu.com © The Economist IntelligenceUnit Limited 2006
Big questions thus remain about the future of the EU accession process, as well
as its effectiveness in transforming the candidate countries. The specific French
requirement for ratification by referendum of future enlargements contributes
to doubts about the credibility of the enlargement process. The EU could string
the potential candidates along so tortuous and demanding an accession path
that it could amount to de facto exclusion. The defeat of the EU constitution has
changed the rules of the game. For several years the carrot of potential EU entry
and the stick of potential exclusion served to influence the behaviour of
political actors in the region. As the realisation sinks in that EU expansion in
even the medium term is highly unlikely, the ability of EU policymakers to
influence Balkan states will wane.
Countries such as Ukraine and Moldova continue to view EU membership as a
long-term objective. In the current climate, it is highly unlikely that these
countries will soon be considered as candidates for membership. Nevertheless,
although these countries have never featured particularly highly on the EU's
agenda, the entry to office of a Western-oriented government in Ukraine in
early 2005 has put pressure on the EU to put more flesh on its fledgling
European Neighbourhood Policy (ENP), which is envisaged as an alternative
to membership.
The prospects for further enlargement of the EU will depend in part on how
successful Europe is in resuscitating its economy. As long as millions of
Europeans are unemployed, or fear for their jobs, they will be reluctant to
welcome new EU members and their workers. Enlargement prospects will also
depend on the direction in which the EU develops. For example, greater use of
"variable geometry"—the idea that not every member state needs to take part in
every EU policy area—would make enlargement more likely. Finally, if EU
applicants are prepared to accept long derogations or "safeguards" that would
postpone their full participation in some EU policies, further enlargement might
become more politically acceptable in western Europe.
EU economic recovery may hold the key
to further enlargement
Economies in transition: Regional overview 27
Country Forecast September 2006 www.eiu.com © The Economist IntelligenceUnit Limited 2006
Economic forecast
Global outlook
2005 2006 2007 2008 2009 2010
Real GDP growth (%)
US 3.2 3.3 2.2 2.9 3.0 3.0
Euro zone 12 1.3 2.3 1.8 2.0 2.1 2.0
World (market exchange rates) 3.5 3.9 3.2 3.2 3.2 3.2
World (PPP) 4.9 5.3 4.7 4.7 4.5 4.6
World trade growth (%)
Goods 7.8 9.3 7.6 7.7 7.9 7.9
Consumer price inflation (%; av)
US 3.4 3.8 3.3 2.8 2.7 2.7
Euro zone 12 2.1 2.3 2.2 1.9 1.8 1.8
Export price inflation (%; av)
Manufactures (US$) 2.5 2.7 7.6 2.3 1.2 1.4
Commodities (% change in US$ prices)
Oil (Brent; US$/b) 54.7 71.1 70.0 59.0 48.0 45.0
Non-oil commodities 4.1 24.5 -3.8 -6.5 -11.6 -4.8
Food, feedstuffs & beverages -0.5 8.9 -4.5 0.7 -6.7 0.9
Industrial raw materials 10.3 43.6 -3.2 -13.1 -16.8 -11.5
Interest rates (%)
US$ 3-month commercial paper rate (av) 3.5 5.2 5.3 5.6 5.7 5.7
€ 3-month interbank rate (av) 2.2 3.1 3.9 3.9 3.9 3.9
Exchange rates
US$:€ (av) 1.24 1.26 1.37 1.33 1.29 1.25
¥:€ (av) 137 143 137 127 120 115
¥:US$ (av) 118 108 97 95 93 90
World GDP growth has been strong in 2006 and is expected to reach 5.3% in
the year as a whole, compared with 4.9% in 2005 (measured using purchasing
power parity—PPP—weights). But a slowdown in parts of the developed world
will soon affect world growth. In 2007 world growth is expected to slow to
4.7%, which will still represent a robust performance. Economic expansion over
the forecast period as a whole (2006-10) will average about 4.7% per year, better
even than the strong performance of the previous five years. Measured using
GDP at market exchange rates, the world economy is forecast to expand by 3.9%
in 2006 and 3.2% in 2007, a pace that will be maintained in 2008-10. The very
rapid rate of expansion of China and India means that these two countries are
driving much of the global growth, although growth has been sturdy, if not
nearly as fast, in many other regions. World activity is also benefiting from the
fact that global liquidity remains high by historical standards, notwithstanding
ongoing monetary tightening by the major central banks.
Real GDP growth in the euro zone reached a rate of 2.4% year-on-year in the
second quarter of 2006, its highest level in four and a half years. Euro zone
growth in 2006 as a whole is projected at 2.3%. A slowdown in 2007 will be
largely attributable to a contraction in consumer demand in Germany related to
a rise in value-added tax (VAT). Almost all euro zone countries will experience
at least a slight slowdown in 2007, a result of a worsening external
environment and the strengthening of the euro against the US dollar. This is
The outlook for the euro zone
28 Economies in transition: Regional overview
Country Forecast September 2006 www.eiu.com © The Economist IntelligenceUnit Limited 2006
reflected in falling measures of business confidence. Consumers in these
economies look likely to pick up the slack, at least in the short to medium term.
West European growth has a strong impact on economic activity in the new EU
members and most of the Balkan economies, given the large share of their
exports directed to western Europe. For the east-central European countries,
merchandise exports to the EU15 are on average equal to one-third of GDP.
Exports to Germany alone account for about 20% of GDP in the Czech
Republic, Hungary and Slovakia. Most new EU members in eastern Europe are
thus highly sensitive to shifts in demand in the developed west European EU
states—although most new EU members have been successful in recent years in
compensating at least in part for slow euro zone growth by redirecting trade to
faster-growing regions.
An encouraging sign for the transition economies at present is the pick-up in
their main trade partner, Germany. Real GDP growth in Germany is expected to
accelerate from 0.9% in 2005 to 2.2% in 2006. After four years of consecutive
decline the Economist Intelligence Unit expects gross fixed investment to rise in
2006 on the back of a substantial increase in corporate profits. A slight
improvement in the labour market, a stabilisation of real wages (after earlier
falls) and an improvement in confidence have boosted consumer demand.
Advance purchases ahead of the VAT increase planned for 2007 are boosting
private consumption in 2006, but the VAT rise will have the opposite effect in
2007. The VAT increase will lead to slowdown in the German economy in 2007,
with growth projected at only 1.4%.
The strong euro will prevent EU exports from growing quickly, and higher euro
zone interest rates and continuing worries about unemployment will limit the
recovery in euro zone domestic demand. Real GDP growth from 2008 is
expected to average about 2% per year, equal to the trend rate. Another factor
that will prevent faster growth will be a high ratio of savings to disposable
income in the household sector. Consumers' propensity to spend may be
dampened by fears about their governments' ability to meet pension liabilities
and healthcare costs.
The outlook for many of the economies in the Commonwealth of Independent
States (CIS) continues to be tied to Russia, which is the main export destination
for most CIS members. Strong Russian import demand has made a major
contribution to the subregion's rapid growth in recent years.
Our baseline forecast is for strong growth in the world economy over the
forecast period, but there are a number of threats that could drag down global
economic performance. The most significant global economic risks in the short
term stem from the possibility that the US slowdown could be sharper than
expected and that the US slips into recession. The main threat to the global
outlook has for some time stemmed from the large US current-account and
fiscal deficits and the implications of these for the sustainability of the
US dollar's exchange rate. A significant slide in the US dollar, as opposed to a
gradual adjustment of US imbalances, would elicit a policy response that
would lead to a sharp increase in interest rates and a recession. Western Europe
and much of the rest of the world would be likely to be seriously affected.
Russia and the CIS outlook
Economies in transition: Regional overview 29
Country Forecast September 2006 www.eiu.com © The Economist IntelligenceUnit Limited 2006
Persistently high international oil prices have threatened to drag down economic
performance in oil-importing countries—although they are boosting the short-
term prospects of CIS energy exporters. We expect prices to average about
US$70/barrel (dated Brent Blend) in 2006 and 2007. The market remains
vulnerable to supply disruptions. Although the world has become more efficient
in its use of oil than in the past (the oil intensity of economic activity has fallen
by one-half over the past 20 years), high prices are inevitably placing a heavy
burden on oil consumers. Thus, if prices should rise further, or even if they are
sustained at the present high levels, the relative immunity of world growth to oil
prices may not last.
Other risks include the threat of trade protectionism in the wake of the failure
of the Doha round of trade liberalisation talks. Rising protectionist sentiment
can also be seen around the world in measures to restrict foreign investment in
so-called strategic sectors. There is also an array of geopolitical risks in the
Middle East and elsewhere that could have a negative impact on global
economic activity.
Growth in the transition countries has remained solid despite the impact of
high oil prices on oil importers, and of domestic political uncertainty and/or
reform slowdowns in many countries. The overall outlook for the region for
2006-07 remains good, with average growth in 2006 increasing to 6.6%,
compared with 5.8% in 2005. GDP growth is forecast to drop back to 5.7% in
2007 as a result of slowing Russian growth and a decline in euro zone demand.
Throughout east-central Europe growth accelerated in the first half of 2006, often
to record levels. Surging domestic demand has tended to be the main driver of
growth, although export growth has also held up well in most countries.
Polish real GDP growth continues to accelerate, the pattern since early 2005.
Second-quarter growth reached 5.5% year on year, compared with 5.2% in the
first quarter. Gross fixed capital formation surged by 11.4% in the first half of
2006, because of more intensive use of EU funding and the improving financial
condition of Polish corporates. Private consumption growth was 4.1% in the first
half of 2006, compared with 2.4% in the same period of 2005. Net exports
continue to provide a positive contribution to growth, although this was slightly
lower in the second quarter than in the first.
Real GDP growth
(%, year on year)
2005 2006
1 Qtr 2 Qtr 3 Qtr 4 Qtr 1 Qtr 2 Qtr
Czech Republic 5.4 5.8 5.8 6.9 7.1 6.2
Estonia 7.2 9.9 10.6 11.1 11.7 12.0
Hungary 3.2 4.5 4.5 4.3 4.6 3.8
Latvia 7.6 11.4 11.4 10.5 13.1 11.1
Lithuania 4.4 8.4 7.9 8.8 8.8 8.4
Poland 2.2 2.9 3.9 4.3 5.2 5.5
Romania 5.9 4.1 2.4 4.3 6.9 7.8
Slovakia 5.4 5.4 6.3 7.4 6.3 6.7
Slovenia 2.8 5.4 3.6 3.7 5.1 4.9
Sources: National statistics; Economist Intelligence Unit.
Surge in first-half growth
Short-term outlook
30 Economies in transition: Regional overview
Country Forecast September 2006 www.eiu.com © The Economist IntelligenceUnit Limited 2006
Hungary's pace of real GDP growth remains the slowest in central Europe. It
slowed to 3.8% year on year in the second quarter of 2006, from 4.6% in the
previous quarter (which was also the slowest rate in the subregion), on the back
of a sharp slowdown in domestic demand. Exports remain the main driver of
growth—they rose by 15.1% year on year in the second quarter, although this
was down on the 18.2% growth posted in the first quarter. Gross fixed capital
formation decreased by 3.6% in the second quarter, which was triggered by the
combined effect of much lower motorway construction costs and a 9.4% drop
in real estate investments. The first-half data do not incorporate the effects of
the government's austerity package, which was adopted by parliament in July.
Further deceleration in GDP growth in the second half of the year can be
expected, triggered by the negative impact on domestic demand. An increase in
the effective corporate tax rate will put downward pressure on investment, as
will a fiscally induced slowdown in motorway construction.
The Czech Republic's real GDP growth slowed to 6.2% year on year in the
second quarter, after hitting a record high of 7.1% in the first. Private consump-
tion growth remained robust in the first half, reaching almost 4% owing to tax
cuts that have boosted disposable incomes. Fixed investment growth has also
remained firm, at some 6% year on year in the first half of 2006. The net
contribution of foreign trade to real GDP growth is weakening somewhat, as
stronger domestic demand continues to pull in larger amounts of imports.
Growth in Slovakia accelerated to 6.7% year on year in the second quarter, from
6.3% in the first (although first-half growth was down on the rate of expansion
reached in the second half of 2005). Domestic demand continued to drive GDP
growth in the second quarter, although some slowdown was more than offset
by an improvement in the performance of the external sector. Private
consumption lost some momentum, rising by 5.9%, compared with a 6.6% gain
in January-March. Investment growth slowed more sharply, to 7%, following
16% growth in the first quarter. The external sector exerted a smaller drag on
GDP than in the first quarter, owing to a sharp slowdown in import growth (to
15.1% in the second quarter, from 20.8% in the first).
Slovenia's real GDP grew by 4.9% year on year in the second quarter of 2006,
slowing slightly from the 5.1% growth in the first quarter. The importance of
consumption for GDP growth increased for the fourth quarter in a row: it
contributed 4.5 percentage points to the 4.9% growth. After brisk growth at the
beginning of the year, exports and imports slowed in the second quarter:
exports expanded at an annual rate of 8.6%, down from 14.9% in the previous
quarter, and import growth slowed to 8%, from 13.5% in the first quarter.
Consequently, the external trade balance contributed very little to GDP growth.
Romania's real GDP growth surged to 7.8% in the second quarter, so that first-
half growth amounted to 7.4%, which exceeded most expectations. Economic
growth was led by growth in construction, industry and services. Construction
increased by 14.2% year on year in the second quarter, industrial production by
7.8% and services by 7.5%. Growth at this high level is likely to be unsustainable,
as it is being driven by consumption, fuelled by strong credit growth.
Hungarylags behind
Surging growth in Romania
Economies in transition: Regional overview 31
Country Forecast September 2006 www.eiu.com © The Economist IntelligenceUnit Limited 2006
Real GDP growth continues at a very robust pace in the Baltic states, at faster
than expected rates. Latvian and Estonian real GDP grew by about 12% year on
year in the first half of 2006; Lithuania's economy lagged slightly behind its
Baltic neighbours, with "only" 8.6% growth over the same period.
In the CIS average real GDP growth was 6.5% in the first half of 2006, an
acceleration over the 5% recorded in the first quarter. There was considerable
variation in performance—ranging from the remarkably high rate of oil-driven
expansion in Azerbaijan to the sluggish performance of the Kyrgyz Republic, in
which industrial output has dropped sharply. Domestic demand—as revealed
by generally strong growth in fixed investment and retail sales volumes—has
been the main driver of growth in most of the CIS. On the supply side,
construction and consumer-related services have been the main growth areas,
with industrial production growth lagging behind.
Indicators of economic activity, Jan-Jun 2006
(% change, year on year)
Real GDP Industrial output Fixed investment Retail sales volume
Russia 6.5 4.4 9.4 11.3
Ukraine 5.0 3.6 12.2 24.7
Belarus 10.1 12.6 36.9 16.6
Moldova 6.2a -6.4 13.0 7.0
Armenia 11.9 -1.0 31.8 12.1
Azerbaijan 36.3 41.1 7.9 12.1
Kazakhstan 9.3 5.1 25.2 13.5
Kyrgyz Republic 3.1 -6.8 18.4 15.7
Tajikistan 7.1 6.3 31.0 8.8
Uzbekistan 6.6 9.7 4.5a 11.6
CIS average 6.5 5.5 12.0 13.0
Note. Data are unavailable for Georgia and Turkmenistan.
a January-March.
Sources: CIS Interstate Statistical Committee; national statistics.
In Russia real GDP growth accelerated to 7.4% in the second quarter from 5.5%
in the first (when Russia's coldest winter in a generation dampened economic
activity). Year-on-year growth in the first half of the year amounted to 6.5%. The
pick-up has been led by construction, which posted year-on-year growth of
12.3% in the second quarter, up from just 1.6% in the first quarter. The trade
sector also maintained double-digit rates of growth. The Ukrainian economy
has recently shown signs of picking up sharply, with real GDP growth in
January-July accelerating to 5.5% year on year, up from 2.6% in 2005. Growth
has been driven by a combination of rising world prices for exports, such as
steel, and increased domestic demand.
Despite political uncertainty and stalling reforms, short-term economic
prospects for east-central Europe remain good. Annual average growth in
2006-07 in the subregion is forecast to reach 4.8%, compared with 4.3% in 2005.
Rising disposable incomes and large public investment projects funded by the
EU, as well as strong inflows of foreign direct investment (FDI), are boosting
domestic demand. Import demand in the euro zone has picked up and
exporters are also proving adept at penetrating new markets, particularly China.
Good short-term prospects
32 Economies in transition: Regional overview
Country Forecast September 2006 www.eiu.com © The Economist IntelligenceUnit Limited 2006
In Poland, sluggish domestic demand caused real GDP growth to slow from
5.4% in 2004 to 3.4% in 2005. However, growth is expected to pick up strongly
to 5.2% in 2006 and to slow only to 4.8% in 2007. Consumer spending is set to
continue to grow at a rapid pace in 2006-07, and investment is expected to
increase rapidly. The dampening effect of a stronger zloty on exports will be
outweighed by rising productivity and a gradual recovery in demand in
Poland's main west European markets.
Hungary's real GDP growth is forecast to slow to 3.9% in 2006, and to 2.9% in
2007 as a result of a substantial (and long overdue) fiscal tightening. Moreover,
the risks to Hungary's outlook are greater than in the case of its neighbours.
Hungary remains the economy most at risk in the region to turmoil in emerging
markets. Investors have been taking a closer look at the country's large current-
account and fiscal deficits, both of which are running at or above 8% of GDP.
Although the government has taken steps to restrain the expansion of the fiscal
deficit, there are serious doubts about the government's ability to meet ambi-
tious deficit-reduction targets. The authorities plan to reduce the fiscal deficit by
some 4 percentage points of GDP in 2007. However, the measures will be
difficult to implement in view of legal and administrative complexities. Since
the package relies mainly on raising taxes, and not reducing spending, it may
adversely affect potential growth, not just aggregate demand in the short term.
In the Czech Republic, real GDP growth is forecast to decelerate from 6.1% in
2005 to an annual average of 5.6% in 2006-07. Domestic demand will be the
primary driver of growth. Investment activity will be supported by large public
investment projects, as a result of increased use of EU structural funds and
inflows of FDI. Private consumption growth is likely to accelerate as a
consequence of cuts in income tax, an improving labour market and the
stimulatory effects of increased investment. The net contribution of foreign trade
to real GDP growth will remain positive, but will be weaker than in 2005, as
stronger domestic demand pulls in larger amounts of imports.
Slovakia will remain the fastest-growing economy in east-central Europe. The
primary drivers of growth in 2006-07 will be investment and exports. Despite a
projected slowdown compared with 2005, capital spending will remain strong
well into 2006, as the two new car-assembly plants owned by PSA Peugeot-
Citroën (France) and Kia Motors (a division of South Korea's Hyundai) become
operational. The government will also contribute to infrastructure spending,
using privatisation proceeds and EU funding. Exports are forecast to continue to
grow strongly, owing to a recovery in demand in the euro zone and rising
automotive production, the bulk of which is destined for foreign markets.
Personal consumption growth will decelerate slightly, owing to rising interest
rates and slower real wage growth. Real GDP growth is forecast to reach 6.2% in
2006, before moderating to 5.4% in 2007.
We expect a pick-up in average growth in the Balkan economies in 2006,
although weaker external demand and policies to curb escalating external
imbalances will lead to slower growth in 2007. Growth will slow in 2006 in
Albania, Serbia and Bulgaria—and is expected to remain the same as in 2005 in
Risks to Hungary
Automotive sector underpins Slovak
expansion
Economies in transition: Regional overview 33
Country Forecast September 2006 www.eiu.com © The Economist IntelligenceUnit Limited 2006
Macedonia—but it will accelerate by more than 2 percentage points in the
subregion's largest economy, Romania.
Macroeconomic indicators
(%; annual average)
GDP growth Inflation
2005 2006 2007 2005 2006 2007
East-central Europe 4.3 5.2 4.5 2.6 2.9 3.3
Czech Republic 6.1 6.2 5.0 1.9 2.7 3.3
Hungary 4.1 3.9 2.9 3.6 3.6 6.0
Poland 3.4 5.2 4.8 2.1 1.3 2.0
Slovakia 6.1 6.2 5.4 2.7 4.3 2.8
Slovenia 3.9 4.0 4.2 2.5 2.4 2.4
Balkans 4.7 5.7 5.0 5.5 5.9 4.4
Albania 5.5 5.0 6.0 2.4 2.8 2.5
Bosnia and Hercegovina 5.0 5.3 5.3 4.5 7.6 4.0
Bulgaria 5.5 5.0 4.5 5.0 7.4 4.3
Croatia 4.3 4.5 4.5 3.3 3.4 2.7
Macedonia 4.0 4.0 4.5 0.0 3.0 2.0
Montenegro 4.1 6.0 6.0 3.4 2.5 3.5
Romania 4.1 6.5 5.0 9.0 7.2 5.6
Serbia 6.3 6.0 5.5 16.1 13.6 10.7
Baltics 8.8 8.8 7.4 4.5 4.7 3.8
Estonia 9.8 9.5 8.2 4.1 4.3 3.2
Latvia 10.3 9.7 7.5 6.7 6.3 4.8
Lithuania 7.5 7.9 7.0 2.7 3.6 3.3
CIS 6.5 7.3 6.3 8.6 8.8 8.6
Russia 6.4 6.5 5.9 12.7 9.8 9.3
Ukraine 2.6 6.3 6.0 13.5 8.0 10.0
Belarus 9.2 8.8 6.0 10.3 7.7 12.6
Moldova 7.1 4.5 5.5 11.9 12.8 12.5
Armenia 14.0 9.0 8.0 0.6 8.7 2.8
Azerbaijan 26.4 33.0 17.5 9.6 7.7 7.7
Georgia 9.3 8.8 6.4 8.2 10.0 8.1
Kazakhstan 9.4 9.0 8.7 7.6 8.7 7.1
Kyrgyz Republic -0.6 2.0 4.0 4.3 6.4 7.0
Tajikistan 6.7 7.0 7.2 7.1 7.5 6.5
Turkmenistan 6.0 13.0 3.0 10.6 11.0 11.3
Uzbekistan 7.0 6.5 6.7 6.9 7.5 8.1
New EU members 4.7 5.6 4.8 3.3 3.6 3.5
Transition economies total 5.8 6.6 5.7 6.2 6.5 5.9
The short-term outlook in the Baltic states remains very promising. The average
growth rate in the subregion in 2006 is expected to match that of 2005 (8.8%).
Despite a deceleration in 2007 to a projected 7.4%, growth will remain
considerably more rapid than in east-central Europe. Domestic demand growth
has been strong, but solid performance by the region's highly competitive export
sectors has also driven growth. The Baltic states are benefiting greatly from
strong flows of FDI, and their exports are shifting up the value chain, allowing
Estonia, Latvia and Lithuania to hold their own against Asian competitors.
Economic performance in the CIS has been strong over the past few years,
despite slow structural reforms. Some of this is the result of a bounce-back from
the steep post-Soviet decline. Other factors are also at work, particularly in the
Baltic economies continue to surge
34 Economies in transition: Regional overview
Country Forecast September 2006 www.eiu.com © The Economist IntelligenceUnit Limited 2006
drivers of growth in the region. High oil prices are clearly important for the
main energy exporters—Russia, Kazakhstan and Azerbaijan. Increased export
earnings have driven growth in investment and consumption. Moreover, both
the western CIS and Central Asia have benefited from the import boom in
Russia and Asia, particularly China. The region's dependence on the energy
industry means that, in the absence of diversification, moderating oil prices and
production trends will continue to drive GDP growth. In several countries,
domestic demand has also been boosted by substantial inflows of remittances
(Armenia, Georgia, the Kyrgyz Republic, Moldova, Tajikistan).
We forecast that average growth in the CIS will accelerate to 7.3% in 2006—one
of the fastest rates of expansion in the world, outside of China—before
moderating to a projected 6.3% in 2007. In Russia, real GDP growth is expected
to reach 6.5% in 2006, before slowing to 5.9% in 2007. Strong consumer demand
will continue to fuel growth, and we expect investment growth to remain at
recent robust rates of around 10% per year. However, sluggish growth in the oil
and gas sector and the gradual erosion of competitiveness in the non-oil sector
will limit export growth and boost import growth.
Nowhere has the disconnect between unstable politics and weak policymaking
and economic performance been more evident than in Ukraine. Politically, the
past few years in Ukraine have been characterised by the turmoil of a disputed
presidential election, a popular revolt and most recently by months of gridlock
following the indecisive outcome of a general election. Nevertheless, the
country is experiencing a recovery in growth and increasing foreign investment.
The recent resolution of Ukraine's political stalemate augurs well for the
outlook in 2007. The end to election-related uncertainties is already encouraging
investment. Although real personal income growth will slow—as price rises for
gas and other utilities in 2006 have a dampening effect on disposable
incomes—earnings growth should still be sufficient to ensure fairly strong
household consumption growth.
0.0
2.0
4.0
6.0
8.0
10.0
12.0
Czech
Republic
Hungary
Poland
Slovakia
Slovenia
Bulgaria
Croatia
Romania
Estonia
Latvia
Lithuania
Russia
Ukraine
2005
2006
2007
Source: Economist Intelligence Unit.
Real GDP growth
(%)
The main reason behind Azerbaijan's stellar GDP growth rate is that its oil
production is rising at an annual rate of about 40%. Nearly all of Azerbaijan's
oil output is exported, and the Baku-Tbilisi-Ceyhan (BTC) pipeline came on
stream in early June, enabling Azerbaijani oil to reach Western markets. Gas
Recovery in Ukraine
Economies in transition: Regional overview 35
Country Forecast September 2006 www.eiu.com © The Economist IntelligenceUnit Limited 2006
production is also set to increase by about 20% in 2006, once the Shah Deniz
field comes on stream in late September or early October. The boom in oil
exports is also boosting domestic demand; investment in sectors such as
construction is still rising strongly; large wage rises (wages rose by a cumulative
30% in 2004-05 in real terms and are forecast to increase by a further 14% in
2006) are driving growth in private consumption; and the government is raising
budget spending by about 60% in nominal terms in 2006. Import growth,
although remaining strong, is forecast to weaken slightly, now that the major
construction work on the oil and gas pipelines has been completed.
Elsewhere in the Caucasus, economic growth should also remain strong in
Armenia. In Central Asia, rapid economic growth is expected to continue in
Tajikistan, but some moderation of output growth is expected in the other
Central Asian CIS economies. Authoritarianism, secrecy and market distortions
mean that the statistical data published in Turkmenistan (and to a lesser extent
in Uzbekistan) are highly suspect. Official figures will continue to show strong
growth over the forecast period, but output growth is over-reported and is
valued at administratively set prices.
The commodity price boom has complicated efforts to diversify production and
exports away from primary goods. Attracted by high expected export earnings,
investment—both domestic and foreign-financed—has focused mainly on
extractive industries (Azerbaijan, Turkmenistan) or on commodity transport
infrastructure (oil and gas pipeline projects in Armenia, Azerbaijan, Georgia,
Kazakhstan). The overall level of investment in the region remains low (at 20%
of GDP)—the recent recovery notwithstanding—which casts doubt on the
sustainability of current growth rates over the medium term.
Despite the benign baseline outlook for the transition region, there are a number
of risks to the prospects for further rapid growth, ranging from slow reform in
many CIS countries to threats to the global outlook. Additional uncertainties
about east European export growth stem from the increasingly strong competi-
tive pressures coming from Asian producers. Risks to the baseline forecast are
also associated with fiscal deficits in some of the larger east-central European
economies, large external imbalances in the Balkans, and commodity depen-
dence in the CIS. Across the region, rapid credit growth is a sign that financial
sectors are developing, but it also raises concerns about future financial stability.
Average inflation in 2006 in most subregions is expected to be similar to the
rates recorded in 2005. In much of east-central Europe underlying inflationary
pressures will remain largely subdued, despite high international oil prices,
owing to structural economic changes that are driving rapid productivity
improvements. In the Balkans disinflation is expected in Romania and
Montenegro. Serbia—the only country in the subregion with double-digit
inflation—should see some reduction this year in its annual inflation rate,
although not to single digits. Elsewhere in the subregion inflation will tend to
rise in 2006 after having declined in recent years, driven by strong domestic
credit growth and high international oil prices.
In the CIS, inflation has declined in recent months, but it remains at or close to
double-digit levels in many countries, especially the oil exporters. Disinflation
Risks abound
Inflation
36 Economies in transition: Regional overview
Country Forecast September 2006 www.eiu.com © The Economist IntelligenceUnit Limited 2006
is complicated by the focus of many central banks on stabilising the nominal
exchange rate in the face of large current-account surpluses and capital inflows.
The scope for sterilisation of foreign-exchange purchases is limited by
underdeveloped domestic debt markets, and base money growth remains
above levels consistent with low, single-digit inflation rates. The danger is that
inflationary pressures may become entrenched. In some energy-importing
countries, inflationary pressures could also emerge from the prospective
repricing of fuel and gas imports.
0.0
2.0
4.0
6.0
8.0
10.0
12.0
14.0
Czech
Republic
Hungary
Poland
Slovakia
Slovenia
Bulgaria
Croatia
Romania
Estonia
Latvia
Lithuania
Russia
Ukraine
2005
2006
2007
Inflation
(av; %)
Source: Economist Intelligence Unit.
Among the new EU member states, current-account deficits are at high levels in
Hungary, Slovakia and the Baltic countries. Only in the Czech Republic, Poland,
and Slovenia are the deficits relatively modest. Large external imbalances are
also a problem in much of the Balkans, and expose these countries to
appreciable risks of external shock.
Current-account deficits in all subregions, except the CIS, are expected to widen
in 2006 compared with 2005 and generally to remain at similar levels as a share
of GDP in 2007. The region’s large current-account deficits have reflected in part
favourable investment opportunities. To varying degrees within the region,
however, the deficits have also been the result of rapid credit and consumption
growth, asset price increases and, in some cases, substantial real exchange-rate
appreciation—often in the context of limited nominal exchange-rate flexibility.
This combination of factors can lead to external vulnerabilities. In some
countries the inflows have been associated not just with private-sector financial
imbalances, but also with substantial fiscal imbalances, notably in Hungary.
In Hungary, with the current-account deficit set to run at 7-8% of GDP over the
next two years, the forint is certainly vulnerable to further weakening, despite
recent tightening by the central bank. This is creating strains in an economy
where exchange-rate exposure has increased greatly through euro-denominated
personal loans and mortgages. Hungary's fiscal austerity package may be a
case of too little, too late in the event of renewed turbulence on global
financial markets.
Of some concern is also the fact that large net capital inflows are increasingly in
the form of more volatile portfolio and so-called “other flows”, including short-
External sector
Deficits to widen in 2006
Economies in transition: Regional overview 37
Country Forecast September 2006 www.eiu.com © The Economist IntelligenceUnit Limited 2006
term debt, rather than FDI. The region became the largest recipient of net non-
FDI flows among all emerging-market regions in 2005. The important share of
lending from advanced-economy banks to their subsidiaries in “other flows”
may mitigate the risks to some extent, although any reduction in net financing
would still require substantial external adjustment.
External positions are strong in many countries in the CIS, especially fuel
exporters. For the CIS as a whole, a current-account surplus of nearly 9% of
GDP is projected for 2006 and about 7% of GDP in 2007. Large surpluses have
permitted a rapid reduction in the overall level of external debt in oil exporters,
especially by the public sector. In several countries (including Azerbaijan,
Kazakhstan and Russia), however, the private sector has accumulated
substantial foreign-currency liabilities in recent years. Although financial
soundness indicators have remained broadly stable, there is some risk of
financial instability in the face of a downturn or significant deterioration in
external conditions.
Current-account balance
US$ bn % of GDP
2005 2006 2007 2005 2006 2007
East-central Europe -19.2 -21.4 -25.6 -3.1 -3.2 -3.3
Czech Republic -2.5 -4.0 -4.9 -2.0 -2.8 -2.9
Hungary -8.0 -8.3 -9.2 -7.3 -7.7 -7.2
Poland -4.3 -4.5 -6.7 -1.4 -1.4 -1.7
Slovakia -4.1 -3.8 -3.9 -8.6 -7.0 -6.0
Slovenia -0.4 -0.8 -0.8 -1.1 -2.3 -2.1
Balkans -19.1 -24.7 -27.6 -9.0 -10.1 -9.5
Albania -0.6 -0.7 -0.7 -7.0 -7.6 -7.0
Bosnia and Hercegovina -2.1 -1.9 -2.1 -20.8 -16.8 -14.8
Bulgaria -3.1 -4.1 -4.4 -11.7 -13.4 -12.0
Croatia -2.5 -3.1 -3.3 -6.5 -7.1 -6.5
Macedonia -0.1 -0.2 -0.3 -1.4 -2.9 -3.9
Montenegro -0.2 -0.3 -0.3 -12.2 -12.3 -11.6
Romania -8.4 -11.8 -13.7 -8.6 -10.3 -10.0
Serbia and Montenegro -2.1 -2.7 -2.9 -8.7 -9.8 -8.8
Baltics -5.2 -6.8 -7.3 -9.5 -10.7 -9.5
Estonia -1.4 -1.8 -1.9 -11.0 -11.9 -10.0
Latvia -2.0 -2.5 -2.7 -12.4 -13.6 -11.8
Lithuania -1.8 -2.4 -2.7 -7.0 -8.2 -7.7
CIS 86.3 108.5 102.1 8.8 8.7 7.1
Russia 83.6 106.0 100.8 10.9 10.9 8.8
Ukraine 2.5 -1.6 -5.7 3.1 -1.6 -5.6
Belarus 0.5 -0.3 -1.1 1.6 -1.0 -2.6
Moldova -0.3 -0.7 -0.5 -10.5 -21.2 -13.8
Armenia -0.2 -0.3 -0.3 -3.9 -4.3 -4.6
Azerbaijan 0.2 5.4 9.9 1.3 28.0 37.9
Georgia -0.8 -0.7 -0.7 -11.7 -10.0 -7.8
Kazakhstan -0.5 -0.2 -0.9 -0.9 -0.3 -1.0
Kyrgyz Republic -0.2 -0.3 -0.3 -8.3 -10.9 -9.0
Tajikistan 0.0 0.1 0.1 -0.8 3.8 3.3
Turkmenistan 0.3 0.3 0.3 4.0 4.0 3.0
Uzbekistan 1.3 0.8 0.5 10.3 6.3 3.6
Transition economies total 42.8 55.5 41.6 2.3 2.5 1.6
38 Economies in transition: Regional overview
Country Forecast September 2006 www.eiu.com © The Economist IntelligenceUnit Limited 2006
-25.0
-20.0
-15.0
-10.0
-5.0
0.0
Czech
Republic
Hungary
Poland
Slovakia
Slovenia
Albania
Bosniaand
Hercegovina
Bulgaria
Croatia
Macedonia
Montenegro
Romania
Serbia
Estonia
Latvia
Lithuania
2005
2006
2007
Current account balance
(% of GDP)
Source: Economist Intelligence Unit.
FDI inflows into the transition economies of eastern Europe reached a record
total of US$74.9bn in 2005, a 13% increase on 2004. The total was for the first
time approximately equal to inflows into Latin America and the Caribbean—
traditionally the second most important emerging-market destination for FDI
(after developing Asia). FDI flows into the transition region in 2004-05 grew
strongly from relatively stagnant annual totals of US$30bn-35bn since 1999,
although the worldwide slump in FDI earlier in this decade had largely
bypassed the transition economies. The 2005 increase affected all transition
subregions and most economies in the area. The growth was the result of
relatively strong FDI flows to Russia; the completion or near-completion of
large-scale privatisation sales in some countries; a recovery of FDI into the
central European new EU member states after a sharp decline in 2003; and
ongoing strong growth in FDI into previous laggards such as the Balkans. High
commodity prices encouraged significant increases in FDI in the resource-rich
countries of the region, notably Russia, Azerbaijan and Kazakhstan. For the first
time there was a sizeable FDI inflow into Ukraine, although a significant part of
the 2005 total was the result of one investment—the US$4.8bn sale of the
steelmaker Kryvorizhstal to the Netherlands-based Mittal Steel.
In 2006 FDI flows to the transition economies are expected to increase further
from their 2005 peak. Direct investment flows to new EU member countries have
reached a plateau, with investment horizons expanding to other parts of the
region, and total FDI inflows into this group of countries in 2006, of about
US$26bn, are likely to fall back towards the 2004 level. Investment into the
Balkans—which has been rising strongly in recent years, mainly (although not
entirely) owing to large inflows into Romania—is expected to grow strongly in
2006, to a projected US$17.7bn. Again privatisation will account for most of the
total—in Romania, but also in other countries in the subregion (for example, the
recent sale of the mobile operator Mobi 63 in Serbia will bring in almost US$2bn).
FDI into the CIS is also expected to be somewhat higher in 2006 than in 2005,
mainly because ofsignificant increases in FDI into Russia and Kazakhstan.
Foreign direct investment
Economies in transition: Regional overview 39
Country Forecast September 2006 www.eiu.com © The Economist IntelligenceUnit Limited 2006
Foreign direct investment inflows
(US$ m)
2001 2002 2003 2004 2005 2006
East-central Europe 17,384 21,418 9,790 24,465 28,223 23,737
Czech Republic 5,640 8,496 2,022 4,977 10,974 7,500
Hungary 3,943 3,013 2,177 4,665 6,604 4,535
Poland 5,714 4,131 4,589 12,873 8,241 8,800
Slovakia 1,584 4,141 669 1,122 1,908 2,524
Slovenia 503 1,637 333 827 496 378
Balkans 4,240 4,304 8,667 12,431 14,768 17,725
Albania 207 135 178 341 264 275
Bosnia-Herzegovina 119 268 382 613 299 400
Bulgaria 813 905 2,097 2,560 2,614 2,400
Croatia 1,338 1,213 2,133 1,251 1,626 1,700
Macedonia 442 78 96 157 97 450
Montenegro – 87 182 74 487 400
Romania 1,157 1,144 2,239 6,470 7,900 8,900
Serbia 165 475 1,360 966 1,481 3,200
Baltics 1,120 1,251 1,390 2,444 4,640 2,750
Estonia 542 284 919 972 2,998 1,100
Latvia 132 254 292 699 632 700
Lithuania 446 713 179 773 1,009 950
CIS 7,199 9,176 15,963 26,726 27,317 34,375
Russia 2,749 3,461 7,959 15,445 14,183 21,500
Ukraine 792 693 1,424 1,715 7,808 4,200
Belarus 96 247 172 169 305 250
Moldova 53 133 78 91 225 180
Armenia 70 111 145 150 255 300
Azerbaijan 227 1,392 3,285 3,556 1,680 1,800
Georgia 110 167 339 499 448 550
Kazakhstan 2,835 2,590 2,092 4,113 1,738 4,800
Kyrgyz Republic 5 5 46 175 145 165
Tajikistan 10 36 30 272 30 80
Turkmenistan 170 276 226 354 300 300
Uzbekistan 83 65 167 187 200 250
New EU member states 18,505 22,669 11,180 26,909 32,863 26,487
Total transition economies 29,944 36,149 35,810 66,066 74,948 78,587
Sources: National statistics; IMF; Economist Intelligence Unit.
FDI inflows into the eight EU member states that joined the EU in 2004 (the
subregions of east-central Europe and the Baltic states) are expected to peak in
2007, as some outstanding privatisations are completed, and fall back
afterwards to an annual average of about US$23bn in 2008-10. The danger of a
diversion of cost-sensitive forms of FDI to even cheaper destinations looms
larger than any promise of much more relocation to these countries of
investment from the West.
Investment will then be dominated by reinvested earnings and follow-on
investment by existing FDI ventures. Despite widespread fears in some west
European states of a diversion of investment (“dislocation”) to the poorer new
members, the share of the new members in total EU25 FDI inflows in 2006-10
is forecast to be only 5%.
40 Economies in transition: Regional overview
Country Forecast September 2006 www.eiu.com © The Economist IntelligenceUnit Limited 2006
Contrary to widespread expectations, the EU’s enlargement will not lead to a
new surge in FDI into the eight east European new EU members. These countries
have already largely achieved the main benefits of integration for investment.
Further positive changes to business environments associated with EU member-
ship will be small. Some possible further improvement in risk perceptions and
the impact on FDI of fully joining the single market will largely be offset by the
effects of higher wages; the adoption of business-inhibiting aspects of EU rules;
and the possibility ofa post-accession slowdown in reform momentum.
Foreign direct investment stocks, end-2005
FDI stock (US$ bn) FDI stock per head (US$) FDI stock (% of GDP)
East-central Europe 199.2 3,027 32.2
Czech Republic 55.6 5,433 44.7
Hungary 48.8 4,878 44.7
Poland 76.2 1,998 25.1
Slovakia 13.8 2,539 29.1
Slovenia 5.3 2,701 15.7
Balkans 62.0 1,169 29.1
Albania 1.7 545 20.8
Bosnia and Hercegovina 2.1 529 20.7
Bulgaria 12.3 1,601 46.0
Croatia 12.5 2,736 31.7
Macedonia 1.3 642 23.3
Montenegro 0.8 1,334 40.6
Romania 25.5 1,178 26.2
Serbia 5.9 788 24.4
Baltics 18.1 2,561 33.2
Estonia 8.1 5,992 61.5
Latvia 4.5 1,950 28.4
Lithuania 5.6 1,624 21.7
CIS 127.8 457 13.0
Russia 64.8 452 8.5
Ukraine 16.2 347 19.6
Belarus 2.3 237 7.8
Moldova 1.0 256 34.8
Armenia 1.3 432 26.6
Azerbaijan 14.0 1,654 111.1
Georgia 2.3 523 36.6
Kazakhstan 20.8 1,367 37.4
Kyrgyz Republic 0.8 156 32.9
Tajikistan 0.5 77 22.9
Turkmenistan 2.3 352 35.7
Uzbekistan 1.4 53 11.2
Eastern Europe 261.8 2,203 31.5
Eastern Europe & the former Soviet Union 410.7 1,012 22.0
Sources: National statistics; IMF; Economist Intelligence Unit.
The share of the eight new EU members from eastern Europe in the east
European regional total is expected to decline to only one-third, compared with
the share of almost 50% in 2001-05, and higher before that. Economies in the
Balkans and the CIS, such as Ukraine and, especially, Russia, will increase their
share of regional FDI.
No new FDI surge to new EU members
Economies in transition: Regional overview 41
Country Forecast September 2006 www.eiu.com © The Economist IntelligenceUnit Limited 2006
Russia, a notable FDI laggard so far (see box: FDI into Russia), is expected to
become the main destination country in the region over the medium term
(although as a share of GDP and in per-capita terms inflows will still remain
relatively modest). Implementation of reforms will remain a serious problem,
but Russia is nevertheless expected to record an improvement in its business
environment in the medium term. Membership of the World Trade
Organisation (WTO), expected in the next couple of years, will have a positive
impact. Annual average FDI inflows into Russia are projected at about US$22bn
during the next five years. Although this will represent a notable improvement
on Russia’s past performance, it is still short of the country’s potential. Even by
2010, Russia’s total stock of inward FDI (projected at US$175bn) will amount to
less than 13% of GDP.
Other CIS energy producers will continue to attract significant FDI over the
medium term. The investment plans of a group of large and well-established
investors in the oil and gas sector mean steady inflows into Kazakhstan of
some US$5bn per year in 2006-10. In Azerbaijan the completion of several
major hydrocarbons projects in 2005-06 means that FDI inflows in the coming
years will be lower than in the recent past—annual FDI inflows into Azerbaijan
in 2001-05 averaged over 25% of GDP (one of the highest ratios in the world).
Investment in non-oil sectors will continue to be hindered by a poor overall
business environment.
FDI inflows into eastern Europe
2003 2004 2005 2006 2007 2008 2009 2010
Eastern Europe total
Inflows (US$ bn) 35.8 66.1 74.9 78.6 75.2 68.9 70.9 73.4
% of world total 5.4 8.2 7.8 6.7 6.2 5.4 5.3 5.2
Rate of growth (%) -1.0 85.7 13.3 4.9 -3.1 -8.4 2.9 3.6
% of GDP 3.0 4.3 4.1 3.5 3.0 2.5 2.4 2.3
East-central Europe
Inflows (US$ bn) 9.8 24.5 28.2 23.7 23.9 20.4 20.0 20.4
% of regional total 27.5 37.0 37.7 30.1 31.8 29.5 28.3 27.7
Rate of growth (%) -54.3 149.9 15.1 -16.0 2.9 -14.9 -1.6 1.7
% of GDP 2.2 4.6 4.6 3.4 3.0 2.4 2.3 2.2
Balkans
Inflows (US$ bn) 8.7 12.4 14.8 17.7 15.2 11.6 10.9 11.1
% of regional total 24.3 18.7 19.2 22.6 20.2 16.9 15.4 15.1
Rate of growth (%) 102.3 45.6 19.4 19.6 -13.3 -23.5 -5.9 1.1
% of GDP 5.7 6.8 6.9 7.1 5.3 3.7 3.2 2.9
Baltics
Inflows (US$ bn) 1.4 2.4 4.6 2.8 3.2 2.7 3.1 3.1
% of regional total 3.9 3.8 6.1 3.4 4.3 3.9 4.4 4.2
Rate of growth (%) 81.3 71.4 91.7 -40.2 20.8 -15.5 15.7 -0.8
% of GDP 3.6 5.3 8.3 4.2 4.2 3.3 3.4 3.1
CIS
Inflows (US$ bn) 15.9 26.7 27.3 34.4 32.9 34.2 36.8 38.9
% of regional total 44.8 40.5 36.4 44.0 43.7 49.7 51.9 53.0
Rate of growth (%) 73.7 67.9 2.2 26.0 -4.4 4.1 7.5 5.7
% of GDP 2.8 2.7 2.8 2.9 2.4 2.3 2.2 2.1
Source: Economist Intelligence Unit.
42 Economies in transition: Regional overview
Country Forecast September 2006 www.eiu.com © The Economist IntelligenceUnit Limited 2006
FDI into Russia
Foreign direct investment (FDI) inflows into Russia averaged a paltry US$3bn per year in 1998-2002, but then began to pick
up markedly. There have been a number of large-scale FDI deals in the oil and gas sector in recent years, and not all of these
were included in official FDI data (the 2003 deal between TNK and the UK’s BP, worth more than US$8bn, was conducted
through offshore vehicles). The lingering fallout from the Yukos affair and growing state pressure on the private sector have
hit the confidence of many Russian domestic investors. Foreign investors, by contrast, appear to be undaunted. According to
data from the Russian Central Bank (RCB), FDI inflows averaged some US$15bn annually in 2004-05, compared with
US$8bn in 2003 and negligible annual totals before that. The upward trend has continued into 2006. According to RCB data,
in the first half of 2006 FDI inflows reached US$14.1bn, almost equal to the total for 2005 as a whole.
Foreign investor confidence
The main sectors of investment in 2005 in Russia were manufacturing (including large amounts flowing into the
production of automobiles) and the energy sector, which accounted for 45% and 32%, respectively, of total inflows. Other
sectors that are proving attractive include banking, trade and retail and consumer goods. It may seem strange that increased
interest from foreign investors has coincided with some signs of deterioration in Russia’s investment climate. These include
the campaign against the Yukos oil company; a slowdown in structural reform; a trend towards increased state control of
the economy; and tension in political relations with the West. In the past, Russia’s attractions of market size and natural
resources had been more than offset by serious deficiencies in the business environment. Several factors explain the
narrowing of the gap between actual and potential performance. Russia has built up a track-record of several years of
stability and robust growth. There has also been a delayed reaction to the improvement in Russia’s business environment
in the early part of this decade. The award of investment-grade ratings by all three international rating agencies has also
provided a boost. Some long-standing deterrents to foreign investment have eased, such as macroeconomic and political
instability and high and unpredictable taxes.
Many investors are attracted by strong market opportunities and remain—at least outside the energy sector—unaffected by
Russia’s increased statism and the imposition of restrictions on foreign involvement. Surveys show that, despite numerous
complaints about the business environment, the majority of those doing business in Russia are satisfied with their success
and plan to expand their investments in the country. The significant increase in reinvested earnings, and their very high
share of total FDI inflows in 2003-05, is another strong sign of growing confidence.
Despite the pick-up in FDI inflows, FDI remains below potential, given the country’s obvious attractions, which include
one-third of the world’s gas reserves, around 8% of proven oil reserves, a skilled and low-cost workforce and a large
consumer goods market. The recovery in FDI has been from a very low base and Russia’s annual inflows are dwarfed by
the amounts that go into China. Even after the post-2003 upsurge, cumulative FDI inflows into Russia in 1990-2005
amounted to some US$65bn, equal to only 8.5% of GDP. This was the second-lowest ratio (marginally ahead of Belarus)
among all transition economies, and one-quarter of the average penetration ratio in east-central Europe. Russia’s share in
the transition region’s population, GDP and exports is about one-third; its share in the region’s stock of FDI is below 16%.
Restrictions on FDI
An underdeveloped infrastructure and corruption remain key impediments to FDI, as does the unpredictability with which
regulations are often applied. Investors in the natural resource sector, in particular, are facing considerable uncertainty as
Russia defines which assets it considers “strategic” and thus off-limits to foreign majority control. This clarification has been
delayed and at the moment the policy seems confused and uncertain.
There is little doubt, however, that the natural resource sector will be subject to significant limitations on foreign
participation. The government insists that foreigners cannot hold more than 49% of any venture engaged in developing a
“strategic” deposit. Currently any field with reserves of more than 150m tonnes of oil or 1trn cu metres of gas is defined as
strategic. The Ministry of Natural Resources is now considering a proposal to lower the thresholds to 50m-100m tonnes for
oil and 500bn cu metres for gas. There have also been ongoing rumours that the Russian government may seek to
renegotiate with foreign investors the production-sharing agreements (PSAs) from the 1990s that govern the development of
the large-scale Sakhalin projects.
Economies in transition: Regional overview 43
Country Forecast September 2006 www.eiu.com © The Economist IntelligenceUnit Limited 2006
The outlook
Despite the continuing problems of the business environment and the regulatory uncertainty affecting the natural resource
sector, the medium-term outlook for FDI into Russia is good. Macroeconomic fundamentals will remain strong, especially
as oil prices are expected to remain at high levels. Market opportunities will be good, despite some slowdown in growth.
Accession to the World Trade Organisation (WTO), which is expected in 2007 or 2008, should increase Russia’s
attractiveness, as will the mid-2006 liberalisation of the capital account. Russia’s consumer and retail boom is likely to
sustain a wave of joint ventures with foreign investors. More automotive investments are in the pipeline.
Survey evidence also suggests that Russia will be one of the world’s leading destinations for FDI over the next few years.
According to AT Kearney’s most recent annual survey of investors, Russia was in 2005 seen as the sixth most attractive FDI
destination in the world (up from 11th place in 2004). A survey of multinational companies undertaken by the UN
Conference on Trade and Development (UNCTAD) in 2005 placed Russia as the fourth most attractive location for FDI
(behind only China, India and the US) for 2005-08. A recent Economist Intelligence Unit survey of 400 senior executives at
multinationals found that Russia was seen as the sixth most attractive global destination for crossborder mergers and
acquisitions (M&As) over the next three years.
The share of the energy sector in FDI into Russia may fall in the coming years, given the restrictions on foreign involvement
in this sector, uncertainty about the sanctity of previous agreements and the heavier tax burden imposed on oil producers
in recent years. However, the Western oil majors will hardly shun Russia altogether. Russia is one of the few places that
offers large-scale reserves and its energy sector is one of the few in the world not closed off to foreigners. Risks in other oil-
producing regions have increased, and Russia is not engaging in Latin American-type expropriation. Although the Russian
government will not allow one of Russia’s major oil companies to fall into foreign hands, it is likely to welcome minority
participation of foreign companies, especially in difficult exploration projects.
Projected annual average FDI inflows into Russia of US$22bn in 2006-10 represent a significant amount, but will still be a
fairly modest as a proportion of GDP (at below 2% per year). In our forecasting model, FDI inflows are dependent on a
country’s GDP; our index of the quality of the business environment; US dollar wages; a measure of natural resource
endowments, a privatisation index (measuring the availability of assets for sale and the readiness to sell to foreigners); and
the share of the FDI stock in GDP at the start of the period (a measure of potential follow-on investment). The model can
also be used to estimate the extent to which FDI inflows into Russia over the next five years will still fall below potential,
despite the expected pick-up. The two crucial variables are the quality of the business environment and openness to asset
sales to foreigners, with a similar impact on overall FDI flows. A more open policy on sales (with the privatisation index
equal to the average for the transition region as a whole) would lift average annual inflows by almost 50%, to a projected
US$32bn. Similarly, if Russia’s business environment were of the average quality of those in east-central Europe, annual FDI
inflows into the country would be almost US$32bn.
There are risks even to the relatively benign baseline FDI outlook. Although a sharp and sustained plunge in oil prices is
unlikely, Russia remains highly vulnerable to that risk. Much of manufacturing will be adversely affected by real rouble
appreciation. Many negative features of the business environment will persist, including an inefficient bureaucracy and
judicial system. There are also some doubts over political stability after 2008, when the Russian president, Vladimir Putin, is
due to step down.
The countries that entered the EU in May 2004 are obliged to join European
economic and monetary union (EMU)—there are no opt-out clauses, although
the example of Sweden has shown that the commitment to join the euro zone
does not have a deadline. To qualify for entry to the euro area, an EU member
must meet the Maastricht criteria on government debt, fiscal deficits, inflation,
long-term interest rates and exchange-rate stability (see box: Economic and
monetary union). The exchange-rate criterion involves membership of the EU's
exchange-rate mechanism (ERM2) for at least two years.
Most of the new EU member states from central and eastern Europe are finding
it difficult to meet all the Maastricht criteria for entry to the euro zone. Although
Slovenia will join EMU next year, Lithuania's application to join in 2007 was
EMU membership
44 Economies in transition: Regional overview
Country Forecast September 2006 www.eiu.com © The Economist IntelligenceUnit Limited 2006
turned down after the European Central Bank (ECB) and the European
Commission ruled in May 2006 that it just failed to meet the inflation criterion.
Estonia's government was originally hoping to join in 2007, but its high
inflation rate has forced it to postpone its planned entry to 2008—and the
government acknowledged in August that even this date was looking
unattainable. Euro adoption is still a distant prospect for most of the Visegrad
countries—Hungary, the Czech Republic, Poland and Slovakia. Only the latter
appears on target to adopt the single European currency before the end of this
decade. Both the ECB and many existing members of EMU appear to be happy
to postpone the expansion of the euro zone, and, as the recent treatment of
Lithuania’s application has shown, are insisting on a very strict interpretation of
the Maastricht criteria.
Until last year the three Baltic states had assumed that they would face little
difficulty in joining the euro zone quickly. All three enjoy strong fiscal positions
with low levels of public debt, and their currencies are closely linked to the
euro. The Baltic countries' currency arrangements mean that monetary policy is
already in effect set by the ECB, so that long-term interest rates are heavily
influenced by those in the euro zone. As a result, Estonia, Latvia and Lithuania
face few problems in meeting the Maastricht criteria on currency stability, long-
term interest rates, budget deficits and the level of government debt.
However, meeting the final Maastricht criterion—that inflation over the past
12 months should be at most 1.5 percentage points higher than the average in
the three EU member states with the lowest inflation—is proving a much more
difficult task. On the latest figures, which cover the 12 months to July 2006, the
highest level of inflation consistent with the inflation criterion is 2.8%. Inflation
in Lithuania was 3.2% over this period, in Estonia it was 4.4% and in Latvia it
was 7%.
Lithuania has been particularly hard done by, as its application to join EMU in
2007 was assessed on the basis of inflation in the 12 months to March 2006
(when it failed to meet the inflation criterion by less than 0.1 percentage point),
rather in the 12 months to April, when it met the criterion. The ECB's and the
European Commission's negative assessments of Lithuania's application to join
in 2007 were confirmed at the EU summit in June 2006, despite protests from
several new member states. These complaints focused on the way that the
inflation criterion is based on the three countries in the EU (not just the euro
zone) with the lowest inflation; in fact, the inflation criterion in the past few
months is based on inflation rates in Finland, Sweden and Poland—two of
which are not members of the euro zone. The European Commission has said
that it will review this issue, but a significant relaxation of the inflation
criterion looks very unlikely.
Inflation in Lithuania is now rising, so that it is not likely to meet the inflation
criterion next year. As a result, Lithuania is now unlikely to join EMU before
2009 or 2010. Latvia had hoped to join EMU in January 2008, but may not be
able to join before 2009 at the earliest. To qualify for EMU membership in
2008, the 12-month average inflation rate would need to fall below the
Maastricht ceiling by the time that Latvia's application is assessed in 2007. With
the Latvian lat pegged to the euro and a high proportion of foreign-currency
Fast-growing Baltic states find inflation
a problem
Economies in transition: Regional overview 45
Country Forecast September 2006 www.eiu.com © The Economist IntelligenceUnit Limited 2006
lending in the banking sector, monetary policy is in effect powerless in
moderating the demand boom. A tightening of the fiscal stance will not be
forthcoming in 2006, owing to the general election scheduled for October.
Moreover, excise tax increases that had been postponed beyond 2007 in order
to help the inflation compliance effort could now increase inflation in the run-
up to 2009, potentially delaying EMU membership until 2010.
Estonia's hopes of joining the euro zone in January 2008 are facing similar
problems. Inflation in Estonia remains high—it was 5% on its national measure
in August 2006—and the latest official economic forecast predicts only a slight
fall in inflation next year. The government has informally accepted that EMU
entry in 2008 is now unlikely, and may reverse its previous decision to
postpone the excise duty increases that had been due to be implemented in
2007. Estonia now looks unlikely to enter EMU until 2010.
There are good economic grounds for relaxing the inflation criterion for
countries like the three Baltic states. Moreover, the ability of these economies to
grow rapidly, while already subject to most of the constraints of euro zone
membership, does much more to demonstrate that they are ready for EMU than
does compliance with the Maastricht criteria. Even the ECB accepts that
inflation is likely to be higher in fast-growing economies with fixed exchange
rates against the euro (the "Balassa-Samuelson effect"), but it has steadfastly
refused to relax or modify the Maastricht inflation criterion on this basis. This
strict approach, which will result in a slower expansion of the euro zone than
previously expected, may be welcome to the ECB and some of the euro zone's
existing members. Expanding the euro zone to include a new set of small but
rapidly growing economies will complicate the ECB's task of setting monetary
policy for the whole zone. Several existing EMU members may also prefer to
put off the increased competition within the single currency area that would be
brought on by the expansion of the euro zone to include several fast-growing
economies from central and eastern Europe.
Slovenia is in a more comfortable position, and successfully met the criteria for
joining the euro zone when its application was assessed in May 2006.
Economic growth is significantly slower than in the Baltic states, reducing the
significance of the Balassa-Samuelson effect. This helped Slovenia to meet the
inflation criterion and Slovenia will adopt the euro as its national currency on
January 1st 2007.
Among the other east European new EU members, only Slovakia had been
expected to join EMU before the end of the decade. Slovakia's decision in
November 2005 to follow the Baltic states and Slovenia and enter ERM2 was
ahead of the previously announced schedule and surprised most observers.
Slovakia hopes to adopt the euro in 2009 and thus had planned to join ERM2
in mid-2006. Slovakia should have little difficulty in meeting the criteria on
public debt, long-term interest rates and inflation. However, although its fiscal
position is stronger than its central European neighbours, the new Slovak
government is less committed to fiscal discipline than its predecessor, and this
may make it difficult to keep the general government deficit below 3% of GDP
in 2007—a necessary condition for EMU entry in 2009. Slovakia's new prime
minister, Robert Fico, recently reiterated to the European Commission Slovakia's
The ECB refuses to make any
concessions
Slovenia is the first new member state
to join EMU
46 Economies in transition: Regional overview
Country Forecast September 2006 www.eiu.com © The Economist IntelligenceUnit Limited 2006
commitment to euro adoption in 2009—a policy that appears at variance with
Mr Fico's plans to reverse, in part, the pro-business reforms of the previous
government and expand the welfare state.
For the other three central European countries—the Czech Republic, Hungary
and Poland—the Maastricht fiscal criterion is likely to be an insurmountable
hurdle for the next few years. Political backing for fiscal reforms remains weak
in all three. The Czech Republic is still officially targeting euro adoption in
2010, but the government's commitment to this target is weakening; Hungary
now has an official target of 2011. Poland has not even set a target for
ERM2 entry.
These countries—many of them ruled by fragile governments—will face difficult
trade-offs between satisfying the Maastricht criteria and maintaining growth in
the short and medium term. In the next few years great pressure on spending in
all these countries will also come from requirements related to the acquis
communautaire (the body of EU law), as well as obligations stemming from
NATO membership.
In Poland the main ruling party, Law and Justice (PiS), is a conservative
grouping that shows little enthusiasm for the euro. The PiS insists that euro
adoption will not happen during the term of the current government. In
practice, Poland's approach to adopting the euro is not likely to be resolved until
after the next parliamentary election, which may not take place until 2009. In
the Czech Republic, the uncertain political situation following the June
parliamentary election will make it difficult to bring down the fiscal deficit
quickly. Indeed, the current prime minister, Mirek Topolanek, recently described
as unrealistic the previous government's plan to join EMU in 2010.
In Hungary the incumbent centre-left government was re-elected in the April
2006 parliamentary election, but the task facing the authorities is even more
difficult. The government will need to bring down the budget deficit in order to
maintain confidence in the forint, but the deficit is so high—we expect a deficit
of 9% of GDP in 2006—that Hungary is unlikely to be able to meet the
Maastricht budget deficit criterion before the end of the decade.
The delay in Czech, Hungarian and Polish EMU entry will be welcome among
some euro zone members. Because these countries pose a far greater
competitive threat to the euro zone than Slovenia and the Baltic states, their
accession to EMU is more controversial.
Advocates of early membership argue that as small, open economies, already
highly integrated with the EU through trade flows, the new member states will
benefit from the stability associated with a single currency. Overall, adopting
the euro is meant to boost growth through lower interest rates, higher asset
values and the elimination of exchange-rate risk. However, others argue that the
euro was designed for mature economies, and can be inappropriate for less-
developed countries that have yet to complete far-reaching structural and
institutional changes.
In this respect the delay in joining EMU may be justified for the central
European economies. If they tried to satisfy the conditions for adopting the
How serious are the delays?
Waning enthusiasm for the euro in
central Europe
Economies in transition: Regional overview 47
Country Forecast September 2006 www.eiu.com © The Economist IntelligenceUnit Limited 2006
euro too quickly, the candidates could damage their economies. In particular,
getting inflation down to Maastricht levels should not be the priority—a view
that is supported by economic theory. As discussed, less-developed, rapidly
growing economies will, for structural reasons, tend to have higher inflation
rates than richer, slower-growing economies. A tighter monetary policy aimed
at limiting (economically justified) price rises can also stifle productivity
increases and economic growth. In addition to this, there is the risk of locking
in to the euro at a potentially uncompetitive rate.
Economic and monetary union
The Maastricht criteria
The 1992 Treaty on European Union (the Maastricht treaty), which came into force in November 1993, established a set of
criteria for participation in the third stage of European economic and monetary union (EMU). Countries need to have:
• a rate of inflation no more than 1.5 percentage points above the average of the three best-performing EU members;
• long-term interest rates not exceeding the average rates of these three low-inflation states by more than 2 percentage
points for the preceding 12 months;
• exchange rates that have fluctuated within the margins of the exchange-rate mechanism (ERM2) for at least two years;
• a general government debt/GDP ratio no higher than 60%, although a higher ratio may be permissible if it is
"sufficiently diminishing"; and
• a general government deficit not exceeding 3% of GDP, although a small and temporary excess can be permitted in
certain circumstances.
The debt criterion
The debt criterion appears to be the least significant of the five. It was not binding when the initial group of countries
joined EMU—debt in both Italy and Belgium was far above the 60% level when they were invited to join EMU and remains
so now. In any case, only Hungary among the east European new member states has a public debt/GDP ratio near the 60%
limit. There are some measurement issues in that the ratio is to be measured using the European System of Accounts
(ESA 95) definitions; the resulting figure may differ significantly from national data.
The inflation criterion
Again, there are some measurement issues in that this criterion is assessed using the HICP (harmonised index of consumer
prices) figures—which ensures that elements such as housing are treated in similar ways in all the countries. Eurostat, the
EU's statistical office, publishes HICP data for the new member states. More problematically, the inflation criterion is based
on the three EU member states with the lowest inflation, not the three euro zone members with the lowest inflation. This
means that very low inflation in countries which are not even members of the euro zone can make it more difficult to meet
the inflation criterion—the three lowest-inflation countries in the 12 months to July 2006 were Finland, Sweden and Poland
(the latter two are not members of the euro zone).
Several of the fast-growing new member states are finding it difficult to meet the inflation criterion. Thus Lithuania failed
the inflation criterion by 0.1 percentage points when its application to join EMU in 2007 was assessed by the European
Commission and the European Central Bank (ECB) in May 2006, but this was enough for the Commission to
recommend that its application be rejected. Rapidly growing economies tend to have higher inflation rates than slower-
growing countries (the "Balassa-Samuelson effect"), and this, together with the impact of high oil prices, is making it
more difficult for them to converge with the lowest-inflation members of the EU. Although members of the euro zone
with the most rapidly growing economies—Ireland being a striking example—have only managed to meet the inflation
criterion for a relatively short time, the Commission and the ECB have been adamant that the inflation criterion will not
be relaxed.
48 Economies in transition: Regional overview
Country Forecast September 2006 www.eiu.com © The Economist IntelligenceUnit Limited 2006
The interest rate criterion
The problem with the interest rate criterion is that, to a large extent, a country's level of long-term interest rates reflects
market beliefs about whether the country will successfully join EMU or not. If the markets believe that a country will
be admitted to EMU in a few years' time, short-term interest rates will be expected to be the same as in the euro zone
in the future, and, through the mechanism of the "convergence trade", this will push long-term interest rates towards
those in the euro zone. The interest rate criterion therefore may not fulfil its intended role of signalling the market's
beliefs about whether low inflation in the prospective EMU member can be sustained. More practically, long-term debt
markets are either non-existent or are very illiquid in most of the new members, although this may evolve in the next
few years.
The government deficit criterion
This will be the most difficult criterion for several countries (including Poland, Hungary and the Czech Republic) to meet,
and it is likely to delay their entry to EMU for several years. Persistent high fiscal deficits will need to be reduced
significantly in order to meet the deficit criterion, and, with no fixed target date for EMU entry, the disciplinary effect of the
deficit criterion is likely to be much weaker than it was for the existing euro zone members in the late 1990s.
As with the assessment of the debt criterion, the Eurostat ESA 95 definition of the general government deficit will be used
in assessing the deficit criterion. The ESA 95 figures often differ significantly both from national measures and from figures
using the IMF's government finance statistics (GFS) methodology. There is also uncertainty about how the effects of
pension reform should be treated in the Eurostat methodology, with most countries that have carried out such reforms
continuing to count the new pension funds as part of the government sector. Eurostat has ruled that this will not be
permitted from 2007, but the reform of the EU's Stability and Growth Pact agreed in March 2005 has been interpreted by
many as allowing those countries that have recently set up funded public pension systems (primarily Poland, Slovakia and
Hungary) to deduct a proportion of the costs of the changes from their fiscal deficits for a transitional period. However,
with Poland and Hungary likely to delay their entry to EMU to 2010 or beyond, neither country is likely to be able to
benefit significantly from these transitional arrangements, making it still more difficult for them to meet the deficit criterion.
The exchange-rate criterion
The exchange-rate criterion is only really relevant for those countries with a flexible exchange rate. Those countries with a
currency board arrangement should meet the criterion automatically, although there is a theoretical possibility that the
central rates for national currencies against the euro could be adjusted before EMU entry. In practice, the very small size of
the countries with a currency board arrangement makes this improbable, as existing EMU members are unlikely to feel that
their competitiveness is being threatened. For the other countries, the exchange-rate criterion has already attracted a lot of
debate, with some specialists viewing it as unnecessary or even dangerous, and others, especially from the European
institutions, calling for the criterion to be interpreted in a very strict way.
Many economists have criticised the "halfway house" of membership of ERM2 as being potentially destabilising. They cite
the collapse of the "old" ERM in the early 1990s as an example of the dangers of fixed-but-adjustable systems such as ERM2
in a world of free capital movements. Instead, they suggest that it would be better if the exchange-rate criterion were
abandoned and countries were allowed to leave their currencies to float freely before entering EMU.
Although it had been assumed that keeping a national currency in the wide fluctuation bands (±15%) of ERM2 would be
enough to meet the exchange-rate criterion, a series of statements from the European Commission have suggested that the
Commission intends to take a more restrictive view of currency stability—with exchange rates allowed to vary only relative
to the narrow (±2.25%) fluctuation bands of the "old" ERM. This idea has proved controversial in the larger new EU member
countries that currently have freely floating currencies, as keeping to the narrow fluctuation bands, without any
commitment from the European Central Bank (ECB) to defend them, would be far more risky for them than simple
membership of ERM2. The ECB has not gone so far as to suggest an assessment based on the previous narrow bands, but it
has said that "the assessment of the exchange rate against the euro will focus on the exchange rate being close to the central
rate". This would leave the ECB significant discretion in deciding whether a country had met the exchange-rate criterion—
mere membership of ERM2 for two years looks unlikely to be sufficient.
Economies in transition: Regional overview 49
Country Forecast September 2006 www.eiu.com © The Economist IntelligenceUnit Limited 2006
The timetable for entry to EMU
In contrast to the relaxed attitude towards the Maastricht criteria shown to several countries, notably Italy and Belgium
when the euro zone was first created, the European Commission and the ECB are taking a very strict approach to the new
EU member states' applications to join the euro zone. Of the eight east European states that joined the EU in May 2004,
only Slovenia has managed to join the euro zone quickly—it will replace the tolar with the euro on January 1st 2007. Of the
other countries, four—Estonia, Lithuania, Latvia and Slovakia—have joined ERM2 and hope to join EMU soon, although
none look likely to join in 2008, and only Slovakia now looks to have a real prospect of joining in 2009. By contrast, the
three largest economies—the Czech Republic, Hungary and Poland—are struggling with high budget deficits and do not
expect to bring these deficits below 3% of GDP for several years. Correspondingly, the political will to join EMU is waning
or suspect in all three. These countries are also reluctant to join ERM2 until they are much closer to meeting the other
criteria for adopting the euro. None of the three is expected to join EMU before the end of this decade. Bulgaria and
Romania now look virtually certain to join the EU in 2007. Both Romania and Bulgaria currently have high inflation and
fiscal policy is being relaxed this year in Romania. Bulgaria could still join EMU in 2010 but Romania looks unlikely to join
EMU this decade.
New members' and candidates' performance against the Maastricht criteria, 2005-06
(%)
HICP inflation (average) Long-term interest rates Government balance/GDP Government debt/GDP
Reference value 2.8 6.0 -3.0 60.0
Bulgaria 7.3 4.6a 3.1 29.9
Czech Republic 2.3 3.6 -2.6 30.5
Estonia 4.4 4.0 1.6 4.8
Hungary 2.9 6.7 -6.1 58.4
Latvia 7.0 3.8 0.2 11.9
Lithuania 3.2 3.8 -0.5 18.7
Poland 1.3 5.1 -2.5 42.5
Romania 8.0 6.5a -0.4 15.2
Slovakia 3.9 3.9 -2.9 34.5
Slovenia 2.6 3.7 -1.8 29.1
Note. HICP inflation rates are actuals from Eurostat for 12 months to July 2006; interest rates are actuals from the European Central Bank for
12 months to July 2006 (12 months to June 2006 for Estonia). Fiscal data are European Commission figures for 2005, with open pension funds
included as apart of the government sector.
a Figures from national sources.
Sources: Economist Intelligence Unit; European Commission; Eurostat; European Central Bank.
The medium- and longer-term outlook for the region, on our baseline
assumptions, is favourable, although growth rates will tend to decelerate over
time. FDI inflows are likely to remain fairly strong, and productivity growth
should continue to outstrip that in western Europe. Average real GDP growth of
at least 4% per year should be sustainable over the next few years in most east
European states.
However, higher rates of employment and, in some countries, investment will
be needed to underpin rapid convergence. Policies that would support further
competition and outward orientation, including deregulation and attraction of
new FDI inflows, will play a key role in sustaining rapid productivity growth.
Measures to enhance the amount and quality of domestic research and
development (R&D), and education reforms, will also be important. So will the
restructuring of remaining "strategic" or "socially important" sectors to facilitate
the flow of resources towards more productive activities.
The long-term outlook
50 Economies in transition: Regional overview
Country Forecast September 2006 www.eiu.com © The Economist IntelligenceUnit Limited 2006
For the new EU member states, membership of the EU offers a possibility—but
by no means a guarantee—of stimulating per-capita GDP growth. Given the
initial gap in development levels, and various hindrances to growth—even under
a benign overall EU scenario yielding respectable long-term growth rates—we
estimate that it would take the new EU member states between three and six
decades to catch up with average GDP per head in the EU15. The projected
average annual long-term growth rates in GDP per head are in the 3-4% range,
and it is assumed that the long-term EU15 growth rate is at its long-term trend
rate of 2%. This is probably a best-case scenario. The assumptions underpinning
the benign scenario are fairly demanding—both in terms of policies in the new
member states and in terms of the evolution of the EU as a whole.
Most of the expected growth in eastern Europe originates from relatively low
starting income levels (reflecting considerable scope for catch-up, or the
"advantages of backwardness"); the expectation that satisfactory macro-
economic environments will persist; and a high degree of international trade
integration. There are many reasons why projected long-term growth, even
under the benign scenario, is not higher, including:
• the relatively modest quality of these countries' institutions, even under a
trajectory of continued improvement;
• the still deficient regulatory environment (aside from any future issues
related to the countries' implementation of the EU body of law); and
• unfavourable demographics—very low or negative projected rates of
growth of the working-age population—and an unfavourable relationship
between overall population growth and that of the working-age population.
The outlook for EU reforms, arguably also a key requirement for buoyant
economic growth in the new members over the medium term—now looks
poor, as the EU's heavyweights, chiefly the UK and France, battle over the
future direction of the EU. It seems even less likely now than before that any of
the big euro zone economic laggards will initiate structural reforms to boost
growth, and the prospects for pushing on with the EU's Lisbon Agenda of
reform now look even bleaker.
Since the mid-1990s output in the Baltic countries has expanded at an annual
average rate of about 6%, and in the most recent years the pace has been even
faster. The three "Baltic tigers" have outperformed the new EU member
countries of east-central Europe by a wide margin. However, such rapid growth
is probably unsustainable over the medium and long term, since the impressive
recent performance reflects a combination of a very low starting base, prudent
macroeconomic policies and rapid progress (in terms of catching up with east-
central European economies) with reforms. Strong growth in Russia and other
nearby CIS countries has also been a factor. Moreover, the Baltic states lag
behind the east-central European average in terms of indicators of human
capital and the "knowledge economy".
The recent rapid credit growth and large current-account deficits in the Baltic
states are not sustainable over the medium term, suggesting that some
deceleration of domestic demand growth will follow. The Baltic states are also
EU enlargement andcatch-up growth
Economies in transition: Regional overview 51
Country Forecast September 2006 www.eiu.com © The Economist IntelligenceUnit Limited 2006
set to experience a significant decline in working-age population over the next
10-20 years. Finally, international experience also suggests that it will be difficult
to sustain recent high productivity increases over a long period of time.
Long-term growth and catch-up
GDP per head at PPP,
2005 (EU15=100)
Long-term annual growth in
GDP per head (%)
Catch-up time with EU15
income per head (years)
Czech Republic 62.8 3.3 37
Estonia 54.8 4.0 31
Hungary 56.9 3.6 37
Poland 43.5 3.5 58
Latvia 43.4 4.2 40
Lithuania 45.9 4.2 37
Slovakia 53.4 3.8 36
Slovenia 77.8 2.8 34
Albania 18.3 4.0 88
Bosnia and Hercegovina 20.6 3.5 109
Bulgaria 30.7 3.8 68
Croatia 40.9 3.4 66
Macedonia 23.7 3.7 88
Romania 29.4 3.8 70
Serbia 21.8 4.2 72
EU15 100.0 2.0 –
Source: Economist Intelligence Unit.
The longer-term prospects for the CIS are mixed. Although structural reforms
are being pursued in many CIS countries, implementation is not as advanced or
as widespread as in east-central Europe. The longer-term outlook is marred by
institutional, demographic and infrastructural constraints. For the energy
exporters, the boom in hydrocarbons prices has provided an impetus to growth
and contributed to an increase in investment outlays. However, given the
volatility of energy prices, these economies will struggle to sustain high growth
rates in the longer term until diversification from energy becomes much more
broad-based. The present strong growth rates in the oil exporters are masking
deep-seated structural imbalances that have resulted in a "dual economy",
which could stymie long-term growth. Prosperous natural resource sectors—
where wages are high and output is growing at double-digit rates—co-exist with
weak manufacturing and agricultural sectors, which are crowded out by a
strengthening exchange rate (symptoms of the so-called Dutch disease).
Energy has undoubtedly been the main driver of Russia's growth since the 1998
financial crisis (annual average real GDP growth was 6.7% in 1999-2005). Natural
resource sectors have directly accounted for roughly two-thirds of the growth of
industrial production since 2000, even though fuels production growth fell
sharply in 2005. The oil sector alone accounted for over 40%. The natural
resource sectors contributed directly more than one-third of Russian GDP
growth, and the oil industry alone for close to one-quarter. This refers only to
the direct contribution to GDP growth: taking into account the indirect effects
on personal incomes and domestic demand pushes up further the total
contribution. The empirical link between oil prices and Russia's output has
been very strong for most of the past decade, although GDP growth slowed in
Mixed outlook for the CIS
52 Economies in transition: Regional overview
Country Forecast September 2006 www.eiu.com © The Economist IntelligenceUnit Limited 2006
2005 despite record high oil prices. High price levels have stimulated energy
output, facilitated improved fiscal performance and spurred domestic demand
growth. The removal of any possible balance-of-payments constraints and the
facilitation of sharp reductions in external debt have also boosted growth.
However, high oil prices are not expected to persist over the long term, and the
period of recovery growth for the economy as a whole (Russia's real GDP is still
below its pre-transition level) is drawing to a close. There are questions about
the longer-term sustainability of Russian growth—many of these are associated
with the economy's natural resource dependence. At the same time, the
increased statism in the economy and erosion in security of property rights
over the past two years has in part offset the improvements in the business
environment in the early part of the decade. Other factors also do not augur
well for Russia's longer-term growth prospects, including infrastructure
constraints and eroding health and education endowments. The vastness of
Russia (about 17m sq km) is another disadvantage, since it means extremely
long distances between population, natural resources and business centres.
Russia faces a severe demographic challenge resulting from low birth rates, poor
medical care and a potentially explosive AIDS situation. Its working-age
population is set to shrink dramatically. Finally, the real appreciation of the
rouble in recent years threatens to expose Russia to problems of Dutch disease—
of a loss of competitiveness of the non-energy sector.
Furthermore, even though the skill levels of Russia's workforce may still
compare favourably with those in many emerging markets—mean years of
schooling of the adult population are high, for instance—the quality of
education is falling as a result of insufficient investment and poor salaries for
teachers. Even on relatively favourable assumptions about key policy variables
and progress in deregulation, our best-case long-term forecast for Russia is that
the growth rate of real GDP will fall to about 3% after 2010.
Falling growth in Russia
Economies in transition: Regional overview 53
Country Forecast September 2006 www.eiu.com © The Economist IntelligenceUnit Limited 2006
Business environment rankings
Business environment scores and ranks
2001-05
Total score a
2001-05
Global rank b
2006-10
Total score a
2006-10
Global rank b
Change in
total score
Change in
rank
Grade
2001-05
Grade
2006-10
Azerbaijan 5.87 74 5.27 71 -0.60 3 very poor poor
Bulgaria 5.67 49 6.68 45 1.00 4 moderate good
Croatia 6.92 51 6.47 48 -0.45 3 moderate moderate
Czech Republic 7.62 28 7.52 24 -0.10 4 good good
Estonia 6.77 20 7.84 21 1.06 -1 good good
Hungary 5.11 32 7.34 31 2.23 1 good good
Kazakhstan 6.69 63 5.67 65 -1.02 -2 poor moderate
Latvia 6.60 37 7.15 35 0.55 2 good good
Lithuania 6.64 39 7.15 36 0.51 3 good good
Poland 5.67 38 7.14 37 1.47 1 good good
Romania 5.32 52 6.58 47 1.26 5 moderate good
Russia 4.83 61 6.06 59 1.23 2 poor moderate
Serbia 6.79 68 6.01 60 -0.78 8 very poor moderate
Slovakia 6.71 31 7.50 25 0.79 6 good good
Slovenia 4.51 33 7.28 32 2.77 1 good good
Ukraine 6.48 73 5.43 68 -1.05 5 very poor poor
World average 6.34 – 6.79 – 0.45 – moderate good
Note. Qualitative grades are assigned according to the following scale: very good, score more than 8; good, 6.5-8; moderate, 5.5-6.4; poor,
5-5.4; very poor, less than 5.
a Out of 10. b Out of 82 countries.
The Economist Intelligence Unit has recently extended its business environment
model from 60 to 82 countries, and from ten transition economies to 16. The
new transition countries are Croatia, Estonia, Latvia, Lithuania, Slovenia and
Serbia. Estonia is easily the top-ranked economy in the region. Among
transition countries, Estonia's business environment now resembles most
closely that of developed market economies across most categories.
Recent years have brought considerable improvement in the east European
investment climate. The early reformers among the countries of central Europe
led the way in the early 1990s in adopting far-reaching stabilisation,
liberalisation and privatisation programmes. Reform in the Commonwealth of
Independent States (CIS), as well as in the Balkans, has been much more
uneven and subject to periodic reversals, but even in these subregions
significant progress has now been made. Looking at the transition region as a
whole, its main advantages are a low-cost but qualified labour force; proximity
to developed markets; long-term market potential; and the ample natural
resource endowments that characterise some countries.
East European business environments are expected to continue to improve over
the medium term. This will be the case despite current worries about reform
stagnation and a return to statist policies in Russia. Almost all of the countries
in the region covered by our model are expected to see improved scores and
most have improved global ranks in 2006-10 compared with the 2001-05
historical period.
54 Economies in transition: Regional overview
Country Forecast September 2006 www.eiu.com © The Economist IntelligenceUnit Limited 2006
Annual real GDP growth is expect to average 4-5% in 2006-10 and average
inflation will continue to decline. More liberal policies towards the private
sector, changes in tax regimes, further liberalisation of foreign trade and
exchange regimes, and infrastructure development imply an average business
environment in 2006-10 that will be significantly better than in the past—
although it will still lag considerably behind western Europe and leading
emerging markets.
Business environment scores
I II III IV V VI VII VIII IX X XI
2001-05
North America 7.9 8.5 7.8 9.3 8.7 9.8 7.6 9.4 8.0 9.4 8.6
Western Europe 8.1 8.0 6.1 7.9 8.3 8.5 6.3 8.5 6.8 8.2 7.7
Eastern Europe 5.7 7.1 5.6 5.1 6.5 7.0 5.6 5.5 6.3 5.6 6.0
Asia 6.3 7.6 6.0 6.0 6.7 7.2 6.8 6.1 6.5 5.7 6.5
Latin America 5.3 6.7 4.8 5.3 6.4 6.7 5.4 5.3 6.1 4.8 5.7
Middle East & Africa 4.6 6.9 5.6 4.4 5.7 5.3 5.7 5.0 5.3 4.6 5.3
2006-2010
North America 8.1 8.2 8.2 9.3 8.7 9.6 7.8 9.4 8.2 9.6 8.7
Western Europe 8.3 8.3 6.5 8.3 8.5 8.8 6.7 9.1 6.9 8.6 8.0
Eastern Europe 6.2 7.5 5.9 6.3 7.0 8.1 6.4 6.5 6.6 6.4 6.7
Asia 6.2 7.6 6.4 6.7 7.2 8.0 7.1 7.0 6.7 6.4 6.9
Latin America 5.4 7.3 5.3 5.5 6.4 7.2 5.4 5.8 6.1 5.5 6.0
Middle East & Africa 4.9 7.2 5.9 5.1 6.3 6.2 6.4 5.7 5.4 5.2 5.8
Note. I = Political environment; II = Macroeconomic environment; III = Market opportunities; IV = Policy towards private enterprise and
competition; V Policy towards foreign investment; VI = Foreign trade and exchange controls; VII = Taxes; VIII = Financing; IX = The labour market;
X = Infrastructure; XI = Overall score.
Economies in transition: Regional overview 55
Country Forecast September 2006 www.eiu.com © The Economist IntelligenceUnit Limited 2006
Articles from previous issues
Workers' remittances in eastern Europe, by Stuart Hensel, Senior Economist,
Central and Eastern Europe, Economist Intelligence Unit
Financial sector stability in south-eastern Europe: causes and consequences of rapid
credit growth, by Matthew Shinkman, Senior Economist, Central and Eastern
Europe, Economist Intelligence Unit
Kosovo: a messy denouement, by Laza Kekic, Regional Director for Central and
Eastern Europe, Economist Intelligence Unit
Frozen conflicts in the Commonwealth of Independent States, by Anna Walker,
Senior Editor, Central and Eastern Europe, Economist Intelligence Unit
Is eastern Europe still price-competitive?, by Laza Kekic, Regional Director for
Central and Eastern Europe, Economist Intelligence Unit
Actual vs. potential trade: is the Commonwealth of Independent States
underperforming?, by Leila Butt, Senior Economist, Central and Eastern Europe,
Economist Intelligence Unit
Do low corporate tax rates attract foreign investment? A look at recent evidence for
the EU, by James Owen, Senior Economist, Central and Eastern Europe,
Economist Intelligence Unit
Agriculture in east-central Europe after the EU enlargement, by Hannah Chaplin,
Research Fellow, Trinity College Dublin
Privatisation in eastern Europe: the key to the transition?, by Saul Estrin, Professor
of Economics and Deputy Dean, London Business School
EU enlargement: one year on, by Katinka Barysch, Chief Economist, Centre for
European Reform
Eastern Europe's democratic transition: the stillbirth of politics, by Joan Hoey,
Senior Editor, Central and Eastern Europe, The Economist Intelligence Unit
Tax issues and the new EU member states, by James Owen, Senior Economist,
Central and Eastern Europe, Economist Intelligence Unit
Recent trends in foreign direct investment into eastern Europe, by Laza Kekic,
Regional Director, Central and Eastern Europe, Economist Intelligence Unit
Where is the EU's final frontier?, by Laza Kekic, Regional Director, Central and
Eastern Europe, Economist Intelligence Unit
The impact of EU enlargement on countries to the east, by Stuart Hensel, Senior
Editor, Central and Eastern Europe, Economist Intelligence Unit
December 2004
September 2004
March 2005
June 2005
September 2005
June 2006
December 2005
March 2006
56 Economies in transition: Regional overview
Country Forecast September 2006 www.eiu.com © The Economist IntelligenceUnit Limited 2006
EU enlargement and foreign direct investment flows, by Laza Kekic, Regional
Director, Central and Eastern Europe, Economist Intelligence Unit
The banking sector in the countries of former Yugoslavia, by Matthew Shinkman,
Economist, Central and Eastern Europe, Economist Intelligence Unit
Demographics, economic performance and pension reform in central and eastern
Europe, by Katinka Barysch, Chief Economist, Centre for European Reform
Balkan prospects: time for greater optimism?, by Laza Kekic, Regional Director for
Central and Eastern Europe, Economist Intelligence Unit
Russia: what kind of capitalism?, by Laza Kekic, Regional Director, Central and
Eastern Europe, Economist Intelligence Unit
The impact of September 11th 2001 on Central Asia, by Anna Walker, Editor,
Central and Eastern Europe, Economist Intelligence Unit
Business environments in eastern Europe, by Laza Kekic, Regional Director,
Central and Eastern Europe, Economist Intelligence Unit
Structural reform in an enlarged Europe: east-central Europe and the Lisbon process,
by Katinka Barysch, Chief Economist, Centre for European Reform
EU accession: the impact on long-term growth, by Laza Kekic, Regional Director,
Central and Eastern Europe, Economist Intelligence Unit
The shadow economy in eastern Europe, by Leila Butt, Economist, Central and
Eastern Europe, Economist Intelligence Unit
Will EU money help eastern Europe to catch up? by Katinka Barysch, Chief
Economist, Centre for European Reform, London
The Western Balkans: heading off a looming crisis? by Laza Kekic, Regional
Director, Central and Eastern Europe, Economist Intelligence Unit
Eastern Europe after NATO enlargement, by Jonathan Eyal, Director of Studies,
Royal United Services Institute for Defence Studies, London
The road to the Euro, by Laza Kekic, Regional Director, Central and Eastern
Europe, Economist Intelligence Unit
Administrative reform in transition, by Stuart Hensel, Economist Intelligence Unit
Senior Economist/Editor, Central and Eastern Europe
Poland's fall from grace, by Nicholas Spiro, Consultant to the Economist
Intelligence Unit
Labour market problems in eastern Europe, by Katinka Barysch, Economist
Intelligence Unit Senior Economist, Central and Eastern Europe
The European Union's eastward enlargement—the possibility of failure, by Laza
Kekic, Economist Intelligence Unit Regional Director, Central and Eastern Europe
June 2002
September 2002
December 2002
March 2003
June 2003
September 2003
December 2003
March 2004
June 2004
Economies in transition: Regional overview 57
Country Forecast September 2006 www.eiu.com © The Economist IntelligenceUnit Limited 2006
The outlook for US-Russian relations, by Laza Kekic, Economist Intelligence Unit
Regional Director, Central and Eastern Europe
Small enterprises in eastern Europe: the key to a successful transition?, by Katinka
Barysch, Economist Intelligence Unit Senior Economist, Central and Eastern
Europe
Are the resource-rich Caspian littoral states at risk of catching "Dutch disease"?, by
Leila Butt, Economist Intelligence Unit Deputy editor, Central and Eastern
Europe
Multinational companies in eastern Europe: the key drivers of the transition, by
Paul Lewis, Economist Intelligence Unit Managing Editor, East European
Business Publications
Oil and gas investment prospects in the Commonwealth of Independent States, by
Dafne Ter-Sakarian, Economist Intelligence Unit Editor, Central and Eastern
Europe, and Leila Butt, Economist Intelligence Unit Deputy editor, Central and
Eastern Europe
The effects of EU enlargement on the countries left outside, by Heather Grabbe,
Research Director, Centre for European Reform
The role of institutions in the transition, by Laza Kekic, Economist Intelligence
Unit Regional Director, Central and Eastern Europe
Convergence with the EU: alternative measures to assess the process, by Rupinder
Singh, Economist Intelligence Unit Senior Economist, Central and Eastern
Europe
NATO's dilemma: playing twister in the Balkans, by Laza Kekic, Economist
Intelligence Unit Regional Director, Central and Eastern Europe
EU enlargement: what to expect?, by Laza Kekic, Economist Intelligence Unit
Regional Director, Central and Eastern Europe
US foreign policy towards eastern Europe: continuity or change?, by Dafne
Ter-Sakarian, Economist Intelligence Unit Editor, Central and Eastern Europe
The eastward enlargement of the EU and economic performance in east-central
Europe—static and dynamic effects, by David A Dyker, School of European
Studies, University of Sussex
The competitiveness of the central and east European economies in EU markets, by
Alan Smith, School of Slavonic and East European Studies
Assessing output performance in the second stage of the transition, by Gavin Gray,
Economist Intelligence Unit Senior Economist, Central and Eastern Europe
Trends in foreign direct investment, by Laza Kekic, Economist Intelligence Unit
Regional Director, Central and Eastern Europe
March 2002
June 2001
March 2001
December 2000
September 2000
December 2001
September 2001
June 2000
58 Economies in transition: Regional overview
Country Forecast September 2006 www.eiu.com © The Economist IntelligenceUnit Limited 2006
Data summary
2004 2005 2006 2007 2008 2009 2010
Population (m)
Balkansa 41.4 41.3 41.3 41.2 41.1 41.1 41.0
Balticsb 7.1 7.1 7.0 7.0 7.0 6.9 6.9
East-central Europec 65.9 65.8 65.7 65.7 65.6 65.5 65.4
CISd 214.5 213.8 213.2 212.6 212.0 211.5 210.9
East Europe (excl CIS)e 114.4 114.2 114.1 113.9 113.7 113.5 113.3
East Europe (incl CIS)f 328.9 328.0 327.3 326.5 325.7 325.0 324.2
GDP growth rates (%)
Balkansa 7.3 4.7 5.8 4.9 4.8 4.5 4.1
Balticsb 7.6 8.8 8.8 7.4 6.5 6.1 5.9
East-central Europec 5.0 4.3 5.2 4.6 4.2 4.0 4.0
CISd 8.1 6.3 7.0 6.2 5.6 5.1 4.9
East Europe (excl CIS)e 5.8 4.7 5.6 4.9 4.5 4.3 4.2
East Europe (incl CIS)f 7.1 5.6 6.4 5.7 5.2 4.8 4.6
GDP (US$ bn) at nominal exchange rates
Balkansa 157.4 187.1 215.5 256.6 275.5 293.1 312.0
Balticsb 47.5 54.6 63.6 76.5 81.2 85.6 91.0
East-central Europec 536.1 618.0 674.2 786.6 831.9 866.4 906.1
CISd 705.5 914.7 1,161.1 1,357.6 1,494.8 1,641.1 1,797.2
East Europe (excl CIS)e 741.0 859.7 953.2 1,119.8 1,188.5 1,245.2 1,309.1
East Europe (incl CIS)f 1,446.5 1,774.4 2,114.3 2,477.4 2,683.3 2,886.4 3,106.3
GDP per head (US$) at nominal exchange rates
Balkansa 3,799 4,531 5,220 6,228 6,698 7,139 7,612
Balticsb 6,672 7,708 9,034 10,936 11,667 12,386 13,236
East-central Europec 8,139 9,390 10,253 11,977 12,681 13,224 13,848
CISd 3,289 4,278 5,446 6,386 7,052 7,761 8,523
East Europe (excl CIS)e 6,476 7,528 8,356 9,833 10,454 10,972 11,555
East Europe (incl CIS)f 4,398 5,409 6,461 7,589 8,239 8,882 9,583
GDP (US$ bn) at purchasing power parities
Balkansa 335.9 362.2 394.7 427.1 461.8 498.1 534.8
Balticsb 90.2 101.1 113.2 125.4 138.1 151.2 165.1
East-central Europec 918.3 986.7 1,069.0 1,152.6 1,240.2 1,332.0 1,429.6
CISd 1,892.7 2,073.3 2,287.6 2,510.5 2,742.8 2,971.8 3,214.1
East Europe (excl CIS)e 1,344.4 1,450.0 1,576.9 1,705.1 1,840.1 1,981.3 2,129.6
East Europe (incl CIS)f 3,237.1 3,523.3 3,864.5 4,215.6 4,582.8 4,953.0 5,343.7
GDP per head (US$) at purchasing power parities
Balkansa 8,107 8,770 9,563 10,365 11,227 12,131 13,047
Balticsb 12,673 14,277 16,078 17,914 19,846 21,870 24,025
East-central Europec 13,943 14,992 16,258 17,549 18,906 20,329 21,849
CISd 8,824 9,696 10,730 11,810 12,939 14,053 15,243
East Europe (excl CIS)e 11,751 12,697 13,824 14,972 16,185 17,457 18,796
East Europe (incl CIS)f 9,842 10,741 11,809 12,913 14,072 15,242 16,485
Consumer price inflation (%)
Balkansa 11.6 10.1 9.0 6.8 5.4 4.7 4.1
Balticsb 3.0 4.2 4.4 3.6 3.2 2.8 2.8
East-central Europec 4.3 2.4 2.3 3.0 2.6 2.4 2.3
CISd 10.3 12.5 9.4 9.2 8.0 7.3 6.9
East Europe (excl CIS)e 5.8 4.2 3.8 3.7 3.1 2.8 2.5
East Europe (incl CIS)f 8.4 9.0 7.1 7.0 6.1 5.5 5.2
Economies in transition: Regional overview 59
Country Forecast September 2006 www.eiu.com © The Economist IntelligenceUnit Limited 2006
2004 2005 2006 2007 2008 2009 2010
Merchandise exports (US$ bn)
Balkansa 45.4 53.1 64.3 78.0 87.2 96.6 108.0
Balticsb 19.5 24.9 31.4 37.5 40.1 42.9 46.4
East-central Europec 249.0 286.0 331.6 377.8 415.8 447.7 485.1
CISd 241.2 314.5 403.1 448.9 474.0 486.5 520.9
East Europe (excl CIS)e 313.9 364.0 427.3 493.2 543.0 587.2 639.5
East Europe (incl CIS)f 555.2 678.6 830.4 942.1 1,017.0 1,073.7 1,160.4
Merchandise imports (US$ bn)
Balkansa -71.1 -83.0 -101.1 -121.5 -133.2 -144.3 -159.2
Balticsb -26.7 -32.6 -40.3 -46.9 -49.7 -52.6 -56.1
East-central Europec -261.4 -292.6 -338.4 -387.2 -424.0 -456.7 -496.3
CISd -143.4 -183.8 -241.4 -289.0 -334.5 -374.9 -434.6
East Europe (excl CIS)e -359.2 -408.1 -479.8 -555.6 -606.9 -653.6 -711.6
East Europe (incl CIS)f -502.6 -591.9 -721.3 -844.7 -941.4 -1,028.6 -1,146.2
Trade balance (US$ bn)
Balkansa -25.7 -29.9 -36.8 -43.5 -46.1 -47.7 -51.2
Balticsb -7.2 -7.7 -8.9 -9.5 -9.6 -9.7 -9.6
East-central Europec -12.4 -6.6 -6.8 -9.4 -8.1 -9.1 -11.2
CISd 97.8 130.8 161.7 159.8 139.4 111.6 86.3
East Europe (excl CIS)e -45.3 -44.1 -52.5 -62.4 -63.9 -66.5 -72.1
East Europe (incl CIS)f 52.6 86.6 109.1 97.4 75.6 45.1 14.2
Current-account balance (US$ bn)
Balkansa -12.6 -16.2 -21.7 -24.3 -24.1 -23.3 -23.7
Balticsb -4.9 -5.2 -6.8 -7.3 -7.2 -7.1 -6.7
East-central Europec -27.8 -19.2 -21.4 -25.6 -26.3 -27.1 -29.7
CISd 64.7 85.8 109.6 104.1 82.4 54.2 22.3
East Europe (excl CIS)e -45.4 -40.6 -49.9 -57.1 -57.6 -57.4 -60.2
East Europe (incl CIS)f 19.3 45.2 59.7 47.0 24.8 -3.2 -37.9
Exports (% of GDP)
Balkansa 28.9 28.4 29.8 30.4 31.6 33.0 34.6
Balticsb 41.1 45.6 49.3 49.0 49.3 50.1 51.0
East-central Europec 46.4 46.3 49.2 48.0 50.0 51.7 53.5
CISd 34.2 34.4 34.7 33.1 31.7 29.6 29.0
East Europe (excl CIS)e 42.4 42.3 44.8 44.0 45.7 47.2 48.8
East Europe (incl CIS)f 38.4 38.2 39.3 38.0 37.9 37.2 37.4
Current-account balance (% of GDP)
Balkansa -8.0 -8.6 -10.1 -9.5 -8.8 -7.9 -7.6
Balticsb 0.0 0.0 0.0 0.0 0.0 0.0 0.0
East-central Europec -5.2 -3.1 -3.2 -3.3 -3.2 -3.1 -3.3
CISd 9.2 9.4 9.4 7.7 5.5 3.3 1.2
East Europe (excl CIS)e -6.1 -4.7 -5.2 -5.1 -4.8 -4.6 -4.6
East Europe (incl CIS)f 1.3 2.5 2.8 1.9 0.9 -0.1 -1.2
External debt (US$ bn)
Balkansa 93.1 103.1 115.1 130.0 137.6 146.4 154.7
Balticsb 32.1 37.9 45.5 51.1 54.5 57.9 61.3
East-central Europec 244.8 275.2 303.2 342.7 358.9 367.9 383.3
CISd 253.3 284.2 358.0 407.2 452.9 495.9 545.7
East Europe (excl CIS)e 370.1 416.2 463.8 523.8 551.0 572.2 599.3
East Europe (incl CIS)f 623.3 700.4 821.8 931.0 1,003.9 1,068.1 1,145.0
60 Economies in transition: Regional overview
Country Forecast September 2006 www.eiu.com © The Economist IntelligenceUnit Limited 2006
2004 2005 2006 2007 2008 2009 2010
External debt (% of GDP)
Balkansa 59.2 55.1 53.4 50.6 50.0 49.9 49.6
Balticsb 67.7 69.5 71.5 66.7 67.1 67.6 67.4
East-central Europec 45.7 44.5 45.0 43.6 43.1 42.5 42.3
CISd 35.9 31.1 30.8 30.0 30.3 30.2 30.4
East Europe (excl CIS)e 49.9 48.4 48.7 46.8 46.4 46.0 45.8
East Europe (incl CIS)f 43.1 39.5 38.9 37.6 37.4 37.0 36.9
External debt (% of exports)
Balkansa 204.9 194.1 179.1 166.7 157.9 151.5 143.3
Balticsb 164.8 152.3 144.9 136.3 136.0 135.1 132.0
East-central Europec 98.3 96.2 91.4 90.7 86.3 82.2 79.0
CISd 105.0 90.3 88.8 90.7 95.6 101.9 104.8
East Europe (excl CIS)e 117.9 114.3 108.5 106.2 101.5 97.4 93.7
East Europe (incl CIS)f 112.3 103.2 99.0 98.8 98.7 99.5 98.7
a Comprises Bulgaria, Croatia, Romania and Serbia b Comprises Estonia, Latvia and Lithuania. c Comprises Czech Republic, Hungary, Poland,
Slovakia and Slovenia. d Comprises Azerbaijan, Kazakhstan, Russia and Ukraine. e Comprises Bulgaria, Croatia, Czech Republic, Estonia, Hungary,
Latvia, Lithuania, Poland, Serbia, Romania, Slovakia and Slovenia. f Comprises Azerbaijan, Bulgaria, Croatia, Czech Republic, Estonia, Hungary,
Kazakhstan, Latvia, Lithuania, Poland, Romania, Russia, Serbia, Slovakia, Slovenia and Ukraine.
Economies in transition: Regional overview 61
Country Forecast September 2006 www.eiu.com © The Economist IntelligenceUnit Limited 2006
Guide to the business rankings model
Outline of the model
The business rankings model measures the quality or
attractiveness of the business environment in the 82
countries covered by Country Forecasts using a standard
analytical framework. It is designed to reflect the main
criteria used by companies to formulate their global business
strategies, and is based not only on historical conditions but
also on expectations about conditions prevailing over the
next five years. This allows the Economist Intelligence Unit to
utilise the regularity, depth and detail of its forecasting work
to generate a unique set of forward-looking business
environment rankings on a regional and global basis.
The business rankings model examines ten separate criteria
or categories, covering the political environment, the
macroeconomic environment, market opportunities, policy
towards free enterprise and competition, policy towards
foreign investment, foreign trade and exchange controls,
taxes, financing, the labour market and infrastructure. Each
category contains a number of indicators that are assessed by
the Economist Intelligence Unit for the last five years and the
next five years. The number of indicators in each category
varies from five (foreign trade and exchange regimes) to 16
(infrastructure), and there are 91 indicators in total.
Almost half of the indicators are based on quantitative data
(eg, GDP growth), and are mostly drawn from national and
international statistical sources for the historical period (2001-
05) and from Economist Intelligence Unit forecasts for the
forecast period (2006-10). The other indicators are qualitative
in nature (eg, quality of the financial regulatory system), and
are drawn from a range of data sources and business surveys
adjusted by the Economist Intelligence Unit, for 2001-05. All
forecasts for the qualitative indicators covering 2006-10 are
based on Economist Intelligence Unit assessments.
The main sources used in the business rankings model
include CIA, World Factbook; Economist Intelligence Unit,
Country Risk Service, Country Finance, Country Commerce;
Freedom House, Annual Survey of Political Rights and Civil
Liberties; Heritage Foundation, Index of Economic Freedom;
IMF, Annual Report on Foreign Exchange Restrictions;
International Institute for Management Development,
World Competitiveness Yearbook; International Labour
Organisation, International Labour Statistics Yearbook; UN,
Human Development Report; US Social Security
Administration, Social Security Programs Throughout the
World; World Bank, World Development Report; World
Development Indicators; World Economic Forum, Global
Competitiveness Report.
Calculating the rankings
The rankings are calculated in several stages. First, each of the
91 indicators is scored on a scale from 1 (very bad for business)
to 5 (very good for business). The aggregate category scores are
derived on the basis of simple or weighted averages of the
indicator scores within a given category. These are then
adjusted, on the basis of a linear transformation, to produce
index values on a 1-10 scale. An arithmetic average of the ten
category index values is then calculated to yield the aggregate
business environment score for each country, again on a 1-10
scale.
The use of equal weights for the categories to derive the
overall score reflects in part the theoretical uncertainty about
the relative importance of the primary determinants of
investment. Surveys of foreign direct investors' intentions yield
widely differing results on the relative importance of different
factors. Weighted scores for individual categories based on
correlation coefficients of recent foreign direct investment
inflows do not in any case produce overall results that are
significantly different to those derived from a system based on
equal weights.
For most quantitative indicators the data are arrayed in
ascending or descending order and split into five bands
(quintiles). The countries falling in the first quintile are
assigned scores of 5, those falling in the second quintile score 4
and so on. The cut-off points between bands are based on the
average of the raw indicator values for the top and bottom
countries in adjacent quintiles. The 2001-05 ranges are then
used to derive 2006-10 scores. This allows for intertemporal as
well as cross-country comparisons of the indicator and
category scores.
Measurement and grading issues
The indices and rankings attempt to measure the average
quality of the business environment over the entire historical
or forecast period, not simply at the start or at the end of the
period. Thus in the forecast we assign an average grade to
elements of the business environment over 2006-10, not to the
likely situation in 2010 only.
The scores based on quantitative data are usually calculated
on the basis of the numeric average for an indicator over the
period. In some cases, the “average” is represented, as an
approximation, by the recorded value at the mid-point of the
period (2003 or 2008). In only a few cases is the relevant
variable appropriately measured by the value at the start of
the period (eg, educational attainments). For one indicator (the
natural resources endowment), the score remains constant for
both the historical and forecast periods.
62 Economies in transition: Regional overview
Country Forecast September 2006 www.eiu.com © The Economist IntelligenceUnit Limited 2006
List of indicators in the business rankings model
Political environment
1. Risk of armed conflict
2. Risk of social unrest
3. Constitutional mechanisms for the orderly transfer of
power
4. Threat of politically motivated violence
5. International disputes or tensions
6. Government policy towards business
7. Effectiveness of political system in policy formulation
and execution
8. Quality of the bureaucracy
9. Transparency and fairness of political system
10. Corruption
11. Impact of crime
Macroeconomic environment
*1. Inflation
*2. Budget balance as % of GDP
*3. Government debt as % of GDP
*4. Exchange-rate volatility
*5. Current-account balance as % of GDP
Market opportunities
*1. GDP, US$ bn at PPP
*2. GDP per head, US$ at PPP
*3. Real GDP growth
*4. Share of world merchandise trade
*5. Average annual rate of growth of exports
*6. Average annual rate of growth of imports
*7. The natural resource endowment
*8. Profitability
Policy towards private enterprise and competition
1. Degree to which private property rights are protected
2. Government regulation on setting up new private
businesses
3. Freedom of existing businesses to compete
4. Promotion of competition
5. Protection of intellectual property
6. Price controls
7. Distortions arising from lobbying by special interest
groups
8. Distortions arising from state ownership/control
Policy towards foreign investment
1. Government policy towards foreign capital
2. Openness of national culture to foreign influences
3. Risk of expropriation of foreign assets
4. Availability of investment protection schemes
Foreign trade and exchange controls
1. Capital-account liberalisation
**2. Tariff and non-tariff protection
*3. Openness of trade
4. Restrictions on the current account
Taxes
**1. The corporate tax burden
*2. The top marginal personal income tax
*3. Value-added tax
*4. Employers' social security contributions
5. Degree to which fiscal regime encourages new investment
6. Consistency and fairness of the tax system
Financing
1. Openness of banking sector
2. Stockmarket capitalisation
**3. Distortions in financial markets
4. Quality of the financial regulatory system
5. Access of foreigners to local capital market
6. Access to medium-term finance for investment
The labour market
**1. Incidence of strikes
*2. Labour costs adjusted for productivity
*3. Availability of skilled labour
4. Quality of workforce
5. Restrictiveness of labour laws
6. Extent of wage regulation
7. Hiring of foreign nationals
*8. Cost of living
Infrastructure
*1. Telephone density
**2. Reliability of telecoms network
**3. Extent and quality of road network
*4. Production of electricity per head
**5. The infrastructure for retail and wholesale distribution
**6. Extent and quality of the rail network
7. Quality of ports infrastructure
*8. Stock of personal computers
*9. R&D expenditure as % of GDP
*10. Rents of office space
Note. A single asterisk (*) denotes a purely quantitative indicator.
Indicators with a double asterisk (**) are partly based on data.
All other indicators are qualitative in nature.

Economies in Transition

  • 1.
    Country Forecast Economies intransition Eastern Europe and the former Soviet Union Regional overview September 2006 The Economist Intelligence Unit 26 Red Lion Square London WC1R 4HQ United Kingdom
  • 2.
    The Economist IntelligenceUnit The Economist Intelligence Unit is a specialist publisher serving companies establishing andmanaging operations across national borders. For over 50 years it has been a source of information on business developments, economic and political trends, government regulations and corporate practice worldwide. The Economist Intelligence Unit delivers its information in four ways: through its digital portfolio, where the latest analysis is updated daily; through printed subscription products ranging from newsletters to annual reference works; through research reports; and by organisingseminars and presentations. The firm is a member of The Economist Group. London The Economist Intelligence Unit 26 Red Lion Square London WC1R 4HQ UnitedKingdom Tel: (44.20) 7576 8000 Fax: (44.20) 7576 8500 E-mail: london@eiu.com New York The Economist Intelligence Unit The Economist Building 111 West 57th Street New York NY 10019, US Tel: (1.212) 554 0600 Fax: (1.212) 586 0248 E-mail: newyork@eiu.com Hong Kong The Economist Intelligence Unit 60/F, Central Plaza 18 Harbour Road Wanchai HongKong Tel: (852) 2585 3888 Fax: (852) 2802 7638 E-mail: hongkong@eiu.com Website: www.eiu.com Electronic delivery This publication can be viewed by subscribing online at www.store.eiu.com Reports are alsoavailable in various other electronic formats, such as CD-ROM, Lotus Notes, online databases and as direct feeds to corporate intranets. For further information, please contact your nearest Economist Intelligence Unit office Copyright © 2006 The Economist Intelligence Unit Limited. All rights reserved. Neither this publication nor any part of itmay be reproduced, stored in a retrieval system, or transmitted in any form or byany means, electronic, mechanical, photocopying, recording or otherwise, without the prior permission of The Economist Intelligence Unit Limited. All information in this report is verified to the best of the author's and the publisher's ability. However, the Economist Intelligence Unit does not accept responsibility for any loss arising from reliance on it. ISSN 1356-4005 Symbols for tables “n/a” means not available; “–” means not applicable Printed and distributed by Patersons Dartford, Questor Trade Park, 151 Avery Way, Dartford, Kent DA1 1JS, UK.
  • 3.
    Economies in transition:Regional overview 1 Country Forecast September 2006 www.eiu.com © The Economist IntelligenceUnit Limited 2006 Contents 2 Fact sheet 3 Summary 3 Financial sector development and growth 3 Political outlook 3 Economic forecast 3 Business environment rankings 4 The subregions 5 Financial sector development and economic growth in transition economies 5 Introduction 5 Patterns of growth 6 Sources of growth 9 Financial sectors in transition 12 Empirical results 17 Conclusions 20 Political outlook 24 Further EU enlargement 27 Economic forecast 29 Short-term outlook 35 Inflation 36 External sector 38 Foreign direct investment 43 EMU membership 49 The long-term outlook 53 Business environment rankings 55 Articles from previous issues 58 Data summary 61 Guide to the business rankings model 62 List of indicators in the business rankings model
  • 4.
    2 Economies intransition: Regional overview Country Forecast September 2006 www.eiu.com © The Economist IntelligenceUnit Limited 2006 Fact sheet Annual data 2005 Historical averages (%) 2001-05 Population (m) 405.7a Population growth -0.2a GDP (US$ bn; market exchange rates) 1,868 Real GDP growth 4.9 GDP (US$ bn; PPP) 3,788 Inflation (av) 8.3 GDP per head (US$; market exchange rates) 4,600 Current account balance (US$ bn) 15.6 GDP per head (US$; PPP) 9,760 FDI inflows/GDP 3.6 a Economist Intelligence Unit estimate. Background: Political developments since 1989 have been dominated by the break-up of the former communist federations and the move to multiparty parliamentary democracy. The economic transition of the east-central European countries (Poland, Hungary, Slovenia, the Czech Republic and Slovakia) has generally proceeded more smoothly than elsewhere in the region. The effects of war in former Yugoslavia and a slower pace of reform have determined developments in south- eastern Europe. Political democratisation has proceeded slowly and unevenly in many former Soviet republics. Political structure: Democratic traditions are weak in most countries in the region. The exceptions, nearly all of them in central Europe, now have systems that approach west European practice. The communist period lasted much longer in the former Soviet Union, and political developments in most parts of the region have been characterised by a drift towards authoritarianism. The end of the cold war has led to open or latent disputes over boundaries and the position of ethnic minorities. Policy issues: The speed and extent of reform and of institutional change varies widely across the region. Countries with proximity to Western markets and stable political outlooks have proceeded faster and more successfully with stabilisation, liberalisation and privatisation. In parts of the Commonwealth of Independent States (CIS), the number of reform reversals has increased since 1996. Although the post-1989 collapse in output ended by 2000, the average level of real GDP in the region is still only around 95% of its 1989 level. The difficult tasks of financial sector reform and institution-building represent the second stage of reforms. Institutional weaknesses, such as the weak rule of law and widespread corruption, continue to plague much of the region. Taxation: Most countries have carried out sweeping fiscal reforms, including the introduction of value-added tax (VAT) and the overhaul of corporate and personal income-tax systems. Inadequate tax collection by central governments remains a problem in many CIS and Balkan states. Foreign trade: The collapse of the Council for Mutual Economic Assistance (CMEA, or Comecon) and the break-up of the Soviet Union disrupted trade and output patterns. Some countries have been successful in reorienting their trade to the West. Attempts to promote trade and integration within the CIS have so far been largely unsuccessful. Total merchandise trade in the region in 2005 amounted to an estimated US$1.35trn. Because of the continuing large surplus in Russia, the region's total current-account surplus in 2005 was an estimated US$43bn. Exports (2005) US$ bn Imports (2005) US$ bn East-central Europe 286.0 East-central Europe 292.6 Balkans 58.9 Balkans 97.3 Baltics 24.9 Baltics 32.6 CIS 345.9 CIS 216.6 Eastern Europe excl former Soviet Union 344.9 Eastern Europe excl former Soviet Union 389.9 Eastern Europe incl former Soviet Union 715.7 Eastern Europe incl former Soviet Union 639.1
  • 5.
    Economies in transition:Regional overview 3 Country Forecast September 2006 www.eiu.com © The Economist IntelligenceUnit Limited 2006 Summary Few empirical studies have looked specifically at the contribution of financial sector development to transition economies' growth, although developed financial markets have been generally assumed to be crucial to supporting growth performance. An empirical exercise that relates GDP growth to a range of variables finds some support for the proposition that financial sector development—in particular the role of foreign-owned banks—had a significant positive impact on transition economies' growth during the past decade. The results of elections held in eastern Europe this year do not indicate any clear shifts in regional trends or direction. Bulgaria and Romania are set to join the EU on January 1st 2007 (at most there could have been a one-year delay until January 2008), but this will be under the strictest conditions ever applied to new members. Acrimonious negotiations on the final status of Kosovo appear to be grinding towards an impasse and possible crisis. It is difficult to predict the effects on developments in the wider region—not only in restive and resentful Serbia, but also in Bosnia and Hercegovina (BiH), Macedonia and possibly further afield. This is occurring when the EU's most effective instrument for influencing developments in the region—the offer of EU membership—has been seriously weakened by the anti-enlargement mood sweeping western Europe. The short- and medium-term economic outlook for the transition region appears good, despite the political uncertainty affecting many countries, with growth averaging well above 5% per year in the forecast period of 2006-10. However, there are risks to the baseline outlook, ranging from slow reform in much of the Commonwealth of Independent States (CIS) to threats to the global outlook. Risks are also associated with large external imbalances in some countries and commodity dependence in the CIS. Across the region, rapid credit growth is a sign of financial sector development, but it also raises concerns about financial stability. Inflows of foreign direct investment (FDI) into eastern Europe reached a record total of US$74.9bn in 2005. In 2006 FDI inflows are expected to increase further to about US$79bn, before tailing off gradually in 2007-10 as major privatisation programmes are completed. Despite its ambivalence towards FDI in some sectors, Russia has emerged as the main FDI destination in the region. East European business environments are expected to continue to improve over the medium term. The intra-regional gap between the leading reformers and the later-reforming countries will narrow. Key indicators Eastern Europea and CISb 2005 2006 2007 2008 2009 2010 Real GDP growthc (%) 5.6 6.4 5.7 5.2 4.8 4.6 Consumer price inflation (av; %) 9.0 7.1 7.0 6.1 5.5 5.2 Current-account balance (% of GDP) 2.5 2.8 1.9 0.9 -0.1 -1.2 a The Balkan states of Bulgaria, Croatia, Romania and Serbia and the eight new EU members in east-central Europe and the Baltic states. b Russia, Kazakhstan, Ukraine and Azerbaijan. c Weighted averages for the 16 countries. Editors: Laza Kekic (editor); Stuart Hensel (consulting editor) Editorial closing date: September 15th 2006 All queries: Tel: (44.20) 7576 8000 E-mail: london@eiu.com Next report: Full schedule on www.eiu.com/schedule Business environment rankings Economic forecast Political outlook Financial sector development and growth
  • 6.
    4 Economies intransition: Regional overview Country Forecast September 2006 www.eiu.com © The Economist IntelligenceUnit Limited 2006 The subregions The region comprises 28 countries as a result of the break-up of the Soviet, Yugoslav and Czechoslovak federations. Montenegro became the region's latest and smallest independent state following an independence referendum on May 21st 2006. Based on geographical and associated political criteria, four main subregions can be identified. East-central Europe: Czech Republicab, Hungaryab, Polandab, Slovakiaab, Sloveniaab; Balkans: Albania, Bosnia and Hercegovina, Bulgariaa, Croatiac, Macedonia, Montenegro, Romaniaa, Serbiaa; Baltics: Estoniaab, Latviaab, Lithuaniaab; Commonwealth of Independent States (CIS): Russiaa, Ukrainea, Belarus, Moldova, Armenia, Azerbaijana, Georgia, Kazakhstana, Kyrgyz Republic, Tajikistan, Turkmenistan, Uzbekistan The articles and the Fact sheet refer to trends throughout the region. The medium-term economic forecast summary relates only to east-central Europe, the Baltic states, four Balkan countries (Bulgaria, Croatia, Romania and Serbia), and four CIS countries (Azerbaijan, Russia, Kazakhstan and Ukraine) a Covered by individual Country Forecasts. b EU member state. Basic data, 2005 Population (m) GDP per heada GDP per headb Real GDP indexc Growth (av; %)d Inflation (av; %)d Exportse Importse Current accounte East-central Europe 65.8 14,990 9,390 144.7 3.5 4.3 286.0 292.6 -19.2 Czech Republic 10.2 18,690 12,150 168.1 3.6 2.2 78.3 76.5 -2.5 Hungary 10.0 16,930 10,920 128.8 4.2 5.9 61.8 63.8 -8.0 Poland 38.2 12,940 7,940 148.6 3.0 2.7 95.8 98.5 -4.3 Slovakia 5.4 15,900 8,720 123.2 4.6 5.8 32.0 34.5 -4.1 Slovenia 2.0 23,160 17,200 135.3 3.4 5.5 18.0 19.3 -0.4 Balkans 53.0 7,960 4,020 90.0 5.2 8.5 58.9 97.3 -19.1 Albania 3.1 5,440 2,620 136.1 5.6 3.1 0.7 2.5 -0.6 Bosnia and Hercegovina 3.9 6,130 2,560 76.9 5.0 1.8 2.6 7.5 -2.1 Bulgaria 7.7 9,150 3,480 97.2 4.9 5.3 11.7 17.1 -3.1 Croatia 4.6 12,190 8,620 97.9 4.7 2.7 9.0 18.3 -2.5 Macedonia 2.0 7,070 2,760 87.9 1.4 1.9 2.0 3.1 -0.1 Montenegro 0.6 6,710 3,290 67.1 0.0 10.8 0.5 1.2 -0.2 Romania 21.6 8,740 4,490 104.9 5.7 18.3 27.7 37.3 -8.4 Serbia 9.5 6,490f 3,230f 51.1f 5.5f 27.0f 4.6f 10.2f -2.1f Baltics 7.1 14,280 7,710 106.9 7.8 2.7 24.9 32.6 -5.2 Estonia 1.3 16,310 9,740 126.1 7.6 3.5 7.8 9.6 -1.4 Latvia 2.3 12,920 6,860 106.9 8.1 4.0 5.3 8.3 -2.0 Lithuania 3.4 14,390 7,480 100.1 7.6 0.9 11.8 14.7 -1.8 CIS 279.8 8,230 3,510 84.0 6.8 11.0 345.9 216.6 86.3 Russia 143.4 11,010 5,320 84.0 6.1 14.8 243.6 125.3 83.6 Ukraine 46.7 6,930 1,770 58.0 7.7 8.0 35.0 36.2 2.5 Belarus 9.8 7,910 3,030 112.5 7.5 30.9 16.1 16.6 0.5 Moldova 4.0 2,540g 860g 45.5g 6.9g 10.1g 1.1g 2.3g -0.3g Armenia 3.0 4,830 1,620 97.6 12.2 2.4 1.0 1.6 -0.2 Azerbaijan 8.4 5,210 1,490 77.5 13.5 4.5 7.6 4.3 0.2 Georgia 4.5 3,650 1,430 43.3 7.3 5.8 1.5 2.7 -0.8 Kazakhstan 15.2 8,300 3,660 103.8 10.3 7.1 28.3 18.0 -0.5 Kyrgyz Republic 5.1 2,000 480 85.2 3.7 4.1 0.7 1.1 -0.2 Tajikistan 6.8 1,270 330 54.7 9.4 15.7 1.1 1.4 0.0 Turkmenistan 6.5 6,290 980 129.1 12.0 8.5 4.9 3.6 0.3 Uzbekistan 26.3 1,990 480 109.8 4.6 14.2 4.9 3.5 1.3 Transition economies total 405.7 9,760 4,600 95.6 4.9 8.3 715.7 639.1 42.8 a US$ at purchasing power parity. b US$ at market exchange rates. c 1989=100. d 2000-04. e US$ bn. f Data exclude Kosovo. g Data exclude the Transdniestr region.
  • 7.
    Economies in transition:Regional overview 5 Country Forecast September 2006 www.eiu.com © The Economist IntelligenceUnit Limited 2006 Financial sector development and economic growth in transition economies By Helios Padilla Mayer, Consultant to the European Investment Bank This article investigates the role of financial sector development in explaining economic growth during the transition. In recent years a large literature has been built up that investigates the sources and patterns of growth during the transition. Studies initially focused on the causes of the sharp decline in output in the initial years of the transition, and later on the main driving forces of recovery. Empirical investigations have assessed the impact on growth of initial conditions at the start of transition, macroeconomic policies, privatisation and other reforms, external conditions and other factors. Few studies have looked specifically at the contribution of financial sector development to growth. A growth accounting exercise to decompose the proximate sources of growth in transition economies in 1990-94, 1995-99 and 2000-03 finds that growth in physical capital and total factor productivity explain almost all of the growth since the nadir of the transition recession in the mid-1990s. It is hypothesised that effective and developed financial markets are crucial to supporting the growth performance of transition economies, and that financial sector development has played a significant role in facilitating increased investment and physical capital growth, and the efficiency improvements captured by the total factor productivity variable. In the final part of the article, a cross-country empirical exercise that relates GDP growth to a range of variables, including indicators of financial sector develop- ment, examines the proposition of whether financial sector development has had a significant positive impact on transition economies' growth. We can distinguish between three phases of growth in the transition: 1990-94, 1995-99 and the period from 2000 (in the empirical analysis, data availability dictates that we focus only on 2000-03 for this subperiod). During the first phase of transition (1990-94) most economies experienced very steep declines in GDP. In 1994 real output in the transition region as a whole was more than one-third lower than its 1989 level. The rate of contraction varied from 12% in east-central Europe (the Polish transition recession was the most short-lived, only up to 1992) to 40% in the Commonwealth of Independent States (CIS). Real GDP began to recover, in some cases strongly, in the second phase (1995-99)—especially in the leading reformers of east-central Europe and the Baltic states, despite the impact of the 1998 Russian financial crisis. In 1996 east- central Europe recovered its 1989 level of output, although other subregions remained well below their 1989 level. Since 2000 recovery growth has spread to the entire region, including the previously weakly performing Balkan and CIS economies. GDP growth has been supported by buoyant private-sector activity and rapid growth in exports. High rates of GDP growth since 2000 have occurred in many countries, despite the Patterns of growth Introduction
  • 8.
    6 Economies intransition: Regional overview Country Forecast September 2006 www.eiu.com © The Economist IntelligenceUnit Limited 2006 global economic slowdown in the early part of the decade. The strong oil-led recovery in Russia has also had an important positive impact on many other CIS states. By 2005 average output in the region was, however, still 4% below its 1989 level; Balkan real GDP was 10% below its 1989 level, and CIS output 16% below. 40 60 80 100 120 140 160 1989 90 91 92 93 94 95 96 97 98 99 2000 01 02 03 04 05 East-central Europe Balkans Baltics CIS Real GDP trends (1989=100) Source: Economist Intelligence Unit. We employ a standard growth accounting approach, based on the neoclassical production function, to identify the main sources of growth during the various transition subperiods. The level of output, Y, depends on the level of inputs— physical capital, K, human capital, H, and labour, L—and the level of technology, A. The growth of output can be decomposed into the weighted growth of factor inputs and a residual that reflects technological progress or total factor productivity growth. Thus GY = a*GK + b*GH + c*GL + GA, where GY is growth of real GDP, GK growth of the capital stock, GH growth in human capital and GL growth of labour input. GA stands for the growth in total factor productivity. Under certain assumptions, the shares of physical capital, labour and human capital in income can be used to represent the weights a, b and c. The variables for 1990-2003 for 26 transition economies (all except Bosnia and Hercegovina—BiH—for which data were unavailable) were measured in the following way. Output is represented by real GDP expressed in constant 1995 national prices. Since there are few official estimates of the physical capital stock we use real investment growth rates as a proxy for growth rates of the physical capital stock. Whole-economy employment levels are used to measure labour input.1 An index based on the educational attainment of the workforce is used to measure human capital. The index is constructed by expressing the educational attainment (primary, secondary and tertiary levels of education) of the labour force in each country as deviations from the sample mean. 1 Caution is called for when using employment data as a measure of labour input. The more accurate measure would be hours worked, not a head-count. This is important since both the business cycle and trend factors involve variations in average working hours. Without a measure ofhours worked, the variation will be captured in the estimates oftotal factor productivity growth. However, since data on hours worked are not available for all countries, there is no alternative to usingnumbers ofemployed to measure labour input. Sources of growth Measurement
  • 9.
    Economies in transition:Regional overview 7 Country Forecast September 2006 www.eiu.com © The Economist IntelligenceUnit Limited 2006 Table 1 Factor income shares, 1990-2003 Physical capital Labour Human capital 1990-94 1995-99 2000-03 1990-94 1995-99 2000-03 1990-94 1995-99 2000-03 East-central Europe 0.30 0.35 0.39 0.43 0.26 0.27 0.27 0.39 0.34 Balkans 0.26 0.27 0.32 0.41 0.11 0.42 0.33 0.62 0.26 Baltics 0.41 0.41 0.41 0.43 0.43 0.43 0.16 0.16 0.16 CIS 0.24 0.27 0.31 0.46 0.10 0.19 0.30 0.63 0.50 Source: Author's calculations. In the absence of reliable or readily available data on factor income shares, many growth accounting exercises simply assume values for the factor income shares/ weights (a, b and c) and also assume that these are the same across countries. One way of estimating factor shares is to use the underlying production function, and regress output on the factor inputs. We rely on this method only in part. Dobrinsky (2001) presented data on capital income shares for the transition economies. This was calculated on the basis of the share of the gross operating surplus in gross output. We use Dobrinsky's approach to estimate the capital income share for 1990-2003. This is combined with using panel regressions that relate factor inputs to output in order to obtain estimates of income shares for labour and human capital. The results of our growth accounting exercise are presented in Table 2. In all transition economies the contribution of human capital to economic growth in all subperiods appears to have been negligible. Human capital growth rates have been generally low during the transition. They have varied from an annual average rate of 5% in the CIS countries, 3% in the east-central European countries, and near to zero in the Baltic and Balkan countries. However, these results may not be surprising, given the erosion of human capital endowments from the initially relatively high levels inherited from the communist era (at least in terms of educational attainment). In addition, many transition countries have had a significant increase in tertiary education enrolment only in recent years, and many of these additional students have not yet entered the labour force. Therefore, it is expected that human capital will begin to have a more significant impact on economic growth in the future. The contribution of employment growth to economic growth has also been low, and was negative in all country groups in 1990-94, and after that did not even approach 1 percentage point. Under the communist regime, both participation and employment rates were high. The initial output shock at the onset of transi- tion was accompanied by a drastic adjustment and reflected in sharp declines in participation and employment rates. State-owned enterprises in all transition economies experienced large falls in employment and/or real wages in the early 1990s. In east-central Europe, the initial fall in industrial employment ranged between 10% (in the Czech Republic and Poland) to over 20% (in Hungary). In the early transition period investment was falling and physical capital contri- buted negatively to economic growth. In 1995-99 physical capital made a strong contribution to recovery in the leading reformers of east-central Europe and the Baltics. From 2000 investment started to make a positive contribution to growth in other subregions, which became more attractive for investment after the end Contribution of human capital was negligible
  • 10.
    8 Economies intransition: Regional overview Country Forecast September 2006 www.eiu.com © The Economist IntelligenceUnit Limited 2006 of the Balkan wars and owing to growing interest in oil and natural resources in some CIS economies. Therefore, the growth in physical capital started to make a significant contribution to economic growth in these subregions as well. The contribution of total factor productivity to GDP growth is calculated as the difference between real GDP growth and the weighted growth of factor inputs. The contribution of total factor productivity to economic growth was negative in 1990-94. It tended to increase throughout the period and became positive and highly significant in all subregions, except the Balkans, in 2000-03. In east- central Europe almost the entire annual average real GDP growth rate of 3% in 2000-03 can be explained by growth in total factor productivity. This probably reflects the fact that this subregion was the most advanced in reform and thus the region in which growth was most likely to be driven by improvements in the efficiency of use of factor inputs. Table 2 Sources of growth, 1990-2003 (percentage points of growth) Real GDP growth Physical capital Labour force 1990-94 1995-99 2000-03 1990-94 1995-99 2000-03 1990-94 1995-99 2000-03 East-central Europe -2.32 3.67 2.98 -0.30 3.11 0.14 -1.34 0.05 -0.19 Czech Republic -2.62 0.85 2.41 -0.47 -0.31 2.04 -1.10 -0.49 0.03 Hungary -3.31 3.72 3.47 -0.03 4.66 -1.50 -3.09 0.23 0.02 Poland 1.03 5.42 2.05 -1.17 5.24 -2.40 -0.84 0.32 -0.31 Slovenia -4.99 4.10 4.13 -0.81 2.00 0.83 -0.95 0.13 -1.06 Slovakia -1.72 4.27 2.84 0.97 3.97 1.71 -0.72 0.07 0.35 Balkans -5.65 0.92 3.99 -0.21 0.69 3.44 -2.15 0.18 0.40 Baltics -11.93 4.74 6.97 -7.44 5.60 6.09 -0.96 -0.29 -0.89 Estonia -9.48 4.97 6.26 -6.69 2.27 4.99 -1.68 -0.81 -0.33 Latvia -12.88 5.00 7.30 -14.42 8.40 7.51 -1.12 -0.81 -0.07 Lithuania -13.44 4.25 7.36 -1.20 6.14 5.77 -0.08 0.76 -2.25 CIS -14.16 2.13 8.63 -4.89 0.46 4.68 -1.21 -0.24 0.13 Russia -10.28 -0.38 5.70 -6.18 -5.22 2.78 -1.31 -0.04 0.08 Ukraine -14.01 -3.87 7.92 -6.41 -1.38 3.35 -1.36 -0.21 -0.03 Human capital TFP 1990-94 1995-99 2000-03 1990-94 1995-99 2000-03 East-central Europe 0.02 0.41 0.21 -0.70 0.10 2.83 Czech Republic 0.28 0.15 0.18 -1.32 1.51 0.17 Hungary -0.03 0.70 0.80 -0.16 -1.88 4.14 Poland -0.03 0.70 0.80 3.07 -0.85 3.97 Slovenia -0.15 -0.07 -0.71 -3.07 2.04 5.07 Slovakia 0.03 0.56 -0.01 -2.00 -0.33 0.79 Balkans -0.07 0.53 -0.18 -3.11 -0.20 0.33 Baltics 0.00 0.03 0.01 -3.54 -0.60 1.76 Estonia 0.07 -0.04 -0.09 -1.18 3.55 1.69 Latvia -0.05 0.10 0.15 2.71 -2.68 -0.29 Lithuania -0.01 0.03 -0.04 -12.15 -2.67 3.88 CIS 0.15 0.24 0.06 -8.47 1.52 3.86 Russia 0.09 -0.62 -0.13 -2.88 5.51 2.97 Ukraine 0.09 0.71 -0.06 -6.32 -2.99 4.66 Source: Author's calculations. Although a useful starting-point for at least identifying the proximate sources of growth, the growth accounting framework cannot provide an explanation of Total factor productivity increases begin to drive growth
  • 11.
    Economies in transition:Regional overview 9 Country Forecast September 2006 www.eiu.com © The Economist IntelligenceUnit Limited 2006 the underlying causes or drivers of growth (what explains factor accumulation and total factor productivity growth). This is the case even if we abstract from some of the measurement and methodological difficulties of growth accounting exercises, which are especially acute in the context of the transition. We hypothesise that financial sector development is likely to have played a significant role in facilitating increased investment and physical capital growth, and the efficiency improvements captured by the total factor productivity variable. Before turning to our empirical exercise to test the hypothesis, we briefly review in the next section the main aspects of financial sector development of the transition economies. The relationship between financial sector development and economic growth has been the subject of much debate. A body of empirical work supports the proposition that financial development contributes significantly to growth, especially long-term growth—for example King and Levine (1993) and Levine (1998). There is also some evidence to suggest that the link is stronger for emerging markets—that is, less financially developed countries such as the economies in transition. The channels of impact of financial sector development on growth are varied and range from the mobilisation of savings for investment to helping direct capital to its most profitable uses and thereby boosting efficiency of the use of resources. The creation of financial sectors compatible with a market economy was one of the most difficult challenges for most transition economies—many of which started practically from scratch in this respect. After the fall of the communist regimes, transition economies needed capital to restructure the real economy. In particular, state-owned enterprises had to modernise in order to compete in international markets. Transition economies also needed the creation of new enterprises that could provide basic consumer goods and services, but entrepreneurs lacked access to start-up capital. Most transition economies followed the same broad paradigm for the transformation of their banking sector from the communist mono-bank system. The standard model of financial reform involved the establishment of a two- tier banking system, the abolition of restrictions on the internal convertibility of money, liberalisation of interest rates, restructuring and privatisation of state banks and their enterprise borrowers, and the entry of new private banks. At the same time, the state had to take on the important new roles of providing effective prudential regulation and supervision of banks. There has been remarkable process in financial sector reform, although this pro- gress has been uneven across regions, countries and market segments (Buiter and Taci, 2003). There have been significant achievements in the privatisation and restructuring of state banks in most transition economies; there has been exit by failing institutions and entry and development of new domestic and foreign banks; and the legal, supervisory and regulatory framework has improved, supporting enhanced competition in the provision of banking services. The pace and sequencing of reforms differed significantly across the transition economies. In east-central Europe and the Baltic states, the state liberalised early Financial sectors in transition Remarkable progress in financial reforms
  • 12.
    10 Economies intransition: Regional overview Country Forecast September 2006 www.eiu.com © The Economist IntelligenceUnit Limited 2006 the market for banking services and developed its capacity for effective prudential supervision and regulation in step with the growing role of private banks in the system. Elsewhere, the banking sector remained a source of directed subsidised lending to politically well-connected, financially troubled enterprises. Transition economies chose very different strategies for the method and speed of privatisation of state-owned enterprises, including banks. Until 1993 or 1994 state banks still dominated the banking sector even in the advanced reforming countries. In this period state-owned banks controlled more than 70% of banking in Hungary, Poland and Slovakia, with the share of state banks lower only in the Czech Republic and Estonia. Table 3 The financial sector and transition Asset share of state- owned banks (%) Asset share of foreign- owned banks (%) EBRD index of banking reform EBRD index of non-bank financial sector reform 1999 2004 1999 2004 1999 2005 1999 2005 East-central Europe 33.4 8.6 35.6 71.3 3.3 3.7 2.9 3.4 Czech Republic 41.2 2.9 38.4 84.9 3.3 4.0 3.0 3.7 Hungary 7.8 6.6 61.5 83.5 4.0 4.0 3.3 4.0 Poland 24.9 19.4 49.3 71.4 3.3 3.7 3.3 3.7 Slovakia 50.7 1.3 24.1 96.7 2.7 3.7 2.3 2.7 Slovenia 42.2 12.6 4.9 20.1 3.3 3.3 2.7 2.7 Balkans 55.6 13.5 23.0 63.5 2.3 3.1 1.7 2.1 Albania 81.1 51.9 18.9 47.1 2.0 2.7 1.7 1.7 Bosnia and Hercegovina 75.9 4.0 3.8 80.9 2.3 2.7 1.0 1.7 Bulgaria 50.5 2.3 42.8 81.6 2.7 3.7 2.0 2.3 Croatia 39.8 3.3 40.3 91.2 3.0 4.0 2.3 2.7 Macedonia 2.5 1.9 11.5 47.3 2.7 2.7 1.7 2.0 Romania 50.3 7.5 43.6 58.5 2.7 3.0 2.0 2.0 Serbia and Montenegro 89.0 23.4 0.4 37.7 1.0 2.7 1.0 2.0 Baltics 17.5 1.3 67.0 79.1 3.2 3.8 2.7 3.1 Estonia 7.9 0.0 89.8 98.0 3.7 4.0 3.0 3.3 Latvia 2.6 4.0 74.0 48.6 3.0 3.7 2.3 3.0 Lithuania 41.9 0.0 37.1 90.8 3.0 3.7 2.7 3.0 CIS 35.3 30.5 18.6 23.5 1.8 2.3 1.7 1.9 Russia n/a n/a 10.6 7.4 1.7 2.3 1.7 2.7 Ukraine 12.5 8.0 10.5 12.1 2.0 2.7 2.0 2.3 Belarus 66.6 70.2 2.9 20.0 1.0 1.7 2.0 2.0 Moldova 7.9 17.6 34.4 33.6 2.3 2.7 2.0 2.0 Armenia 3.5 0.0 44.3 56.7 2.3 2.7 2.0 2.0 Azerbaijan 82.5 56.1 4.4 5.8 2.0 2.3 1.7 1.7 Georgia 0.0 0.0 16.1 58.1 2.3 2.7 1.0 1.7 Kazakhstan 19.9 3.7 n/a 5.5 2.3 3.0 2.0 2.3 Kyrgyz Republic 25.8 4.1 16.5 70.1 2.0 2.3 2.0 2.0 Tajikistan 6.9 12.2 60.9 6.2 1.0 2.0 1.0 1.0 Turkmenistan 96.9 96.1 1.6 1.6 1.0 1.0 1.0 1.0 Uzbekistan 65.8 67.6 2.0 4.4 1.7 1.7 2.0 2.0 Transition economies 38.3 18.3 28.6 48.9 2.4 2.9 2.0 2.3 Memorandum item New EU members 27.4 5.9 47.4 74.3 3.3 3.8 2.8 3.3 Note. The values of the EBRD indices range from 1 (no reform) to 4.3 (developed-country standards). Source: EBRD, Transition Report, 2005. Different privatisation strategies
  • 13.
    Economies in transition:Regional overview 11 Country Forecast September 2006 www.eiu.com © The Economist IntelligenceUnit Limited 2006 Privatisation of the banking sector in the transition countries gained speed in the mid-1990s. Over a period of a few years a drastic shift in ownership took place. Whereas Hungary early on went for a quick sale of its banks to foreign direct investors, Poland combined public offerings with management buyouts and some placements with foreign strategic investors. The mass voucher privatisation strategy of the Czech Republic and the resulting complex cross- ownership structure of banks and enterprises led to persistent bank bailouts by the government. The state retained a significant ownership in banks, and only later opted for their sale to foreign strategic investors. By 1999 on average only about one-third of banking assets remained in state hands in east-central Europe and the CIS, and less than 20% in the Baltic states. Large-scale privatisation was delayed in the Balkan countries. However, Bulgaria, Croatia and Romania have made significant progress in privatisation in recent years and the main remaining state-owned banks are in the process of being privatised. Serbia and Macedonia have also made major progress with bank sales to strategic investors. In some CIS countries, the government still exerts a high degree of control over the banking sector (the exceptions are Russia, Armenia, Kazakhstan and Tajikistan). Furthermore, the method of privatisation has limited the gains from the ownership transformation. The mass voucher privatisation in some CIS countries and the rapid creation of a large number of small banks established by non-financial enterprises created the twin problems of connected lending and excessive sectoral concentration of bank loans. Ongoing banking sector privatisation throughout most of the transition region meant that by 2004 less than 20% of the region's banking assets were still in state hands. In the new EU member states only about 6% of assets were still under state ownership. In all, the extent of the transformation of ownership structures in the banking sector in such a short space of time has been extraordinary. In countries with underdeveloped financial systems such as the transition economies, the role of foreign banks is likely to be particularly important. There has been extensive penetration by foreign banks, which are modernising the sector, improving efficiency and deepening financial intermediation. Political as well as economic considerations explain the different country experiences across the region regarding the scope and efficiency-enhancing implications of foreign entry in the banking sector. By the beginning of this decade foreigners had gained control of most of the assets of the banking sector in east-central Europe (except for Slovenia) and the Baltic states. Hungary was the first country to open its banking sector to foreign participation, but others soon followed. The Czech Republic resisted foreign ownership of its larger banks until the failure of several of those banks between 1996 and 1998 prompted the sale of all large banks to foreign strategic investors. Foreign entry in the Balkan countries was initially slow, but has picked up markedly in recent years (see Shinkman, 2004). In the CIS, the entry of foreign banks has been restricted, with liberalisation a recent phenomenon. Overall, however, foreign penetration of banking sectors gathered pace in most countries after 2000, and by 2004 about 80% of bank assets in the Baltic states, The role of foreign banks
  • 14.
    12 Economies intransition: Regional overview Country Forecast September 2006 www.eiu.com © The Economist IntelligenceUnit Limited 2006 70% in east-central Europe and 64% in the Balkans were in foreign hands. The share has continued to increase since then. Only in the CIS is the average share of foreign-owned bank assets still relatively low. Despite the far-reaching change and financial sector reform over the past decade, the banking sector still lags behind best practice as regards the scale and scope of the provision of financial services. This is true even of most advanced reformers in the region. The level of bank intermediation between domestic savers and potential investors in the domestic real economy remains low. The degree of development of non-banking financial institutions is less than that of the banking system, as evidenced by the European Bank for Reconstruction and Development (EBRD) indicators in Table 3. Despite considerable financial sector reform, most transition economies thus display a lower degree of financial deepening than market economies at similar levels of economic development. Consumer credit has led the way in bank activity, and, despite continuing problems of access to loans, enterprises in the region are also benefiting from improved borrowing conditions and new products. The banks of the region are likely to play an increasingly active role in the coming years. The ultimate goal of strengthening and deepening the banking sectors of the region is, of course, to spur faster economic growth. There is an extensive empirical literature on growth in the transition—for example, Fisher et al. (1997); Berg et al. (1999); Havrylyshyn et al. (1999 and 2000); Campos and Coricelli (2002); Falcetti et al. (2005). Most of these studies use cross-section regressions, looking at average growth across the transition countries in a given period. Some studies have used panel regressions, in which cross-section and time-series observations are combined. Most empirical studies have confirmed that standard growth model assumptions perform poorly in explaining growth patterns during the unique and turbulent period of the transition. Instead ad hoc approaches have attempted to assess the impact on growth of initial conditions at the start of transition, macroeconomic policies, privatisation and other reforms, external conditions and other factors. Few studies have looked specifically at the contribution of financial sector development to growth. A rare exception is a study by Andriesz, Asteriou and Pilbeam (2003), which examined Polish experience from 1990 to 2002 and showed that financial liberalisation had a positive impact on economic growth. They measured financial liberalisation with the EBRD indices of banking reform, reform of non-banking financial institutions, as well as other indicators of the development of banking sector (the number of banks, the share of privately owned banks, and loan-deposit rate spreads). In our empirical investigation of the impact of financial sector development on transition economies' growth we also need to take account of other factors, or control variables, that are likely to have influenced growth over the whole period or in certain subperiods. Control variables Empirical results
  • 15.
    Economies in transition:Regional overview 13 Country Forecast September 2006 www.eiu.com © The Economist IntelligenceUnit Limited 2006 Among the main ones considered are: • Y, output per worker at the start of a period, to capture the convergence hypothesis (that poor countries will grow more quickly than rich ones, other things being equal); • ID, a measure of initial conditions in 1990; and • REF, a measure of overall market reforms in the first phase of transition, 1990-94. Despite a common legacy of planning, transition economies started out under different circumstances. There were significant differences in terms of initial level of development, macroeconomic distortions, integration into the trading system of the communist countries, and the extent of prior reforms. Prior studies have shown that this had a strong impact on performance, especially in the initial years of the transition. Our composite measure of initial conditions is similar to the ones constructed by de Melo et al. (1997), EBRD (1997) and Falcetti et al. (2005). It is based on six indicators of market distortions in 1990 taken from de Melo et al.:2 • the share in GDP in 1990 of trade with countries in the Council for Mutual Economic Assistance (CMEA, or Comecon) trading bloc; • an estimate of "repressed inflation" in 1987-90; • the black-market exchange-rate premium; • a measure of the degree of "over-industrialisation"; • the number of years spent under communism; and • a dummy variable taking the value of 1 if the transition country had a capitalist economy for a neighbour prior to 1990, and 0 otherwise. The extent of economic reform in 1990-94 (REF) is measured on the basis of the EBRD's ratings for progress in various types of reforms. The various dimensions of reform are rated for each year and each transition country on a scale of 1 to 4.3 (the standard achieved in developed countries). The indicators can be divided into three subsets: enterprise reforms; liberalisation; and financial institutions. Enterprise reform covers small- and large-scale privatisation and enterprise restructuring. Liberalisation covers price liberalisation, trade and foreign-exchange system liberalisation and competition policy. Financial sector reform is measured by progress in banking reform and interest rate liberalisation, and the development of securities markets and non-financial institutions (as reported for 1999 and 2005 in Table 3). To avoid a clear overlap with our measures of financial sector development, we omit the EBRD's financial sector reform subset and calculate REF as the simple average of the values of the six indicators in the enterprise reform and liberalisation subsets. 2 Other studies have used up to a dozen indicators to construct a composite index of initial conditions.
  • 16.
    14 Economies intransition: Regional overview Country Forecast September 2006 www.eiu.com © The Economist IntelligenceUnit Limited 2006 Financial sector development is measured by three indicators: LLY is the ratio of liquid liabilities to GDP, where liquid liabilities consist of currency held outside the banking system plus demand-bearing liabilities of banks and non-bank financial intermediaries. This indicator measures the extent of financial intermediation. BANK represents the role of commercial banks in the overall financial sector. It is the ratio of commercial bank domestic assets to the sum of commercial bank and central bank domestic assets. FOREIGN is the share of foreign banks' assets in total bank assets. Data were also gathered on a fourth indicator, PRIV, the ratio of claims on the non-financial private sector to GDP. However, this indicator tended to be insignificant or even to appear with the wrong sign in almost all the empirical tests, probably because of a high degree of collinearity between this indicator and other financial sector indicators. Other control variables used in the empirical estimates include our estimates of the growth of human and physical capital and employment growth in the given subperiods. As with PRIV, the results were generally insignificant and are not reproduced here. The data in Table 4 show that in all periods the ratio of liquid liabilities to GDP increased, but has generally still remained low, especially in the CIS countries. Liquidity ratios have been clearly affected by different inflation rates in transition economies. In many CIS economies throughout much of the period liquidity ratios remained low as a result of an extensive reliance on the use of non-monetary surrogates and barter arrangements. Table 4 Liquidity (LLY) ratios, 1990-2003 (%) 1990-94 1995-99 2000-03 East-central Europe 37.6 44.8 51.7 Czech Republic 58.5 63.4 68.8 Hungary 39.6 39.4 41.2 Poland 21.5 29.0 39.6 Slovakia 53.2 57.8 62.2 Slovenia 15.2 34.5 46.8 Balkansa 28.6 25.4 37.2 Baltics 17.6 21.6 29.3 Estonia 14.1 24.0 35.5 Latvia 23.2 23.8 28.8 Lithuania 15.7 17.1 23.6 CISb 5.1 8.7 12.5 Russia 4.1 13.9 13.3 Ukraine 2.6 11.6 22.6 a Excluding Serbia and Montenegro. b Excluding Uzbekistan and Turkmenistan. Source: IMF, International Financial Statistics.
  • 17.
    Economies in transition:Regional overview 15 Country Forecast September 2006 www.eiu.com © The Economist IntelligenceUnit Limited 2006 Financial systems in transition economies have been dominated by banks. In part this was the result of the insufficient scope and effectiveness of legal contract enforcement, and weakly defined property rights. As the data in Table 5 demonstrate, banking sector assets in transition countries account for a very high proportion of overall financial assets. Table 5 Banking sector assets/total financial assets (BANK), 1990-2003 (%) 1990-94 1995-99 2000-03 East-central Europe 85.7 85.2 84.8 Czech Republic 89.4 89.0 89.8 Hungary 99.9 99.9 99.9 Poland 68.1 69.2 69.2 Slovakia 84.8 82.7 82.0 Slovenia 86.6 85.2 83.0 Balkansa 92.7 91.3 90.4 Baltic s 85.61 84.78 84.32 Estonia 82.23 81.32 80.37 Latvia 81.43 79.25 77.89 Lithuania 93.16 93.77 94.68 CISb 93.4 92.9 92.4 Russia 88.9 88.0 89.5 Ukraine 95.7 95.2 92.7 a Excluding Serbia and Montenegro. b Excluding Uzbekistan and Turkmenistan. Source: Bankscope. As argued above, the entry of foreign banks was crucial for transition countries' financial sector development. Table 6 gives the average ratios of foreign banks' assets to total bank assets for the three subperiods in our empirical exercise. Table 6 Foreign banks' assets/total bank assets (FOREIGN), 1990-2003 (%) 1993-94a 1995-99 2000-03 East-central Europe 12.9 20.3 39.0 Czech Republic 20.0 21.0 78.0 Hungary 33.5 49.0 76.0 Poland 5.0 16.2 68.9 Slovakia 5.0 12.2 70.4 Slovenia 1.0 3.0 16.4 Balkans 0.7 11.6 52.0 Baltics 1.0 41.6 71.0 Estonia 1.0 57.0 90.4 Latvia 1.0 53.8 79.1 Lithuania 1.0 14.0 43.7 CISb 0.0 6.1 25.1 Russia 0.0 8.0 23.8 Ukraine 0.0 5.0 12.3 a Owing to lack of data, first-period average covers 1993 and 1994 only. b Excluding Turkmenistan. Source: Bankscope.
  • 18.
    16 Economies intransition: Regional overview Country Forecast September 2006 www.eiu.com © The Economist IntelligenceUnit Limited 2006 0 10 20 30 40 50 60 70 80 90 100 Czech Republic Hungary Poland Slovakia Slovenia Estonia Latvia Lithuania Russia Ukraine 1993-94 1995-99 2000-03 Foreign banks (ratio of foreign banks' assets to total bank assets) Source: Bankscope. The estimated impact of financial development indicators on economic growth are reported in Table 7. In the first transition period (column 1), a measure of initial conditions (ID) seems to be the most important explanatory variable for economic growth. Financial development indicators explain economic growth only to a very limited extent. The coefficient on LLY is positive and statistically significant at the 10% level. The BANK variable is actually estimated to have had a statistically negative impact on growth. This result may not be all that surprising, since in the stages of transition the banking sector was dominated by underdeveloped or unreformed domestic banks. In the second period, 1995-99 (column 2), the measure of foreign banks' presence, FOREIGN, is included and has—as might have been expected—a positive and highly significant impact on economic growth. Foreign banks brought in new capital and skills. They encouraged competition and innovation, strengthened corporate governance and management, and rendered the sector more efficient by introducing new skills, products and technology. Table 7 Growth and financial sector development 1990-94 1995-99 2000-03 ln Y -0.026 -0.014 -0.014 (-0.149) (-2.282)* (-2.159)* ID90 -0.01 (-3.38)** REF1990-94 0.002 0.007 (2.449)** (1.749) LLY 0.002 0.002 0.002 (-2.249)* (-2.05)* (-2.053)* BANK -0.004 -0.091 0.086 (-2.527)** (-2.998)** (3.505)** FOREIGN 0.072** 0.066* (5.514) (1.921) R2 adj 0.396 0.576 0.558 Note. t statistics in parentheses; * and ** denote 10% and 5% statistical significance, respectively. The dependent variable in each subperiod is the annual average growth rate of real GDP per worker. The results
  • 19.
    Economies in transition:Regional overview 17 Country Forecast September 2006 www.eiu.com © The Economist IntelligenceUnit Limited 2006 In the estimated equations LLY, BANK and FOREIGN stand for the annual average growth rates of the ratios in the years of the given subperiod. For 1995-99, LLY is estimated to have had a positive but only marginally significant impact, providing further evidence for the proposition that increases in liquidity supported economic growth. However, the BANK variable continues to be estimated with a significant negative coefficient, as for 1990-94. Since foreign banks did not yet represent a significant share in the total banking system, the overall banking sector remained inefficient. However, FOREIGN is estimated to have had a strong positive impact on growth in this subperiod. For the 2000-03 period, LLY again has a marginally positive impact. The banking sector is by now dominated by foreign banks and this means that BANK is estimated to have a very strong impact on growth. The coefficient for FOREIGN is also estimated with a positive sign, although (unlike for 1995-99) it is only weakly significant, which is unsurprising, given the strong collinearity for this period between BANK and FOREIGN. Among the control variables, in addition to the role of the initial conditions variable in explaining growth in 1990-94, output per worker at the start of a period had a significant negative impact, in line with the convergence hypothesis, in 1995-99 and 2000-03. The indicator of lagged market reforms in 1990-94 (REF) had a significant positive impact in 1995-99, which became much weaker, and statistically insignificant, for 2000-03. Our results, however, need to be treated with caution. Given the manifold measurement and methodological difficulties that plague empirical investigations of the determinants of growth, especially for transition economies, our results can only be seen as suggestive and not conclusive. As in many regression analyses, there is uncertainty as to the primary direction of causation—whether it is from financial development to growth, or whether financial deepening merely tends to accompany or follow growth. It is also possible that variables that might also have been important influences on growth have been omitted from the estimations, or that some of the financial sector indicators are actually proxies for other factors that affected growth. Nevertheless, there are some strong and plausible a priori arguments that suggest that financial development has been crucial for transition economies' growth. This is especially the case with respect to the role of foreign banks, and this thus increases confidence in our empirical results. Overall, our results suggest a positive growth impact of certain financial sector development indicators—especially of foreign bank penetration—on transition economies' growth since the mid-1990s. Our growth accounting analysis showed that the main sources of growth for the transition economies since the mid-1990s have been growth in physical capital and total factor productivity growth. The contributions of total factor productivity to economic growth were negative in the early stage of the transition period, but then turned positive and increased thereafter in almost all subregions. Our empirical analysis also confirmed previous findings that initial conditions and economic reforms were in certain subperiods important Conclusions Caution is called for
  • 20.
    18 Economies intransition: Regional overview Country Forecast September 2006 www.eiu.com © The Economist IntelligenceUnit Limited 2006 determinants of transition countries' growth, as was the initial level of income per worker. There was also evidence that financial sector development had a positive impact on growth. In the early stage of transition period, only an increased liquidity had a positive effect on growth. In the second period, foreign banks are identified as being important, since their efficiency and ability to use new skills, products and technology in transition economies contribute strongly to economic growth. The learning-by-doing process, spillover effects and the fact that foreign banks acquired a majority of domestic banks appear to have enabled banking systems to generate a strong contribution to economic growth over the past decade. Andriesz, Ewa; Asteriou, Dimitrios and Pilbeam, Keith (2003): The Linkage between Financial Liberalization and Economic Development: Empirical Evidence from Poland, Discussion Paper Series, City University Department of Economics, London. Berg, Andrew; Borenzstein, Eduardo; Sahay, Ratna and Zettelmeyer, Jeromin (1999): The Evolution of Output in Transition Economies: Explaining the Differences, IMF Working Paper no. 73. Berglof, Erik and Bolton, Patrick (2001): The Great Divide and Beyond: Financial Architecture in Transition, The William Davidson Institute at the University of Michigan, Working Paper no. 414. Buiter, Willem and Taci, Anita (2003): "Capital Account Liberalization and Financial Sector Development in Transition Countries" in Bakker, Age F P and Chapple, Bryan (eds), Capital Liberalization in Transition Countries: Lessons from the Past and for the Future, Edward Elgar, Cheltenham. Campos, Nauro F and Coricelli, Fabrizio (2002): "Growth in Transition: What We Know, What We Don’t and What We Should", Journal of Economic Literature, vol. 40, no. 3. Coricelli, Fabrizio (1999): Financial Market Development and Financial Liberalization in Economies in Transition, Mimeo, University of Sienna. De Melo, Martha; Denizer, Cevdet; Gelb, Alan and Tenev, Stoyan (1997): Circumstance and Choice: The Role of Initial Conditions Policies in Transition Economies, World Bank Policy Research Working Paper no. 1866. Dobrinsky, Rumen (2001): Convergence in Per-Capita Income Levels, Productivity Dynamics and Real Exchange Rates in the Candidate Countries On the Way to the EU Accession, International Institute for Applied System Analysis, Laxenberg, Austria. European Bank for Reconstruction and Development (EBRD): Transition Reports, various years. Falcetti, Elisabetta; Lysenko, Tatiana and Sanfey, Peter (2005): Reforms and Growth in Transition: Re-examining the Evidence, EBRD Working Paper no. 90. References
  • 21.
    Economies in transition:Regional overview 19 Country Forecast September 2006 www.eiu.com © The Economist IntelligenceUnit Limited 2006 Fischer, Stanley; Sahay, Ratna and Vegh, Carlos: "From Transition to Market: Evidence and Growth Prospects" in Zecchini, Salvatore (ed.), Lessons from the Economic Transition: Central and Eastern Europe in the 1990s, Kluwer Publishers, Dordrecht. Giannetti, Mariassunta and Ongena, Steven (2005): Financial Integration and Entrepreneurial Activity: Evidence from Foreign Bank Entry in Emerging Markets, European Central Bank Working Paper Series. Havrylyshyn, Oleh and van Rooden, Ron (2000): Institutions Matter in Transition, but So Do Policies, IMF Working Paper no. 70. Havrylyshyn, Oleh; Wolf, Thomas; Berengaut, Julian; Castello-Branco, Marta; van Rooden, Ron and Mecer-Blackman, Valerie (1999): Growth Experience in Transition Countries: 1990-98, IMF Occasional Paper no. 184. King, Robert G and Levine, Ross (1993): "Finance, Entrepreneurship, and Growth: Theory and Evidence", Journal of Monetary Economics, vol. 32. Levine, Ross (1998): "The Legal Environment, Banks and Long-Run Economic Growth", Journal of Money, Credit and Banking, vol. 30. Shinkman, Matthew (2004), "The Banking Sector in the Countries of Former Yugoslavia", Economies in Transition: Eastern Europe and the former Soviet Union—Regional Overview, June 2004, Economist Intelligence Unit.
  • 22.
    20 Economies intransition: Regional overview Country Forecast September 2006 www.eiu.com © The Economist IntelligenceUnit Limited 2006 Political outlook Election watch Presidential Parliamentarya East-central Europe Czech Republic 2008b 2010 Hungary 2010b 2010 Poland Oct 2010 Sep 2009 Slovakia 2009 2010 Slovenia Nov 2006 2008 Balkans Albania 2007b 2009 Bulgaria Oct 2006 2009 Bosnia and Hercegovina Oct 2006 Oct 2006 Croatia 2010 2007 Macedonia 2009 2010 Montenegro 2007 2010 Romania 2008 2008 Serbia 2009 2007 Baltics Estonia 2006b 2007 Latvia 2007b Oct 2006 Lithuania 2009 2008 CIS Russia Mar 2008 Dec 2007 Ukraine 2009 2011 Belarus 2011 2008 Moldova 2009b 2009 Armenia 2008 2007 Azerbaijan 2008 2010 Georgia 2009 2008 Kazakhstan 2012 2008 Kyrgyz Republic 2010 2010 Tajikistan 2006 2010 Turkmenistan 2008-10 2009 Uzbekistan Dec 2007 2009 a For lower houses unless otherwise indicated. b President chosen by parliament. In Estonia chosen by a combination of parliament and local councils. There have been a number of elections in the region in 2006. Parliamentary elections were held in Ukraine in March; in Hungary in late April; in the Czech Republic and Slovakia in June; in Macedonia in July; and in Montenegro in September. There are still more to follow this year, with voters going to the polls in October in Latvia to elect a new parliament. Bosnia and Hercegovina (BiH) will hold both parliamentary and presidential elections in October. Belarus held a presidential election in March, and Bulgaria will hold one in October. The results of recent elections do not indicate any clear shifts in regional trends or direction. It appeared that the victory by conservatives and populists in Poland's parliamentary and presidential elections in 2005 might set the tone for the rest of central Europe in 2006. In particular, it looked fairly likely that Hungary would embrace the right-wing Fidesz-Hungarian Civic Union (Fidesz), led by Viktor Orban. However, the ruling Hungarian Socialist Party (MSZP) won
  • 23.
    Economies in transition:Regional overview 21 Country Forecast September 2006 www.eiu.com © The Economist IntelligenceUnit Limited 2006 the election in April, with a somewhat increased majority. This was the first time that an incumbent had won in Hungary since the transition began. However, the idea that this might be the beginning of a possible new regional trend of incumbents winning elections was not confirmed in either the Czech election—in which the ruling Czech Social Democratic Party (CSSD) lost power, at least temporarily—or Slovakia, where the reformist coalition government of Mikulas Dzurinda lost the election on June 17th. The same happened in Macedonia, where the opposition Internal Macedonian Revolutionary Organisation-Democratic Party of Macedonian National Unity (VMRO-DPMNE) defeated the incumbent Social Democratic Alliance of Macedonia (SDSM) in the parliamentary election on July 5th. Thus the Hungarian result appears to have been an exception to the long- standing trend in the region of incumbents almost invariably losing elections. The Hungarian result may have had much to do with the inept strategy of the right-wing opposition. Specific circumstances related to the recent successful pro-independence drive in May affected developments in Montenegro, where the incumbent government held comfortably on to power in recent elections. The ruling Democratic Party of Socialists (DPS) and its coalition partner, the Social Democratic Party (SDP), won a majority in the election held on September 10th. In some respects, the region appears now to be going backwards politically. Reform momentum throughout much of the region, especially in the new EU member states, is petering out. Poland's government is seen as eccentric— preoccupied with cultural and national issues—and incompetent; Slovakia's as populist and anti-reformist; Hungary's as spendthrift and ineffectual. The Czech Republic has been unable to find a workable government following its parliamentary election in June. Estonia, Latvia and Slovenia all have cautious or fragile coalitions, preoccupied with sharing the fruits of power rather than with pursuing further reform. In Slovakia and Poland the coalitions have an added ingredient: extremist populist parties of left and right. Lithuania has a weak minority government. Hungary's government looks weak and there are doubts over whether it can cope with serious macroeconomic problems. Robert Fico's leftist Smer-SD (Direction-Social Democracy) came to power in July in Slovakia, in coalition with the far-right Slovak National Party (SNS) and the People's Party-Movement for a Democratic Slovakia (LS-HZDS) of authoritarian former prime minister Vladimir Meciar. The populist Mr Fico's choice of coalition partners caused dismay among foreign investors and EU states, not least because it threatened to undo many of the reform gains made since 1998 under Mr Dzurinda, who had served two terms as prime minister. The new government's programme includes a promise to halt strategic privatisations; partly reverse tax, healthcare and pension reforms; increase taxes for high-earners; and to boost welfare spending. The Czech election in June was a tie. The most obvious coalition government, of the conservative Civic Democratic Party (ODS), the Christian Democratic Union-Czechoslovak People's Party (KDU-CSL) and the Green Party, had 100 seats, with the same number going to the CSSD, led by the outgoing prime Political backsliding
  • 24.
    22 Economies intransition: Regional overview Country Forecast September 2006 www.eiu.com © The Economist IntelligenceUnit Limited 2006 minister, Jiri Paroubek, and the Communist Party of Bohemia and Moravia (KSCM). The conservative ODS (which won a plurality of votes in the election) is in power only until a confidence vote on October 4th, which it will almost certainly lose. The party's leader, Mirek Topolanek, will continue as caretaker prime minister, at least until local and Senate elections later that month. Months of political uncertainty loom. In Hungary, the main opposition party, Fidesz, has already launched a campaign to transform the October municipal elections into a sort of referendum on the fiscal austerity package adopted in July. Potential major losses for the centre-left governing parties (coupled with loss of the Budapest mayoralty) would intensify internal pressure both between the governing coalition parties (the MSZP and its junior partner, the liberal Alliance of Free Democrats) and within the senior ruling MSZP. So far the region's well-performing economies (with the exception of Hungary) appear to have been remarkably immune to the trend of political uncertainty and weakness. A similar pattern can also be observed in parts of the Commonwealth of Independent States (CIS), where good economic performance has accompanied even worse political trends or similar political uncertainty (for example, Ukraine's economy has been recovering strongly despite the months-long political impasse that followed that country's parliamentary election in March 2006). However, it cannot be assumed that this disconnect between the economic and political developments in the region can persist indefinitely. In many countries there are important decisions and policy initiatives that need to be taken—such as preparing economies for euro membership, reforming the health, pension and tax systems, and other reforms to lay the basis for sustainable growth. The situation in Kosovo—the breakaway Serbian province that has been run by the UN since 1999—continues to cast a shadow over the entire region. The security situation remains fragile, and acrimonious negotiations on the final status of the province appear to be grinding towards an impasse and a possible crisis. It is difficult to predict the effects on developments in the wider region— not only in restive and resentful Serbia, but also in BiH, Macedonia and possibly further afield. Furthermore, all this is occurring when the EU's most effective instrument for influencing developments in the region and increasing the chances of stability—the offer of EU membership—has been seriously eroded and weakened by the anti-enlargement mood sweeping western Europe. The internationally mediated talks on the status of Kosovo between the Serbian authorities and representatives of Kosovo's ethnic Albanian majority have been under way in Vienna since February. Little progress has been made on any of the issues discussed so far—economic relations, minority rights, the extent of self-government for the Serb minority in the province and its links with Belgrade. The key issue of Kosovo's final status has not even been discussed yet. The UN's chief negotiator, Martti Ahtisaari, is under pressure from the Western powers to produce a solution to the intractable problem by the end of the year. A consensus of sorts appears to have been reached among the five Western members of the "Contact Group" (the UK, the US, France, Italy and Germany— Risk in the Balkans
  • 25.
    Economies in transition:Regional overview 23 Country Forecast September 2006 www.eiu.com © The Economist IntelligenceUnit Limited 2006 the remaining member is Russia) over the long-standing UK/US position of independence for Kosovo as the preferred solution. Russia stands apart from the rest of the Contact Group—although it remains unclear how Russia will behave at the end of the present process. Russia has warned that the solution for Kosovo had to be based on general principles and that it would have universal implications, including for frozen conflicts in the former Soviet Union. Some see Serbia's assent for independence as the key to a lasting and stable settlement, but no Serbian government will sign an agreement that grants Kosovo independence. Many appear to have genuinely believed that it would be possible to entice Serbia into giving its assent to "conditional independence", and that Serbia might be tempted by the compensation of "accelerated Euro- Atlantic integration" (at least until French and Dutch voters put a dampener on further EU enlargement in 2005 by rejecting the EU's constitutional treaty). Furthermore, the decision by the EU in early May to suspend talks with Serbia and Montenegro on a stabilisation and association agreement (SAA) owing to the failure of Serbia to capture Ratko Mladic and extradite him to the Inter- national Criminal Tribunal for former Yugoslavia (ICTY) in The Hague has further complicated matters and reduced the scope for EU influence on Belgrade. A recommendation by the West for an independent Kosovo would not be easy to push through. It would require a new UN Security Council resolution, and Russia might well oppose this. Today's assertive Russia is not the Russia of the 1990s that backed most Western decisions on the Balkans. Indeed, in a recent interview with Western journalists, Russia's president, Vladimir Putin, for the first time stated explicitly that Russia would use its veto in the UN Security Council to prevent a solution for Kosovo that "was not acceptable to us". He repeated warnings from earlier this year that independence for Kosovo could not be treated as a sui generis case and that it would set a precedent for other troubled regions, including breakaway territories in the former Soviet Union such as Abkhazia and South Ossetia. All this might mean a fudged solution, and at the very least delay considerably the implementation of any envisaged Kosovo independence. The UN might be bypassed altogether. However, this would mean a messy process of bilateral recognitions of Kosovo and would mean that Kosovo could not become a UN member. Even if all these obstacles are overcome, the absence of Serbian agreement poses risks. On the one hand, Serbian rejection may not have any practical consequences, especially in the short to medium term. The Serbian position would become a classical revisionist one of waiting until international circumstances changed. Although the issue could be a harmful distraction in Serbian political life for years, Serbia's claim over Kosovo might assume the same character—with little practical significance—as, for example, the constitutional commitment of the Republic of Ireland to the island's unification. However, there could also be more immediate destabilising consequences, and the present equanimity with which the risks for Serbia and the fallout for the region are sometimes viewed may not prove justified. A messy denouement
  • 26.
    24 Economies intransition: Regional overview Country Forecast September 2006 www.eiu.com © The Economist IntelligenceUnit Limited 2006 The EU is still struggling to recover its sense of direction following the rejection of the EU's constitutional treaty by French and Dutch voters in mid-2005. The agreement reached by EU heads of state and government in December 2005 on the EU's budget for 2007-13 removed an important irritant between key member states, but it has not restored a renewed sense of purpose. The EU is no closer to resolving the deep disagreements among its existing member states about the future structure and reach of the EU. The current political climate in the EU clearly poses problems for future enlargements. A major cause of opposition to the EU's constitutional treaty was the perceived negative economic impact of the 2004 enlargement—namely through competition for jobs and investment. Public opposition to further enlargement has increased in many EU member states, along with concerns about the ability of the EU's institutions to cope with additional members. According to the most recent Eurobarometer poll, in the 15 "old" EU members, only 41% of the public are now in favour of further enlargement. The French constitution had already been amended earlier in 2005 to require referendums to ratify any enlargement following the accession of Bulgaria, Romania and Croatia. For many of the states still clamouring to join, there is now a risk that political hostility to enlargement in the EU15 will close off their membership prospects for the foreseeable future. Bulgaria and Romania are set to join the EU on January 1st 2007 (at most there could have been a one-year delay until January 2008), but this will be under the strictest conditions ever applied to new members. Bulgaria, in particular, will come under tough EU scrutiny and faces possible legal and financial sanctions unless it demonstrates progress in tackling organised crime and high- level corruption. The European Commission, which is due to issue a report on the two countries' readiness at the end of September, appears to have rejected the idea of postponing Bulgaria or Romania's entry until 2008 on the grounds that it would discourage reformers. However, the two countries, especially Bulgaria, are likely to be subject to "safeguard measures"—sanctions that can be activated after a country joins the EU. The EU has the power to suspend regional aid payments worth billions of euro to either Bulgaria or Romania if they are shown to be subject to persistent fraud. If Bulgaria fails to tackle crime and corruption, it could be excluded from EU legal co-operation and its courts' judgements would not be recognised by the EU. In Bulgaria's case, the Commission wants the establishment of a system for assessing farmers' claims for aid; results in investigating and prosecuting organised crime networks; implementation of anti-corruption laws; the enforcement of anti-money-laundering provisions; and improved financial controls of structural and cohesion funds. The demands on Romania are considerably less onerous and involve the setting up of an agency for dealing with direct payments to farmers; establishing a system for assessing farmers' claims for aid; and providing "real time" information on value-added tax (VAT) refunds in order to fight fraud. Further EU enlargement Slipping support for further enlargement Bulgarian and Romanian EU membership
  • 27.
    Economies in transition:Regional overview 25 Country Forecast September 2006 www.eiu.com © The Economist IntelligenceUnit Limited 2006 Official concern in Brussels about Bulgaria's and Romania's preparations is likely to heighten the mood of "enlargement fatigue" in the EU. There are fears in some member states that the accession of the two poor countries in south- eastern Europe could lead to mass immigration and increased organised crime. In 2005 the EU decided to open membership negotiations with Croatia, after a ruling that Croatia was co-operating fully with the ICTY in The Hague. Macedonia has received a positive (if qualified) European Commission avis (opinion) on its application. After long delays, on June 12th Albania signed with the EU an SAA—the EU's main pre-candidate status instrument. The EU also commenced negotiations on SAAs with BiH and with Serbia and Montenegro— talks with the latter were, as mentioned, suspended at the beginning of May because of Serbia's failure to capture and deliver Mr Mladic to the Hague war- crimes tribunal. Montenegro is hoping that independence will provide it with a "fast track" towards EU membership, although that looks doubtful given the unfavourable climate to further EU expansion and the EU's concerns about corruption, organised crime and weak administrative capacity in Montenegro. That the process is proceeding formally is, however, hardly a surprise. It could scarcely have been otherwise, given the challenges faced by the EU in the region, including the Kosovo issue; the West's efforts to make BiH a unitary state; and the fragility of Macedonia. At such a time the EU was hardly going to jettison its main (and arguably only effective) foreign policy tool of the prospect of membership. Croatia's path to the EU has been smoothed by the capture last year of Croatia's main war-crimes indictee, Ante Gotovina. However, the growing anti- enlargement mood in many EU countries—and the wish by some to signal to other membership aspirants that the enforcement of admission criteria will be tougher in the future than it has been in the past—also poses potential problems for Croatia. Even if, as expected, Croatia succeeds in implementing all the necessary reforms for membership, its chances of admission to the EU in the near future are uncertain. Croatia is well aware that the failure of the EU constitution has been interpreted by leading European political figures as a vote against further expansion. Securing the approval of all 25 member states (or 27 after Bulgaria and Romania are admitted) may prove difficult. The Treaty of Nice, which provides for only 27 members, would also have to be amended in order to accommodate Croatia and any other new members. For the rest of the Balkans, the backlash against enlargement looks even more serious. The western Balkan countries were pretty much promised eventual membership at the EU's Thessaloniki summit in 2003. The region has struggled to come to terms with its post-war legacy, and views future EU membership as a key to peace and economic development. Even more than in the case of central Europe, the hope of EU membership seems to be the main driver of political and economic reform in the region. The conclusions of the meeting of EU foreign ministers in Salzburg in March will hardly have reassured the countries of the western Balkans. The closing statement confirmed that "the future of the western Balkans lies in the EU", but added the dampener that "the EU also notes that its absorption capacity has to be taken into account". The western Balkans Croatia's prospects
  • 28.
    26 Economies intransition: Regional overview Country Forecast September 2006 www.eiu.com © The Economist IntelligenceUnit Limited 2006 Big questions thus remain about the future of the EU accession process, as well as its effectiveness in transforming the candidate countries. The specific French requirement for ratification by referendum of future enlargements contributes to doubts about the credibility of the enlargement process. The EU could string the potential candidates along so tortuous and demanding an accession path that it could amount to de facto exclusion. The defeat of the EU constitution has changed the rules of the game. For several years the carrot of potential EU entry and the stick of potential exclusion served to influence the behaviour of political actors in the region. As the realisation sinks in that EU expansion in even the medium term is highly unlikely, the ability of EU policymakers to influence Balkan states will wane. Countries such as Ukraine and Moldova continue to view EU membership as a long-term objective. In the current climate, it is highly unlikely that these countries will soon be considered as candidates for membership. Nevertheless, although these countries have never featured particularly highly on the EU's agenda, the entry to office of a Western-oriented government in Ukraine in early 2005 has put pressure on the EU to put more flesh on its fledgling European Neighbourhood Policy (ENP), which is envisaged as an alternative to membership. The prospects for further enlargement of the EU will depend in part on how successful Europe is in resuscitating its economy. As long as millions of Europeans are unemployed, or fear for their jobs, they will be reluctant to welcome new EU members and their workers. Enlargement prospects will also depend on the direction in which the EU develops. For example, greater use of "variable geometry"—the idea that not every member state needs to take part in every EU policy area—would make enlargement more likely. Finally, if EU applicants are prepared to accept long derogations or "safeguards" that would postpone their full participation in some EU policies, further enlargement might become more politically acceptable in western Europe. EU economic recovery may hold the key to further enlargement
  • 29.
    Economies in transition:Regional overview 27 Country Forecast September 2006 www.eiu.com © The Economist IntelligenceUnit Limited 2006 Economic forecast Global outlook 2005 2006 2007 2008 2009 2010 Real GDP growth (%) US 3.2 3.3 2.2 2.9 3.0 3.0 Euro zone 12 1.3 2.3 1.8 2.0 2.1 2.0 World (market exchange rates) 3.5 3.9 3.2 3.2 3.2 3.2 World (PPP) 4.9 5.3 4.7 4.7 4.5 4.6 World trade growth (%) Goods 7.8 9.3 7.6 7.7 7.9 7.9 Consumer price inflation (%; av) US 3.4 3.8 3.3 2.8 2.7 2.7 Euro zone 12 2.1 2.3 2.2 1.9 1.8 1.8 Export price inflation (%; av) Manufactures (US$) 2.5 2.7 7.6 2.3 1.2 1.4 Commodities (% change in US$ prices) Oil (Brent; US$/b) 54.7 71.1 70.0 59.0 48.0 45.0 Non-oil commodities 4.1 24.5 -3.8 -6.5 -11.6 -4.8 Food, feedstuffs & beverages -0.5 8.9 -4.5 0.7 -6.7 0.9 Industrial raw materials 10.3 43.6 -3.2 -13.1 -16.8 -11.5 Interest rates (%) US$ 3-month commercial paper rate (av) 3.5 5.2 5.3 5.6 5.7 5.7 € 3-month interbank rate (av) 2.2 3.1 3.9 3.9 3.9 3.9 Exchange rates US$:€ (av) 1.24 1.26 1.37 1.33 1.29 1.25 ¥:€ (av) 137 143 137 127 120 115 ¥:US$ (av) 118 108 97 95 93 90 World GDP growth has been strong in 2006 and is expected to reach 5.3% in the year as a whole, compared with 4.9% in 2005 (measured using purchasing power parity—PPP—weights). But a slowdown in parts of the developed world will soon affect world growth. In 2007 world growth is expected to slow to 4.7%, which will still represent a robust performance. Economic expansion over the forecast period as a whole (2006-10) will average about 4.7% per year, better even than the strong performance of the previous five years. Measured using GDP at market exchange rates, the world economy is forecast to expand by 3.9% in 2006 and 3.2% in 2007, a pace that will be maintained in 2008-10. The very rapid rate of expansion of China and India means that these two countries are driving much of the global growth, although growth has been sturdy, if not nearly as fast, in many other regions. World activity is also benefiting from the fact that global liquidity remains high by historical standards, notwithstanding ongoing monetary tightening by the major central banks. Real GDP growth in the euro zone reached a rate of 2.4% year-on-year in the second quarter of 2006, its highest level in four and a half years. Euro zone growth in 2006 as a whole is projected at 2.3%. A slowdown in 2007 will be largely attributable to a contraction in consumer demand in Germany related to a rise in value-added tax (VAT). Almost all euro zone countries will experience at least a slight slowdown in 2007, a result of a worsening external environment and the strengthening of the euro against the US dollar. This is The outlook for the euro zone
  • 30.
    28 Economies intransition: Regional overview Country Forecast September 2006 www.eiu.com © The Economist IntelligenceUnit Limited 2006 reflected in falling measures of business confidence. Consumers in these economies look likely to pick up the slack, at least in the short to medium term. West European growth has a strong impact on economic activity in the new EU members and most of the Balkan economies, given the large share of their exports directed to western Europe. For the east-central European countries, merchandise exports to the EU15 are on average equal to one-third of GDP. Exports to Germany alone account for about 20% of GDP in the Czech Republic, Hungary and Slovakia. Most new EU members in eastern Europe are thus highly sensitive to shifts in demand in the developed west European EU states—although most new EU members have been successful in recent years in compensating at least in part for slow euro zone growth by redirecting trade to faster-growing regions. An encouraging sign for the transition economies at present is the pick-up in their main trade partner, Germany. Real GDP growth in Germany is expected to accelerate from 0.9% in 2005 to 2.2% in 2006. After four years of consecutive decline the Economist Intelligence Unit expects gross fixed investment to rise in 2006 on the back of a substantial increase in corporate profits. A slight improvement in the labour market, a stabilisation of real wages (after earlier falls) and an improvement in confidence have boosted consumer demand. Advance purchases ahead of the VAT increase planned for 2007 are boosting private consumption in 2006, but the VAT rise will have the opposite effect in 2007. The VAT increase will lead to slowdown in the German economy in 2007, with growth projected at only 1.4%. The strong euro will prevent EU exports from growing quickly, and higher euro zone interest rates and continuing worries about unemployment will limit the recovery in euro zone domestic demand. Real GDP growth from 2008 is expected to average about 2% per year, equal to the trend rate. Another factor that will prevent faster growth will be a high ratio of savings to disposable income in the household sector. Consumers' propensity to spend may be dampened by fears about their governments' ability to meet pension liabilities and healthcare costs. The outlook for many of the economies in the Commonwealth of Independent States (CIS) continues to be tied to Russia, which is the main export destination for most CIS members. Strong Russian import demand has made a major contribution to the subregion's rapid growth in recent years. Our baseline forecast is for strong growth in the world economy over the forecast period, but there are a number of threats that could drag down global economic performance. The most significant global economic risks in the short term stem from the possibility that the US slowdown could be sharper than expected and that the US slips into recession. The main threat to the global outlook has for some time stemmed from the large US current-account and fiscal deficits and the implications of these for the sustainability of the US dollar's exchange rate. A significant slide in the US dollar, as opposed to a gradual adjustment of US imbalances, would elicit a policy response that would lead to a sharp increase in interest rates and a recession. Western Europe and much of the rest of the world would be likely to be seriously affected. Russia and the CIS outlook
  • 31.
    Economies in transition:Regional overview 29 Country Forecast September 2006 www.eiu.com © The Economist IntelligenceUnit Limited 2006 Persistently high international oil prices have threatened to drag down economic performance in oil-importing countries—although they are boosting the short- term prospects of CIS energy exporters. We expect prices to average about US$70/barrel (dated Brent Blend) in 2006 and 2007. The market remains vulnerable to supply disruptions. Although the world has become more efficient in its use of oil than in the past (the oil intensity of economic activity has fallen by one-half over the past 20 years), high prices are inevitably placing a heavy burden on oil consumers. Thus, if prices should rise further, or even if they are sustained at the present high levels, the relative immunity of world growth to oil prices may not last. Other risks include the threat of trade protectionism in the wake of the failure of the Doha round of trade liberalisation talks. Rising protectionist sentiment can also be seen around the world in measures to restrict foreign investment in so-called strategic sectors. There is also an array of geopolitical risks in the Middle East and elsewhere that could have a negative impact on global economic activity. Growth in the transition countries has remained solid despite the impact of high oil prices on oil importers, and of domestic political uncertainty and/or reform slowdowns in many countries. The overall outlook for the region for 2006-07 remains good, with average growth in 2006 increasing to 6.6%, compared with 5.8% in 2005. GDP growth is forecast to drop back to 5.7% in 2007 as a result of slowing Russian growth and a decline in euro zone demand. Throughout east-central Europe growth accelerated in the first half of 2006, often to record levels. Surging domestic demand has tended to be the main driver of growth, although export growth has also held up well in most countries. Polish real GDP growth continues to accelerate, the pattern since early 2005. Second-quarter growth reached 5.5% year on year, compared with 5.2% in the first quarter. Gross fixed capital formation surged by 11.4% in the first half of 2006, because of more intensive use of EU funding and the improving financial condition of Polish corporates. Private consumption growth was 4.1% in the first half of 2006, compared with 2.4% in the same period of 2005. Net exports continue to provide a positive contribution to growth, although this was slightly lower in the second quarter than in the first. Real GDP growth (%, year on year) 2005 2006 1 Qtr 2 Qtr 3 Qtr 4 Qtr 1 Qtr 2 Qtr Czech Republic 5.4 5.8 5.8 6.9 7.1 6.2 Estonia 7.2 9.9 10.6 11.1 11.7 12.0 Hungary 3.2 4.5 4.5 4.3 4.6 3.8 Latvia 7.6 11.4 11.4 10.5 13.1 11.1 Lithuania 4.4 8.4 7.9 8.8 8.8 8.4 Poland 2.2 2.9 3.9 4.3 5.2 5.5 Romania 5.9 4.1 2.4 4.3 6.9 7.8 Slovakia 5.4 5.4 6.3 7.4 6.3 6.7 Slovenia 2.8 5.4 3.6 3.7 5.1 4.9 Sources: National statistics; Economist Intelligence Unit. Surge in first-half growth Short-term outlook
  • 32.
    30 Economies intransition: Regional overview Country Forecast September 2006 www.eiu.com © The Economist IntelligenceUnit Limited 2006 Hungary's pace of real GDP growth remains the slowest in central Europe. It slowed to 3.8% year on year in the second quarter of 2006, from 4.6% in the previous quarter (which was also the slowest rate in the subregion), on the back of a sharp slowdown in domestic demand. Exports remain the main driver of growth—they rose by 15.1% year on year in the second quarter, although this was down on the 18.2% growth posted in the first quarter. Gross fixed capital formation decreased by 3.6% in the second quarter, which was triggered by the combined effect of much lower motorway construction costs and a 9.4% drop in real estate investments. The first-half data do not incorporate the effects of the government's austerity package, which was adopted by parliament in July. Further deceleration in GDP growth in the second half of the year can be expected, triggered by the negative impact on domestic demand. An increase in the effective corporate tax rate will put downward pressure on investment, as will a fiscally induced slowdown in motorway construction. The Czech Republic's real GDP growth slowed to 6.2% year on year in the second quarter, after hitting a record high of 7.1% in the first. Private consump- tion growth remained robust in the first half, reaching almost 4% owing to tax cuts that have boosted disposable incomes. Fixed investment growth has also remained firm, at some 6% year on year in the first half of 2006. The net contribution of foreign trade to real GDP growth is weakening somewhat, as stronger domestic demand continues to pull in larger amounts of imports. Growth in Slovakia accelerated to 6.7% year on year in the second quarter, from 6.3% in the first (although first-half growth was down on the rate of expansion reached in the second half of 2005). Domestic demand continued to drive GDP growth in the second quarter, although some slowdown was more than offset by an improvement in the performance of the external sector. Private consumption lost some momentum, rising by 5.9%, compared with a 6.6% gain in January-March. Investment growth slowed more sharply, to 7%, following 16% growth in the first quarter. The external sector exerted a smaller drag on GDP than in the first quarter, owing to a sharp slowdown in import growth (to 15.1% in the second quarter, from 20.8% in the first). Slovenia's real GDP grew by 4.9% year on year in the second quarter of 2006, slowing slightly from the 5.1% growth in the first quarter. The importance of consumption for GDP growth increased for the fourth quarter in a row: it contributed 4.5 percentage points to the 4.9% growth. After brisk growth at the beginning of the year, exports and imports slowed in the second quarter: exports expanded at an annual rate of 8.6%, down from 14.9% in the previous quarter, and import growth slowed to 8%, from 13.5% in the first quarter. Consequently, the external trade balance contributed very little to GDP growth. Romania's real GDP growth surged to 7.8% in the second quarter, so that first- half growth amounted to 7.4%, which exceeded most expectations. Economic growth was led by growth in construction, industry and services. Construction increased by 14.2% year on year in the second quarter, industrial production by 7.8% and services by 7.5%. Growth at this high level is likely to be unsustainable, as it is being driven by consumption, fuelled by strong credit growth. Hungarylags behind Surging growth in Romania
  • 33.
    Economies in transition:Regional overview 31 Country Forecast September 2006 www.eiu.com © The Economist IntelligenceUnit Limited 2006 Real GDP growth continues at a very robust pace in the Baltic states, at faster than expected rates. Latvian and Estonian real GDP grew by about 12% year on year in the first half of 2006; Lithuania's economy lagged slightly behind its Baltic neighbours, with "only" 8.6% growth over the same period. In the CIS average real GDP growth was 6.5% in the first half of 2006, an acceleration over the 5% recorded in the first quarter. There was considerable variation in performance—ranging from the remarkably high rate of oil-driven expansion in Azerbaijan to the sluggish performance of the Kyrgyz Republic, in which industrial output has dropped sharply. Domestic demand—as revealed by generally strong growth in fixed investment and retail sales volumes—has been the main driver of growth in most of the CIS. On the supply side, construction and consumer-related services have been the main growth areas, with industrial production growth lagging behind. Indicators of economic activity, Jan-Jun 2006 (% change, year on year) Real GDP Industrial output Fixed investment Retail sales volume Russia 6.5 4.4 9.4 11.3 Ukraine 5.0 3.6 12.2 24.7 Belarus 10.1 12.6 36.9 16.6 Moldova 6.2a -6.4 13.0 7.0 Armenia 11.9 -1.0 31.8 12.1 Azerbaijan 36.3 41.1 7.9 12.1 Kazakhstan 9.3 5.1 25.2 13.5 Kyrgyz Republic 3.1 -6.8 18.4 15.7 Tajikistan 7.1 6.3 31.0 8.8 Uzbekistan 6.6 9.7 4.5a 11.6 CIS average 6.5 5.5 12.0 13.0 Note. Data are unavailable for Georgia and Turkmenistan. a January-March. Sources: CIS Interstate Statistical Committee; national statistics. In Russia real GDP growth accelerated to 7.4% in the second quarter from 5.5% in the first (when Russia's coldest winter in a generation dampened economic activity). Year-on-year growth in the first half of the year amounted to 6.5%. The pick-up has been led by construction, which posted year-on-year growth of 12.3% in the second quarter, up from just 1.6% in the first quarter. The trade sector also maintained double-digit rates of growth. The Ukrainian economy has recently shown signs of picking up sharply, with real GDP growth in January-July accelerating to 5.5% year on year, up from 2.6% in 2005. Growth has been driven by a combination of rising world prices for exports, such as steel, and increased domestic demand. Despite political uncertainty and stalling reforms, short-term economic prospects for east-central Europe remain good. Annual average growth in 2006-07 in the subregion is forecast to reach 4.8%, compared with 4.3% in 2005. Rising disposable incomes and large public investment projects funded by the EU, as well as strong inflows of foreign direct investment (FDI), are boosting domestic demand. Import demand in the euro zone has picked up and exporters are also proving adept at penetrating new markets, particularly China. Good short-term prospects
  • 34.
    32 Economies intransition: Regional overview Country Forecast September 2006 www.eiu.com © The Economist IntelligenceUnit Limited 2006 In Poland, sluggish domestic demand caused real GDP growth to slow from 5.4% in 2004 to 3.4% in 2005. However, growth is expected to pick up strongly to 5.2% in 2006 and to slow only to 4.8% in 2007. Consumer spending is set to continue to grow at a rapid pace in 2006-07, and investment is expected to increase rapidly. The dampening effect of a stronger zloty on exports will be outweighed by rising productivity and a gradual recovery in demand in Poland's main west European markets. Hungary's real GDP growth is forecast to slow to 3.9% in 2006, and to 2.9% in 2007 as a result of a substantial (and long overdue) fiscal tightening. Moreover, the risks to Hungary's outlook are greater than in the case of its neighbours. Hungary remains the economy most at risk in the region to turmoil in emerging markets. Investors have been taking a closer look at the country's large current- account and fiscal deficits, both of which are running at or above 8% of GDP. Although the government has taken steps to restrain the expansion of the fiscal deficit, there are serious doubts about the government's ability to meet ambi- tious deficit-reduction targets. The authorities plan to reduce the fiscal deficit by some 4 percentage points of GDP in 2007. However, the measures will be difficult to implement in view of legal and administrative complexities. Since the package relies mainly on raising taxes, and not reducing spending, it may adversely affect potential growth, not just aggregate demand in the short term. In the Czech Republic, real GDP growth is forecast to decelerate from 6.1% in 2005 to an annual average of 5.6% in 2006-07. Domestic demand will be the primary driver of growth. Investment activity will be supported by large public investment projects, as a result of increased use of EU structural funds and inflows of FDI. Private consumption growth is likely to accelerate as a consequence of cuts in income tax, an improving labour market and the stimulatory effects of increased investment. The net contribution of foreign trade to real GDP growth will remain positive, but will be weaker than in 2005, as stronger domestic demand pulls in larger amounts of imports. Slovakia will remain the fastest-growing economy in east-central Europe. The primary drivers of growth in 2006-07 will be investment and exports. Despite a projected slowdown compared with 2005, capital spending will remain strong well into 2006, as the two new car-assembly plants owned by PSA Peugeot- Citroën (France) and Kia Motors (a division of South Korea's Hyundai) become operational. The government will also contribute to infrastructure spending, using privatisation proceeds and EU funding. Exports are forecast to continue to grow strongly, owing to a recovery in demand in the euro zone and rising automotive production, the bulk of which is destined for foreign markets. Personal consumption growth will decelerate slightly, owing to rising interest rates and slower real wage growth. Real GDP growth is forecast to reach 6.2% in 2006, before moderating to 5.4% in 2007. We expect a pick-up in average growth in the Balkan economies in 2006, although weaker external demand and policies to curb escalating external imbalances will lead to slower growth in 2007. Growth will slow in 2006 in Albania, Serbia and Bulgaria—and is expected to remain the same as in 2005 in Risks to Hungary Automotive sector underpins Slovak expansion
  • 35.
    Economies in transition:Regional overview 33 Country Forecast September 2006 www.eiu.com © The Economist IntelligenceUnit Limited 2006 Macedonia—but it will accelerate by more than 2 percentage points in the subregion's largest economy, Romania. Macroeconomic indicators (%; annual average) GDP growth Inflation 2005 2006 2007 2005 2006 2007 East-central Europe 4.3 5.2 4.5 2.6 2.9 3.3 Czech Republic 6.1 6.2 5.0 1.9 2.7 3.3 Hungary 4.1 3.9 2.9 3.6 3.6 6.0 Poland 3.4 5.2 4.8 2.1 1.3 2.0 Slovakia 6.1 6.2 5.4 2.7 4.3 2.8 Slovenia 3.9 4.0 4.2 2.5 2.4 2.4 Balkans 4.7 5.7 5.0 5.5 5.9 4.4 Albania 5.5 5.0 6.0 2.4 2.8 2.5 Bosnia and Hercegovina 5.0 5.3 5.3 4.5 7.6 4.0 Bulgaria 5.5 5.0 4.5 5.0 7.4 4.3 Croatia 4.3 4.5 4.5 3.3 3.4 2.7 Macedonia 4.0 4.0 4.5 0.0 3.0 2.0 Montenegro 4.1 6.0 6.0 3.4 2.5 3.5 Romania 4.1 6.5 5.0 9.0 7.2 5.6 Serbia 6.3 6.0 5.5 16.1 13.6 10.7 Baltics 8.8 8.8 7.4 4.5 4.7 3.8 Estonia 9.8 9.5 8.2 4.1 4.3 3.2 Latvia 10.3 9.7 7.5 6.7 6.3 4.8 Lithuania 7.5 7.9 7.0 2.7 3.6 3.3 CIS 6.5 7.3 6.3 8.6 8.8 8.6 Russia 6.4 6.5 5.9 12.7 9.8 9.3 Ukraine 2.6 6.3 6.0 13.5 8.0 10.0 Belarus 9.2 8.8 6.0 10.3 7.7 12.6 Moldova 7.1 4.5 5.5 11.9 12.8 12.5 Armenia 14.0 9.0 8.0 0.6 8.7 2.8 Azerbaijan 26.4 33.0 17.5 9.6 7.7 7.7 Georgia 9.3 8.8 6.4 8.2 10.0 8.1 Kazakhstan 9.4 9.0 8.7 7.6 8.7 7.1 Kyrgyz Republic -0.6 2.0 4.0 4.3 6.4 7.0 Tajikistan 6.7 7.0 7.2 7.1 7.5 6.5 Turkmenistan 6.0 13.0 3.0 10.6 11.0 11.3 Uzbekistan 7.0 6.5 6.7 6.9 7.5 8.1 New EU members 4.7 5.6 4.8 3.3 3.6 3.5 Transition economies total 5.8 6.6 5.7 6.2 6.5 5.9 The short-term outlook in the Baltic states remains very promising. The average growth rate in the subregion in 2006 is expected to match that of 2005 (8.8%). Despite a deceleration in 2007 to a projected 7.4%, growth will remain considerably more rapid than in east-central Europe. Domestic demand growth has been strong, but solid performance by the region's highly competitive export sectors has also driven growth. The Baltic states are benefiting greatly from strong flows of FDI, and their exports are shifting up the value chain, allowing Estonia, Latvia and Lithuania to hold their own against Asian competitors. Economic performance in the CIS has been strong over the past few years, despite slow structural reforms. Some of this is the result of a bounce-back from the steep post-Soviet decline. Other factors are also at work, particularly in the Baltic economies continue to surge
  • 36.
    34 Economies intransition: Regional overview Country Forecast September 2006 www.eiu.com © The Economist IntelligenceUnit Limited 2006 drivers of growth in the region. High oil prices are clearly important for the main energy exporters—Russia, Kazakhstan and Azerbaijan. Increased export earnings have driven growth in investment and consumption. Moreover, both the western CIS and Central Asia have benefited from the import boom in Russia and Asia, particularly China. The region's dependence on the energy industry means that, in the absence of diversification, moderating oil prices and production trends will continue to drive GDP growth. In several countries, domestic demand has also been boosted by substantial inflows of remittances (Armenia, Georgia, the Kyrgyz Republic, Moldova, Tajikistan). We forecast that average growth in the CIS will accelerate to 7.3% in 2006—one of the fastest rates of expansion in the world, outside of China—before moderating to a projected 6.3% in 2007. In Russia, real GDP growth is expected to reach 6.5% in 2006, before slowing to 5.9% in 2007. Strong consumer demand will continue to fuel growth, and we expect investment growth to remain at recent robust rates of around 10% per year. However, sluggish growth in the oil and gas sector and the gradual erosion of competitiveness in the non-oil sector will limit export growth and boost import growth. Nowhere has the disconnect between unstable politics and weak policymaking and economic performance been more evident than in Ukraine. Politically, the past few years in Ukraine have been characterised by the turmoil of a disputed presidential election, a popular revolt and most recently by months of gridlock following the indecisive outcome of a general election. Nevertheless, the country is experiencing a recovery in growth and increasing foreign investment. The recent resolution of Ukraine's political stalemate augurs well for the outlook in 2007. The end to election-related uncertainties is already encouraging investment. Although real personal income growth will slow—as price rises for gas and other utilities in 2006 have a dampening effect on disposable incomes—earnings growth should still be sufficient to ensure fairly strong household consumption growth. 0.0 2.0 4.0 6.0 8.0 10.0 12.0 Czech Republic Hungary Poland Slovakia Slovenia Bulgaria Croatia Romania Estonia Latvia Lithuania Russia Ukraine 2005 2006 2007 Source: Economist Intelligence Unit. Real GDP growth (%) The main reason behind Azerbaijan's stellar GDP growth rate is that its oil production is rising at an annual rate of about 40%. Nearly all of Azerbaijan's oil output is exported, and the Baku-Tbilisi-Ceyhan (BTC) pipeline came on stream in early June, enabling Azerbaijani oil to reach Western markets. Gas Recovery in Ukraine
  • 37.
    Economies in transition:Regional overview 35 Country Forecast September 2006 www.eiu.com © The Economist IntelligenceUnit Limited 2006 production is also set to increase by about 20% in 2006, once the Shah Deniz field comes on stream in late September or early October. The boom in oil exports is also boosting domestic demand; investment in sectors such as construction is still rising strongly; large wage rises (wages rose by a cumulative 30% in 2004-05 in real terms and are forecast to increase by a further 14% in 2006) are driving growth in private consumption; and the government is raising budget spending by about 60% in nominal terms in 2006. Import growth, although remaining strong, is forecast to weaken slightly, now that the major construction work on the oil and gas pipelines has been completed. Elsewhere in the Caucasus, economic growth should also remain strong in Armenia. In Central Asia, rapid economic growth is expected to continue in Tajikistan, but some moderation of output growth is expected in the other Central Asian CIS economies. Authoritarianism, secrecy and market distortions mean that the statistical data published in Turkmenistan (and to a lesser extent in Uzbekistan) are highly suspect. Official figures will continue to show strong growth over the forecast period, but output growth is over-reported and is valued at administratively set prices. The commodity price boom has complicated efforts to diversify production and exports away from primary goods. Attracted by high expected export earnings, investment—both domestic and foreign-financed—has focused mainly on extractive industries (Azerbaijan, Turkmenistan) or on commodity transport infrastructure (oil and gas pipeline projects in Armenia, Azerbaijan, Georgia, Kazakhstan). The overall level of investment in the region remains low (at 20% of GDP)—the recent recovery notwithstanding—which casts doubt on the sustainability of current growth rates over the medium term. Despite the benign baseline outlook for the transition region, there are a number of risks to the prospects for further rapid growth, ranging from slow reform in many CIS countries to threats to the global outlook. Additional uncertainties about east European export growth stem from the increasingly strong competi- tive pressures coming from Asian producers. Risks to the baseline forecast are also associated with fiscal deficits in some of the larger east-central European economies, large external imbalances in the Balkans, and commodity depen- dence in the CIS. Across the region, rapid credit growth is a sign that financial sectors are developing, but it also raises concerns about future financial stability. Average inflation in 2006 in most subregions is expected to be similar to the rates recorded in 2005. In much of east-central Europe underlying inflationary pressures will remain largely subdued, despite high international oil prices, owing to structural economic changes that are driving rapid productivity improvements. In the Balkans disinflation is expected in Romania and Montenegro. Serbia—the only country in the subregion with double-digit inflation—should see some reduction this year in its annual inflation rate, although not to single digits. Elsewhere in the subregion inflation will tend to rise in 2006 after having declined in recent years, driven by strong domestic credit growth and high international oil prices. In the CIS, inflation has declined in recent months, but it remains at or close to double-digit levels in many countries, especially the oil exporters. Disinflation Risks abound Inflation
  • 38.
    36 Economies intransition: Regional overview Country Forecast September 2006 www.eiu.com © The Economist IntelligenceUnit Limited 2006 is complicated by the focus of many central banks on stabilising the nominal exchange rate in the face of large current-account surpluses and capital inflows. The scope for sterilisation of foreign-exchange purchases is limited by underdeveloped domestic debt markets, and base money growth remains above levels consistent with low, single-digit inflation rates. The danger is that inflationary pressures may become entrenched. In some energy-importing countries, inflationary pressures could also emerge from the prospective repricing of fuel and gas imports. 0.0 2.0 4.0 6.0 8.0 10.0 12.0 14.0 Czech Republic Hungary Poland Slovakia Slovenia Bulgaria Croatia Romania Estonia Latvia Lithuania Russia Ukraine 2005 2006 2007 Inflation (av; %) Source: Economist Intelligence Unit. Among the new EU member states, current-account deficits are at high levels in Hungary, Slovakia and the Baltic countries. Only in the Czech Republic, Poland, and Slovenia are the deficits relatively modest. Large external imbalances are also a problem in much of the Balkans, and expose these countries to appreciable risks of external shock. Current-account deficits in all subregions, except the CIS, are expected to widen in 2006 compared with 2005 and generally to remain at similar levels as a share of GDP in 2007. The region’s large current-account deficits have reflected in part favourable investment opportunities. To varying degrees within the region, however, the deficits have also been the result of rapid credit and consumption growth, asset price increases and, in some cases, substantial real exchange-rate appreciation—often in the context of limited nominal exchange-rate flexibility. This combination of factors can lead to external vulnerabilities. In some countries the inflows have been associated not just with private-sector financial imbalances, but also with substantial fiscal imbalances, notably in Hungary. In Hungary, with the current-account deficit set to run at 7-8% of GDP over the next two years, the forint is certainly vulnerable to further weakening, despite recent tightening by the central bank. This is creating strains in an economy where exchange-rate exposure has increased greatly through euro-denominated personal loans and mortgages. Hungary's fiscal austerity package may be a case of too little, too late in the event of renewed turbulence on global financial markets. Of some concern is also the fact that large net capital inflows are increasingly in the form of more volatile portfolio and so-called “other flows”, including short- External sector Deficits to widen in 2006
  • 39.
    Economies in transition:Regional overview 37 Country Forecast September 2006 www.eiu.com © The Economist IntelligenceUnit Limited 2006 term debt, rather than FDI. The region became the largest recipient of net non- FDI flows among all emerging-market regions in 2005. The important share of lending from advanced-economy banks to their subsidiaries in “other flows” may mitigate the risks to some extent, although any reduction in net financing would still require substantial external adjustment. External positions are strong in many countries in the CIS, especially fuel exporters. For the CIS as a whole, a current-account surplus of nearly 9% of GDP is projected for 2006 and about 7% of GDP in 2007. Large surpluses have permitted a rapid reduction in the overall level of external debt in oil exporters, especially by the public sector. In several countries (including Azerbaijan, Kazakhstan and Russia), however, the private sector has accumulated substantial foreign-currency liabilities in recent years. Although financial soundness indicators have remained broadly stable, there is some risk of financial instability in the face of a downturn or significant deterioration in external conditions. Current-account balance US$ bn % of GDP 2005 2006 2007 2005 2006 2007 East-central Europe -19.2 -21.4 -25.6 -3.1 -3.2 -3.3 Czech Republic -2.5 -4.0 -4.9 -2.0 -2.8 -2.9 Hungary -8.0 -8.3 -9.2 -7.3 -7.7 -7.2 Poland -4.3 -4.5 -6.7 -1.4 -1.4 -1.7 Slovakia -4.1 -3.8 -3.9 -8.6 -7.0 -6.0 Slovenia -0.4 -0.8 -0.8 -1.1 -2.3 -2.1 Balkans -19.1 -24.7 -27.6 -9.0 -10.1 -9.5 Albania -0.6 -0.7 -0.7 -7.0 -7.6 -7.0 Bosnia and Hercegovina -2.1 -1.9 -2.1 -20.8 -16.8 -14.8 Bulgaria -3.1 -4.1 -4.4 -11.7 -13.4 -12.0 Croatia -2.5 -3.1 -3.3 -6.5 -7.1 -6.5 Macedonia -0.1 -0.2 -0.3 -1.4 -2.9 -3.9 Montenegro -0.2 -0.3 -0.3 -12.2 -12.3 -11.6 Romania -8.4 -11.8 -13.7 -8.6 -10.3 -10.0 Serbia and Montenegro -2.1 -2.7 -2.9 -8.7 -9.8 -8.8 Baltics -5.2 -6.8 -7.3 -9.5 -10.7 -9.5 Estonia -1.4 -1.8 -1.9 -11.0 -11.9 -10.0 Latvia -2.0 -2.5 -2.7 -12.4 -13.6 -11.8 Lithuania -1.8 -2.4 -2.7 -7.0 -8.2 -7.7 CIS 86.3 108.5 102.1 8.8 8.7 7.1 Russia 83.6 106.0 100.8 10.9 10.9 8.8 Ukraine 2.5 -1.6 -5.7 3.1 -1.6 -5.6 Belarus 0.5 -0.3 -1.1 1.6 -1.0 -2.6 Moldova -0.3 -0.7 -0.5 -10.5 -21.2 -13.8 Armenia -0.2 -0.3 -0.3 -3.9 -4.3 -4.6 Azerbaijan 0.2 5.4 9.9 1.3 28.0 37.9 Georgia -0.8 -0.7 -0.7 -11.7 -10.0 -7.8 Kazakhstan -0.5 -0.2 -0.9 -0.9 -0.3 -1.0 Kyrgyz Republic -0.2 -0.3 -0.3 -8.3 -10.9 -9.0 Tajikistan 0.0 0.1 0.1 -0.8 3.8 3.3 Turkmenistan 0.3 0.3 0.3 4.0 4.0 3.0 Uzbekistan 1.3 0.8 0.5 10.3 6.3 3.6 Transition economies total 42.8 55.5 41.6 2.3 2.5 1.6
  • 40.
    38 Economies intransition: Regional overview Country Forecast September 2006 www.eiu.com © The Economist IntelligenceUnit Limited 2006 -25.0 -20.0 -15.0 -10.0 -5.0 0.0 Czech Republic Hungary Poland Slovakia Slovenia Albania Bosniaand Hercegovina Bulgaria Croatia Macedonia Montenegro Romania Serbia Estonia Latvia Lithuania 2005 2006 2007 Current account balance (% of GDP) Source: Economist Intelligence Unit. FDI inflows into the transition economies of eastern Europe reached a record total of US$74.9bn in 2005, a 13% increase on 2004. The total was for the first time approximately equal to inflows into Latin America and the Caribbean— traditionally the second most important emerging-market destination for FDI (after developing Asia). FDI flows into the transition region in 2004-05 grew strongly from relatively stagnant annual totals of US$30bn-35bn since 1999, although the worldwide slump in FDI earlier in this decade had largely bypassed the transition economies. The 2005 increase affected all transition subregions and most economies in the area. The growth was the result of relatively strong FDI flows to Russia; the completion or near-completion of large-scale privatisation sales in some countries; a recovery of FDI into the central European new EU member states after a sharp decline in 2003; and ongoing strong growth in FDI into previous laggards such as the Balkans. High commodity prices encouraged significant increases in FDI in the resource-rich countries of the region, notably Russia, Azerbaijan and Kazakhstan. For the first time there was a sizeable FDI inflow into Ukraine, although a significant part of the 2005 total was the result of one investment—the US$4.8bn sale of the steelmaker Kryvorizhstal to the Netherlands-based Mittal Steel. In 2006 FDI flows to the transition economies are expected to increase further from their 2005 peak. Direct investment flows to new EU member countries have reached a plateau, with investment horizons expanding to other parts of the region, and total FDI inflows into this group of countries in 2006, of about US$26bn, are likely to fall back towards the 2004 level. Investment into the Balkans—which has been rising strongly in recent years, mainly (although not entirely) owing to large inflows into Romania—is expected to grow strongly in 2006, to a projected US$17.7bn. Again privatisation will account for most of the total—in Romania, but also in other countries in the subregion (for example, the recent sale of the mobile operator Mobi 63 in Serbia will bring in almost US$2bn). FDI into the CIS is also expected to be somewhat higher in 2006 than in 2005, mainly because ofsignificant increases in FDI into Russia and Kazakhstan. Foreign direct investment
  • 41.
    Economies in transition:Regional overview 39 Country Forecast September 2006 www.eiu.com © The Economist IntelligenceUnit Limited 2006 Foreign direct investment inflows (US$ m) 2001 2002 2003 2004 2005 2006 East-central Europe 17,384 21,418 9,790 24,465 28,223 23,737 Czech Republic 5,640 8,496 2,022 4,977 10,974 7,500 Hungary 3,943 3,013 2,177 4,665 6,604 4,535 Poland 5,714 4,131 4,589 12,873 8,241 8,800 Slovakia 1,584 4,141 669 1,122 1,908 2,524 Slovenia 503 1,637 333 827 496 378 Balkans 4,240 4,304 8,667 12,431 14,768 17,725 Albania 207 135 178 341 264 275 Bosnia-Herzegovina 119 268 382 613 299 400 Bulgaria 813 905 2,097 2,560 2,614 2,400 Croatia 1,338 1,213 2,133 1,251 1,626 1,700 Macedonia 442 78 96 157 97 450 Montenegro – 87 182 74 487 400 Romania 1,157 1,144 2,239 6,470 7,900 8,900 Serbia 165 475 1,360 966 1,481 3,200 Baltics 1,120 1,251 1,390 2,444 4,640 2,750 Estonia 542 284 919 972 2,998 1,100 Latvia 132 254 292 699 632 700 Lithuania 446 713 179 773 1,009 950 CIS 7,199 9,176 15,963 26,726 27,317 34,375 Russia 2,749 3,461 7,959 15,445 14,183 21,500 Ukraine 792 693 1,424 1,715 7,808 4,200 Belarus 96 247 172 169 305 250 Moldova 53 133 78 91 225 180 Armenia 70 111 145 150 255 300 Azerbaijan 227 1,392 3,285 3,556 1,680 1,800 Georgia 110 167 339 499 448 550 Kazakhstan 2,835 2,590 2,092 4,113 1,738 4,800 Kyrgyz Republic 5 5 46 175 145 165 Tajikistan 10 36 30 272 30 80 Turkmenistan 170 276 226 354 300 300 Uzbekistan 83 65 167 187 200 250 New EU member states 18,505 22,669 11,180 26,909 32,863 26,487 Total transition economies 29,944 36,149 35,810 66,066 74,948 78,587 Sources: National statistics; IMF; Economist Intelligence Unit. FDI inflows into the eight EU member states that joined the EU in 2004 (the subregions of east-central Europe and the Baltic states) are expected to peak in 2007, as some outstanding privatisations are completed, and fall back afterwards to an annual average of about US$23bn in 2008-10. The danger of a diversion of cost-sensitive forms of FDI to even cheaper destinations looms larger than any promise of much more relocation to these countries of investment from the West. Investment will then be dominated by reinvested earnings and follow-on investment by existing FDI ventures. Despite widespread fears in some west European states of a diversion of investment (“dislocation”) to the poorer new members, the share of the new members in total EU25 FDI inflows in 2006-10 is forecast to be only 5%.
  • 42.
    40 Economies intransition: Regional overview Country Forecast September 2006 www.eiu.com © The Economist IntelligenceUnit Limited 2006 Contrary to widespread expectations, the EU’s enlargement will not lead to a new surge in FDI into the eight east European new EU members. These countries have already largely achieved the main benefits of integration for investment. Further positive changes to business environments associated with EU member- ship will be small. Some possible further improvement in risk perceptions and the impact on FDI of fully joining the single market will largely be offset by the effects of higher wages; the adoption of business-inhibiting aspects of EU rules; and the possibility ofa post-accession slowdown in reform momentum. Foreign direct investment stocks, end-2005 FDI stock (US$ bn) FDI stock per head (US$) FDI stock (% of GDP) East-central Europe 199.2 3,027 32.2 Czech Republic 55.6 5,433 44.7 Hungary 48.8 4,878 44.7 Poland 76.2 1,998 25.1 Slovakia 13.8 2,539 29.1 Slovenia 5.3 2,701 15.7 Balkans 62.0 1,169 29.1 Albania 1.7 545 20.8 Bosnia and Hercegovina 2.1 529 20.7 Bulgaria 12.3 1,601 46.0 Croatia 12.5 2,736 31.7 Macedonia 1.3 642 23.3 Montenegro 0.8 1,334 40.6 Romania 25.5 1,178 26.2 Serbia 5.9 788 24.4 Baltics 18.1 2,561 33.2 Estonia 8.1 5,992 61.5 Latvia 4.5 1,950 28.4 Lithuania 5.6 1,624 21.7 CIS 127.8 457 13.0 Russia 64.8 452 8.5 Ukraine 16.2 347 19.6 Belarus 2.3 237 7.8 Moldova 1.0 256 34.8 Armenia 1.3 432 26.6 Azerbaijan 14.0 1,654 111.1 Georgia 2.3 523 36.6 Kazakhstan 20.8 1,367 37.4 Kyrgyz Republic 0.8 156 32.9 Tajikistan 0.5 77 22.9 Turkmenistan 2.3 352 35.7 Uzbekistan 1.4 53 11.2 Eastern Europe 261.8 2,203 31.5 Eastern Europe & the former Soviet Union 410.7 1,012 22.0 Sources: National statistics; IMF; Economist Intelligence Unit. The share of the eight new EU members from eastern Europe in the east European regional total is expected to decline to only one-third, compared with the share of almost 50% in 2001-05, and higher before that. Economies in the Balkans and the CIS, such as Ukraine and, especially, Russia, will increase their share of regional FDI. No new FDI surge to new EU members
  • 43.
    Economies in transition:Regional overview 41 Country Forecast September 2006 www.eiu.com © The Economist IntelligenceUnit Limited 2006 Russia, a notable FDI laggard so far (see box: FDI into Russia), is expected to become the main destination country in the region over the medium term (although as a share of GDP and in per-capita terms inflows will still remain relatively modest). Implementation of reforms will remain a serious problem, but Russia is nevertheless expected to record an improvement in its business environment in the medium term. Membership of the World Trade Organisation (WTO), expected in the next couple of years, will have a positive impact. Annual average FDI inflows into Russia are projected at about US$22bn during the next five years. Although this will represent a notable improvement on Russia’s past performance, it is still short of the country’s potential. Even by 2010, Russia’s total stock of inward FDI (projected at US$175bn) will amount to less than 13% of GDP. Other CIS energy producers will continue to attract significant FDI over the medium term. The investment plans of a group of large and well-established investors in the oil and gas sector mean steady inflows into Kazakhstan of some US$5bn per year in 2006-10. In Azerbaijan the completion of several major hydrocarbons projects in 2005-06 means that FDI inflows in the coming years will be lower than in the recent past—annual FDI inflows into Azerbaijan in 2001-05 averaged over 25% of GDP (one of the highest ratios in the world). Investment in non-oil sectors will continue to be hindered by a poor overall business environment. FDI inflows into eastern Europe 2003 2004 2005 2006 2007 2008 2009 2010 Eastern Europe total Inflows (US$ bn) 35.8 66.1 74.9 78.6 75.2 68.9 70.9 73.4 % of world total 5.4 8.2 7.8 6.7 6.2 5.4 5.3 5.2 Rate of growth (%) -1.0 85.7 13.3 4.9 -3.1 -8.4 2.9 3.6 % of GDP 3.0 4.3 4.1 3.5 3.0 2.5 2.4 2.3 East-central Europe Inflows (US$ bn) 9.8 24.5 28.2 23.7 23.9 20.4 20.0 20.4 % of regional total 27.5 37.0 37.7 30.1 31.8 29.5 28.3 27.7 Rate of growth (%) -54.3 149.9 15.1 -16.0 2.9 -14.9 -1.6 1.7 % of GDP 2.2 4.6 4.6 3.4 3.0 2.4 2.3 2.2 Balkans Inflows (US$ bn) 8.7 12.4 14.8 17.7 15.2 11.6 10.9 11.1 % of regional total 24.3 18.7 19.2 22.6 20.2 16.9 15.4 15.1 Rate of growth (%) 102.3 45.6 19.4 19.6 -13.3 -23.5 -5.9 1.1 % of GDP 5.7 6.8 6.9 7.1 5.3 3.7 3.2 2.9 Baltics Inflows (US$ bn) 1.4 2.4 4.6 2.8 3.2 2.7 3.1 3.1 % of regional total 3.9 3.8 6.1 3.4 4.3 3.9 4.4 4.2 Rate of growth (%) 81.3 71.4 91.7 -40.2 20.8 -15.5 15.7 -0.8 % of GDP 3.6 5.3 8.3 4.2 4.2 3.3 3.4 3.1 CIS Inflows (US$ bn) 15.9 26.7 27.3 34.4 32.9 34.2 36.8 38.9 % of regional total 44.8 40.5 36.4 44.0 43.7 49.7 51.9 53.0 Rate of growth (%) 73.7 67.9 2.2 26.0 -4.4 4.1 7.5 5.7 % of GDP 2.8 2.7 2.8 2.9 2.4 2.3 2.2 2.1 Source: Economist Intelligence Unit.
  • 44.
    42 Economies intransition: Regional overview Country Forecast September 2006 www.eiu.com © The Economist IntelligenceUnit Limited 2006 FDI into Russia Foreign direct investment (FDI) inflows into Russia averaged a paltry US$3bn per year in 1998-2002, but then began to pick up markedly. There have been a number of large-scale FDI deals in the oil and gas sector in recent years, and not all of these were included in official FDI data (the 2003 deal between TNK and the UK’s BP, worth more than US$8bn, was conducted through offshore vehicles). The lingering fallout from the Yukos affair and growing state pressure on the private sector have hit the confidence of many Russian domestic investors. Foreign investors, by contrast, appear to be undaunted. According to data from the Russian Central Bank (RCB), FDI inflows averaged some US$15bn annually in 2004-05, compared with US$8bn in 2003 and negligible annual totals before that. The upward trend has continued into 2006. According to RCB data, in the first half of 2006 FDI inflows reached US$14.1bn, almost equal to the total for 2005 as a whole. Foreign investor confidence The main sectors of investment in 2005 in Russia were manufacturing (including large amounts flowing into the production of automobiles) and the energy sector, which accounted for 45% and 32%, respectively, of total inflows. Other sectors that are proving attractive include banking, trade and retail and consumer goods. It may seem strange that increased interest from foreign investors has coincided with some signs of deterioration in Russia’s investment climate. These include the campaign against the Yukos oil company; a slowdown in structural reform; a trend towards increased state control of the economy; and tension in political relations with the West. In the past, Russia’s attractions of market size and natural resources had been more than offset by serious deficiencies in the business environment. Several factors explain the narrowing of the gap between actual and potential performance. Russia has built up a track-record of several years of stability and robust growth. There has also been a delayed reaction to the improvement in Russia’s business environment in the early part of this decade. The award of investment-grade ratings by all three international rating agencies has also provided a boost. Some long-standing deterrents to foreign investment have eased, such as macroeconomic and political instability and high and unpredictable taxes. Many investors are attracted by strong market opportunities and remain—at least outside the energy sector—unaffected by Russia’s increased statism and the imposition of restrictions on foreign involvement. Surveys show that, despite numerous complaints about the business environment, the majority of those doing business in Russia are satisfied with their success and plan to expand their investments in the country. The significant increase in reinvested earnings, and their very high share of total FDI inflows in 2003-05, is another strong sign of growing confidence. Despite the pick-up in FDI inflows, FDI remains below potential, given the country’s obvious attractions, which include one-third of the world’s gas reserves, around 8% of proven oil reserves, a skilled and low-cost workforce and a large consumer goods market. The recovery in FDI has been from a very low base and Russia’s annual inflows are dwarfed by the amounts that go into China. Even after the post-2003 upsurge, cumulative FDI inflows into Russia in 1990-2005 amounted to some US$65bn, equal to only 8.5% of GDP. This was the second-lowest ratio (marginally ahead of Belarus) among all transition economies, and one-quarter of the average penetration ratio in east-central Europe. Russia’s share in the transition region’s population, GDP and exports is about one-third; its share in the region’s stock of FDI is below 16%. Restrictions on FDI An underdeveloped infrastructure and corruption remain key impediments to FDI, as does the unpredictability with which regulations are often applied. Investors in the natural resource sector, in particular, are facing considerable uncertainty as Russia defines which assets it considers “strategic” and thus off-limits to foreign majority control. This clarification has been delayed and at the moment the policy seems confused and uncertain. There is little doubt, however, that the natural resource sector will be subject to significant limitations on foreign participation. The government insists that foreigners cannot hold more than 49% of any venture engaged in developing a “strategic” deposit. Currently any field with reserves of more than 150m tonnes of oil or 1trn cu metres of gas is defined as strategic. The Ministry of Natural Resources is now considering a proposal to lower the thresholds to 50m-100m tonnes for oil and 500bn cu metres for gas. There have also been ongoing rumours that the Russian government may seek to renegotiate with foreign investors the production-sharing agreements (PSAs) from the 1990s that govern the development of the large-scale Sakhalin projects.
  • 45.
    Economies in transition:Regional overview 43 Country Forecast September 2006 www.eiu.com © The Economist IntelligenceUnit Limited 2006 The outlook Despite the continuing problems of the business environment and the regulatory uncertainty affecting the natural resource sector, the medium-term outlook for FDI into Russia is good. Macroeconomic fundamentals will remain strong, especially as oil prices are expected to remain at high levels. Market opportunities will be good, despite some slowdown in growth. Accession to the World Trade Organisation (WTO), which is expected in 2007 or 2008, should increase Russia’s attractiveness, as will the mid-2006 liberalisation of the capital account. Russia’s consumer and retail boom is likely to sustain a wave of joint ventures with foreign investors. More automotive investments are in the pipeline. Survey evidence also suggests that Russia will be one of the world’s leading destinations for FDI over the next few years. According to AT Kearney’s most recent annual survey of investors, Russia was in 2005 seen as the sixth most attractive FDI destination in the world (up from 11th place in 2004). A survey of multinational companies undertaken by the UN Conference on Trade and Development (UNCTAD) in 2005 placed Russia as the fourth most attractive location for FDI (behind only China, India and the US) for 2005-08. A recent Economist Intelligence Unit survey of 400 senior executives at multinationals found that Russia was seen as the sixth most attractive global destination for crossborder mergers and acquisitions (M&As) over the next three years. The share of the energy sector in FDI into Russia may fall in the coming years, given the restrictions on foreign involvement in this sector, uncertainty about the sanctity of previous agreements and the heavier tax burden imposed on oil producers in recent years. However, the Western oil majors will hardly shun Russia altogether. Russia is one of the few places that offers large-scale reserves and its energy sector is one of the few in the world not closed off to foreigners. Risks in other oil- producing regions have increased, and Russia is not engaging in Latin American-type expropriation. Although the Russian government will not allow one of Russia’s major oil companies to fall into foreign hands, it is likely to welcome minority participation of foreign companies, especially in difficult exploration projects. Projected annual average FDI inflows into Russia of US$22bn in 2006-10 represent a significant amount, but will still be a fairly modest as a proportion of GDP (at below 2% per year). In our forecasting model, FDI inflows are dependent on a country’s GDP; our index of the quality of the business environment; US dollar wages; a measure of natural resource endowments, a privatisation index (measuring the availability of assets for sale and the readiness to sell to foreigners); and the share of the FDI stock in GDP at the start of the period (a measure of potential follow-on investment). The model can also be used to estimate the extent to which FDI inflows into Russia over the next five years will still fall below potential, despite the expected pick-up. The two crucial variables are the quality of the business environment and openness to asset sales to foreigners, with a similar impact on overall FDI flows. A more open policy on sales (with the privatisation index equal to the average for the transition region as a whole) would lift average annual inflows by almost 50%, to a projected US$32bn. Similarly, if Russia’s business environment were of the average quality of those in east-central Europe, annual FDI inflows into the country would be almost US$32bn. There are risks even to the relatively benign baseline FDI outlook. Although a sharp and sustained plunge in oil prices is unlikely, Russia remains highly vulnerable to that risk. Much of manufacturing will be adversely affected by real rouble appreciation. Many negative features of the business environment will persist, including an inefficient bureaucracy and judicial system. There are also some doubts over political stability after 2008, when the Russian president, Vladimir Putin, is due to step down. The countries that entered the EU in May 2004 are obliged to join European economic and monetary union (EMU)—there are no opt-out clauses, although the example of Sweden has shown that the commitment to join the euro zone does not have a deadline. To qualify for entry to the euro area, an EU member must meet the Maastricht criteria on government debt, fiscal deficits, inflation, long-term interest rates and exchange-rate stability (see box: Economic and monetary union). The exchange-rate criterion involves membership of the EU's exchange-rate mechanism (ERM2) for at least two years. Most of the new EU member states from central and eastern Europe are finding it difficult to meet all the Maastricht criteria for entry to the euro zone. Although Slovenia will join EMU next year, Lithuania's application to join in 2007 was EMU membership
  • 46.
    44 Economies intransition: Regional overview Country Forecast September 2006 www.eiu.com © The Economist IntelligenceUnit Limited 2006 turned down after the European Central Bank (ECB) and the European Commission ruled in May 2006 that it just failed to meet the inflation criterion. Estonia's government was originally hoping to join in 2007, but its high inflation rate has forced it to postpone its planned entry to 2008—and the government acknowledged in August that even this date was looking unattainable. Euro adoption is still a distant prospect for most of the Visegrad countries—Hungary, the Czech Republic, Poland and Slovakia. Only the latter appears on target to adopt the single European currency before the end of this decade. Both the ECB and many existing members of EMU appear to be happy to postpone the expansion of the euro zone, and, as the recent treatment of Lithuania’s application has shown, are insisting on a very strict interpretation of the Maastricht criteria. Until last year the three Baltic states had assumed that they would face little difficulty in joining the euro zone quickly. All three enjoy strong fiscal positions with low levels of public debt, and their currencies are closely linked to the euro. The Baltic countries' currency arrangements mean that monetary policy is already in effect set by the ECB, so that long-term interest rates are heavily influenced by those in the euro zone. As a result, Estonia, Latvia and Lithuania face few problems in meeting the Maastricht criteria on currency stability, long- term interest rates, budget deficits and the level of government debt. However, meeting the final Maastricht criterion—that inflation over the past 12 months should be at most 1.5 percentage points higher than the average in the three EU member states with the lowest inflation—is proving a much more difficult task. On the latest figures, which cover the 12 months to July 2006, the highest level of inflation consistent with the inflation criterion is 2.8%. Inflation in Lithuania was 3.2% over this period, in Estonia it was 4.4% and in Latvia it was 7%. Lithuania has been particularly hard done by, as its application to join EMU in 2007 was assessed on the basis of inflation in the 12 months to March 2006 (when it failed to meet the inflation criterion by less than 0.1 percentage point), rather in the 12 months to April, when it met the criterion. The ECB's and the European Commission's negative assessments of Lithuania's application to join in 2007 were confirmed at the EU summit in June 2006, despite protests from several new member states. These complaints focused on the way that the inflation criterion is based on the three countries in the EU (not just the euro zone) with the lowest inflation; in fact, the inflation criterion in the past few months is based on inflation rates in Finland, Sweden and Poland—two of which are not members of the euro zone. The European Commission has said that it will review this issue, but a significant relaxation of the inflation criterion looks very unlikely. Inflation in Lithuania is now rising, so that it is not likely to meet the inflation criterion next year. As a result, Lithuania is now unlikely to join EMU before 2009 or 2010. Latvia had hoped to join EMU in January 2008, but may not be able to join before 2009 at the earliest. To qualify for EMU membership in 2008, the 12-month average inflation rate would need to fall below the Maastricht ceiling by the time that Latvia's application is assessed in 2007. With the Latvian lat pegged to the euro and a high proportion of foreign-currency Fast-growing Baltic states find inflation a problem
  • 47.
    Economies in transition:Regional overview 45 Country Forecast September 2006 www.eiu.com © The Economist IntelligenceUnit Limited 2006 lending in the banking sector, monetary policy is in effect powerless in moderating the demand boom. A tightening of the fiscal stance will not be forthcoming in 2006, owing to the general election scheduled for October. Moreover, excise tax increases that had been postponed beyond 2007 in order to help the inflation compliance effort could now increase inflation in the run- up to 2009, potentially delaying EMU membership until 2010. Estonia's hopes of joining the euro zone in January 2008 are facing similar problems. Inflation in Estonia remains high—it was 5% on its national measure in August 2006—and the latest official economic forecast predicts only a slight fall in inflation next year. The government has informally accepted that EMU entry in 2008 is now unlikely, and may reverse its previous decision to postpone the excise duty increases that had been due to be implemented in 2007. Estonia now looks unlikely to enter EMU until 2010. There are good economic grounds for relaxing the inflation criterion for countries like the three Baltic states. Moreover, the ability of these economies to grow rapidly, while already subject to most of the constraints of euro zone membership, does much more to demonstrate that they are ready for EMU than does compliance with the Maastricht criteria. Even the ECB accepts that inflation is likely to be higher in fast-growing economies with fixed exchange rates against the euro (the "Balassa-Samuelson effect"), but it has steadfastly refused to relax or modify the Maastricht inflation criterion on this basis. This strict approach, which will result in a slower expansion of the euro zone than previously expected, may be welcome to the ECB and some of the euro zone's existing members. Expanding the euro zone to include a new set of small but rapidly growing economies will complicate the ECB's task of setting monetary policy for the whole zone. Several existing EMU members may also prefer to put off the increased competition within the single currency area that would be brought on by the expansion of the euro zone to include several fast-growing economies from central and eastern Europe. Slovenia is in a more comfortable position, and successfully met the criteria for joining the euro zone when its application was assessed in May 2006. Economic growth is significantly slower than in the Baltic states, reducing the significance of the Balassa-Samuelson effect. This helped Slovenia to meet the inflation criterion and Slovenia will adopt the euro as its national currency on January 1st 2007. Among the other east European new EU members, only Slovakia had been expected to join EMU before the end of the decade. Slovakia's decision in November 2005 to follow the Baltic states and Slovenia and enter ERM2 was ahead of the previously announced schedule and surprised most observers. Slovakia hopes to adopt the euro in 2009 and thus had planned to join ERM2 in mid-2006. Slovakia should have little difficulty in meeting the criteria on public debt, long-term interest rates and inflation. However, although its fiscal position is stronger than its central European neighbours, the new Slovak government is less committed to fiscal discipline than its predecessor, and this may make it difficult to keep the general government deficit below 3% of GDP in 2007—a necessary condition for EMU entry in 2009. Slovakia's new prime minister, Robert Fico, recently reiterated to the European Commission Slovakia's The ECB refuses to make any concessions Slovenia is the first new member state to join EMU
  • 48.
    46 Economies intransition: Regional overview Country Forecast September 2006 www.eiu.com © The Economist IntelligenceUnit Limited 2006 commitment to euro adoption in 2009—a policy that appears at variance with Mr Fico's plans to reverse, in part, the pro-business reforms of the previous government and expand the welfare state. For the other three central European countries—the Czech Republic, Hungary and Poland—the Maastricht fiscal criterion is likely to be an insurmountable hurdle for the next few years. Political backing for fiscal reforms remains weak in all three. The Czech Republic is still officially targeting euro adoption in 2010, but the government's commitment to this target is weakening; Hungary now has an official target of 2011. Poland has not even set a target for ERM2 entry. These countries—many of them ruled by fragile governments—will face difficult trade-offs between satisfying the Maastricht criteria and maintaining growth in the short and medium term. In the next few years great pressure on spending in all these countries will also come from requirements related to the acquis communautaire (the body of EU law), as well as obligations stemming from NATO membership. In Poland the main ruling party, Law and Justice (PiS), is a conservative grouping that shows little enthusiasm for the euro. The PiS insists that euro adoption will not happen during the term of the current government. In practice, Poland's approach to adopting the euro is not likely to be resolved until after the next parliamentary election, which may not take place until 2009. In the Czech Republic, the uncertain political situation following the June parliamentary election will make it difficult to bring down the fiscal deficit quickly. Indeed, the current prime minister, Mirek Topolanek, recently described as unrealistic the previous government's plan to join EMU in 2010. In Hungary the incumbent centre-left government was re-elected in the April 2006 parliamentary election, but the task facing the authorities is even more difficult. The government will need to bring down the budget deficit in order to maintain confidence in the forint, but the deficit is so high—we expect a deficit of 9% of GDP in 2006—that Hungary is unlikely to be able to meet the Maastricht budget deficit criterion before the end of the decade. The delay in Czech, Hungarian and Polish EMU entry will be welcome among some euro zone members. Because these countries pose a far greater competitive threat to the euro zone than Slovenia and the Baltic states, their accession to EMU is more controversial. Advocates of early membership argue that as small, open economies, already highly integrated with the EU through trade flows, the new member states will benefit from the stability associated with a single currency. Overall, adopting the euro is meant to boost growth through lower interest rates, higher asset values and the elimination of exchange-rate risk. However, others argue that the euro was designed for mature economies, and can be inappropriate for less- developed countries that have yet to complete far-reaching structural and institutional changes. In this respect the delay in joining EMU may be justified for the central European economies. If they tried to satisfy the conditions for adopting the How serious are the delays? Waning enthusiasm for the euro in central Europe
  • 49.
    Economies in transition:Regional overview 47 Country Forecast September 2006 www.eiu.com © The Economist IntelligenceUnit Limited 2006 euro too quickly, the candidates could damage their economies. In particular, getting inflation down to Maastricht levels should not be the priority—a view that is supported by economic theory. As discussed, less-developed, rapidly growing economies will, for structural reasons, tend to have higher inflation rates than richer, slower-growing economies. A tighter monetary policy aimed at limiting (economically justified) price rises can also stifle productivity increases and economic growth. In addition to this, there is the risk of locking in to the euro at a potentially uncompetitive rate. Economic and monetary union The Maastricht criteria The 1992 Treaty on European Union (the Maastricht treaty), which came into force in November 1993, established a set of criteria for participation in the third stage of European economic and monetary union (EMU). Countries need to have: • a rate of inflation no more than 1.5 percentage points above the average of the three best-performing EU members; • long-term interest rates not exceeding the average rates of these three low-inflation states by more than 2 percentage points for the preceding 12 months; • exchange rates that have fluctuated within the margins of the exchange-rate mechanism (ERM2) for at least two years; • a general government debt/GDP ratio no higher than 60%, although a higher ratio may be permissible if it is "sufficiently diminishing"; and • a general government deficit not exceeding 3% of GDP, although a small and temporary excess can be permitted in certain circumstances. The debt criterion The debt criterion appears to be the least significant of the five. It was not binding when the initial group of countries joined EMU—debt in both Italy and Belgium was far above the 60% level when they were invited to join EMU and remains so now. In any case, only Hungary among the east European new member states has a public debt/GDP ratio near the 60% limit. There are some measurement issues in that the ratio is to be measured using the European System of Accounts (ESA 95) definitions; the resulting figure may differ significantly from national data. The inflation criterion Again, there are some measurement issues in that this criterion is assessed using the HICP (harmonised index of consumer prices) figures—which ensures that elements such as housing are treated in similar ways in all the countries. Eurostat, the EU's statistical office, publishes HICP data for the new member states. More problematically, the inflation criterion is based on the three EU member states with the lowest inflation, not the three euro zone members with the lowest inflation. This means that very low inflation in countries which are not even members of the euro zone can make it more difficult to meet the inflation criterion—the three lowest-inflation countries in the 12 months to July 2006 were Finland, Sweden and Poland (the latter two are not members of the euro zone). Several of the fast-growing new member states are finding it difficult to meet the inflation criterion. Thus Lithuania failed the inflation criterion by 0.1 percentage points when its application to join EMU in 2007 was assessed by the European Commission and the European Central Bank (ECB) in May 2006, but this was enough for the Commission to recommend that its application be rejected. Rapidly growing economies tend to have higher inflation rates than slower- growing countries (the "Balassa-Samuelson effect"), and this, together with the impact of high oil prices, is making it more difficult for them to converge with the lowest-inflation members of the EU. Although members of the euro zone with the most rapidly growing economies—Ireland being a striking example—have only managed to meet the inflation criterion for a relatively short time, the Commission and the ECB have been adamant that the inflation criterion will not be relaxed.
  • 50.
    48 Economies intransition: Regional overview Country Forecast September 2006 www.eiu.com © The Economist IntelligenceUnit Limited 2006 The interest rate criterion The problem with the interest rate criterion is that, to a large extent, a country's level of long-term interest rates reflects market beliefs about whether the country will successfully join EMU or not. If the markets believe that a country will be admitted to EMU in a few years' time, short-term interest rates will be expected to be the same as in the euro zone in the future, and, through the mechanism of the "convergence trade", this will push long-term interest rates towards those in the euro zone. The interest rate criterion therefore may not fulfil its intended role of signalling the market's beliefs about whether low inflation in the prospective EMU member can be sustained. More practically, long-term debt markets are either non-existent or are very illiquid in most of the new members, although this may evolve in the next few years. The government deficit criterion This will be the most difficult criterion for several countries (including Poland, Hungary and the Czech Republic) to meet, and it is likely to delay their entry to EMU for several years. Persistent high fiscal deficits will need to be reduced significantly in order to meet the deficit criterion, and, with no fixed target date for EMU entry, the disciplinary effect of the deficit criterion is likely to be much weaker than it was for the existing euro zone members in the late 1990s. As with the assessment of the debt criterion, the Eurostat ESA 95 definition of the general government deficit will be used in assessing the deficit criterion. The ESA 95 figures often differ significantly both from national measures and from figures using the IMF's government finance statistics (GFS) methodology. There is also uncertainty about how the effects of pension reform should be treated in the Eurostat methodology, with most countries that have carried out such reforms continuing to count the new pension funds as part of the government sector. Eurostat has ruled that this will not be permitted from 2007, but the reform of the EU's Stability and Growth Pact agreed in March 2005 has been interpreted by many as allowing those countries that have recently set up funded public pension systems (primarily Poland, Slovakia and Hungary) to deduct a proportion of the costs of the changes from their fiscal deficits for a transitional period. However, with Poland and Hungary likely to delay their entry to EMU to 2010 or beyond, neither country is likely to be able to benefit significantly from these transitional arrangements, making it still more difficult for them to meet the deficit criterion. The exchange-rate criterion The exchange-rate criterion is only really relevant for those countries with a flexible exchange rate. Those countries with a currency board arrangement should meet the criterion automatically, although there is a theoretical possibility that the central rates for national currencies against the euro could be adjusted before EMU entry. In practice, the very small size of the countries with a currency board arrangement makes this improbable, as existing EMU members are unlikely to feel that their competitiveness is being threatened. For the other countries, the exchange-rate criterion has already attracted a lot of debate, with some specialists viewing it as unnecessary or even dangerous, and others, especially from the European institutions, calling for the criterion to be interpreted in a very strict way. Many economists have criticised the "halfway house" of membership of ERM2 as being potentially destabilising. They cite the collapse of the "old" ERM in the early 1990s as an example of the dangers of fixed-but-adjustable systems such as ERM2 in a world of free capital movements. Instead, they suggest that it would be better if the exchange-rate criterion were abandoned and countries were allowed to leave their currencies to float freely before entering EMU. Although it had been assumed that keeping a national currency in the wide fluctuation bands (±15%) of ERM2 would be enough to meet the exchange-rate criterion, a series of statements from the European Commission have suggested that the Commission intends to take a more restrictive view of currency stability—with exchange rates allowed to vary only relative to the narrow (±2.25%) fluctuation bands of the "old" ERM. This idea has proved controversial in the larger new EU member countries that currently have freely floating currencies, as keeping to the narrow fluctuation bands, without any commitment from the European Central Bank (ECB) to defend them, would be far more risky for them than simple membership of ERM2. The ECB has not gone so far as to suggest an assessment based on the previous narrow bands, but it has said that "the assessment of the exchange rate against the euro will focus on the exchange rate being close to the central rate". This would leave the ECB significant discretion in deciding whether a country had met the exchange-rate criterion— mere membership of ERM2 for two years looks unlikely to be sufficient.
  • 51.
    Economies in transition:Regional overview 49 Country Forecast September 2006 www.eiu.com © The Economist IntelligenceUnit Limited 2006 The timetable for entry to EMU In contrast to the relaxed attitude towards the Maastricht criteria shown to several countries, notably Italy and Belgium when the euro zone was first created, the European Commission and the ECB are taking a very strict approach to the new EU member states' applications to join the euro zone. Of the eight east European states that joined the EU in May 2004, only Slovenia has managed to join the euro zone quickly—it will replace the tolar with the euro on January 1st 2007. Of the other countries, four—Estonia, Lithuania, Latvia and Slovakia—have joined ERM2 and hope to join EMU soon, although none look likely to join in 2008, and only Slovakia now looks to have a real prospect of joining in 2009. By contrast, the three largest economies—the Czech Republic, Hungary and Poland—are struggling with high budget deficits and do not expect to bring these deficits below 3% of GDP for several years. Correspondingly, the political will to join EMU is waning or suspect in all three. These countries are also reluctant to join ERM2 until they are much closer to meeting the other criteria for adopting the euro. None of the three is expected to join EMU before the end of this decade. Bulgaria and Romania now look virtually certain to join the EU in 2007. Both Romania and Bulgaria currently have high inflation and fiscal policy is being relaxed this year in Romania. Bulgaria could still join EMU in 2010 but Romania looks unlikely to join EMU this decade. New members' and candidates' performance against the Maastricht criteria, 2005-06 (%) HICP inflation (average) Long-term interest rates Government balance/GDP Government debt/GDP Reference value 2.8 6.0 -3.0 60.0 Bulgaria 7.3 4.6a 3.1 29.9 Czech Republic 2.3 3.6 -2.6 30.5 Estonia 4.4 4.0 1.6 4.8 Hungary 2.9 6.7 -6.1 58.4 Latvia 7.0 3.8 0.2 11.9 Lithuania 3.2 3.8 -0.5 18.7 Poland 1.3 5.1 -2.5 42.5 Romania 8.0 6.5a -0.4 15.2 Slovakia 3.9 3.9 -2.9 34.5 Slovenia 2.6 3.7 -1.8 29.1 Note. HICP inflation rates are actuals from Eurostat for 12 months to July 2006; interest rates are actuals from the European Central Bank for 12 months to July 2006 (12 months to June 2006 for Estonia). Fiscal data are European Commission figures for 2005, with open pension funds included as apart of the government sector. a Figures from national sources. Sources: Economist Intelligence Unit; European Commission; Eurostat; European Central Bank. The medium- and longer-term outlook for the region, on our baseline assumptions, is favourable, although growth rates will tend to decelerate over time. FDI inflows are likely to remain fairly strong, and productivity growth should continue to outstrip that in western Europe. Average real GDP growth of at least 4% per year should be sustainable over the next few years in most east European states. However, higher rates of employment and, in some countries, investment will be needed to underpin rapid convergence. Policies that would support further competition and outward orientation, including deregulation and attraction of new FDI inflows, will play a key role in sustaining rapid productivity growth. Measures to enhance the amount and quality of domestic research and development (R&D), and education reforms, will also be important. So will the restructuring of remaining "strategic" or "socially important" sectors to facilitate the flow of resources towards more productive activities. The long-term outlook
  • 52.
    50 Economies intransition: Regional overview Country Forecast September 2006 www.eiu.com © The Economist IntelligenceUnit Limited 2006 For the new EU member states, membership of the EU offers a possibility—but by no means a guarantee—of stimulating per-capita GDP growth. Given the initial gap in development levels, and various hindrances to growth—even under a benign overall EU scenario yielding respectable long-term growth rates—we estimate that it would take the new EU member states between three and six decades to catch up with average GDP per head in the EU15. The projected average annual long-term growth rates in GDP per head are in the 3-4% range, and it is assumed that the long-term EU15 growth rate is at its long-term trend rate of 2%. This is probably a best-case scenario. The assumptions underpinning the benign scenario are fairly demanding—both in terms of policies in the new member states and in terms of the evolution of the EU as a whole. Most of the expected growth in eastern Europe originates from relatively low starting income levels (reflecting considerable scope for catch-up, or the "advantages of backwardness"); the expectation that satisfactory macro- economic environments will persist; and a high degree of international trade integration. There are many reasons why projected long-term growth, even under the benign scenario, is not higher, including: • the relatively modest quality of these countries' institutions, even under a trajectory of continued improvement; • the still deficient regulatory environment (aside from any future issues related to the countries' implementation of the EU body of law); and • unfavourable demographics—very low or negative projected rates of growth of the working-age population—and an unfavourable relationship between overall population growth and that of the working-age population. The outlook for EU reforms, arguably also a key requirement for buoyant economic growth in the new members over the medium term—now looks poor, as the EU's heavyweights, chiefly the UK and France, battle over the future direction of the EU. It seems even less likely now than before that any of the big euro zone economic laggards will initiate structural reforms to boost growth, and the prospects for pushing on with the EU's Lisbon Agenda of reform now look even bleaker. Since the mid-1990s output in the Baltic countries has expanded at an annual average rate of about 6%, and in the most recent years the pace has been even faster. The three "Baltic tigers" have outperformed the new EU member countries of east-central Europe by a wide margin. However, such rapid growth is probably unsustainable over the medium and long term, since the impressive recent performance reflects a combination of a very low starting base, prudent macroeconomic policies and rapid progress (in terms of catching up with east- central European economies) with reforms. Strong growth in Russia and other nearby CIS countries has also been a factor. Moreover, the Baltic states lag behind the east-central European average in terms of indicators of human capital and the "knowledge economy". The recent rapid credit growth and large current-account deficits in the Baltic states are not sustainable over the medium term, suggesting that some deceleration of domestic demand growth will follow. The Baltic states are also EU enlargement andcatch-up growth
  • 53.
    Economies in transition:Regional overview 51 Country Forecast September 2006 www.eiu.com © The Economist IntelligenceUnit Limited 2006 set to experience a significant decline in working-age population over the next 10-20 years. Finally, international experience also suggests that it will be difficult to sustain recent high productivity increases over a long period of time. Long-term growth and catch-up GDP per head at PPP, 2005 (EU15=100) Long-term annual growth in GDP per head (%) Catch-up time with EU15 income per head (years) Czech Republic 62.8 3.3 37 Estonia 54.8 4.0 31 Hungary 56.9 3.6 37 Poland 43.5 3.5 58 Latvia 43.4 4.2 40 Lithuania 45.9 4.2 37 Slovakia 53.4 3.8 36 Slovenia 77.8 2.8 34 Albania 18.3 4.0 88 Bosnia and Hercegovina 20.6 3.5 109 Bulgaria 30.7 3.8 68 Croatia 40.9 3.4 66 Macedonia 23.7 3.7 88 Romania 29.4 3.8 70 Serbia 21.8 4.2 72 EU15 100.0 2.0 – Source: Economist Intelligence Unit. The longer-term prospects for the CIS are mixed. Although structural reforms are being pursued in many CIS countries, implementation is not as advanced or as widespread as in east-central Europe. The longer-term outlook is marred by institutional, demographic and infrastructural constraints. For the energy exporters, the boom in hydrocarbons prices has provided an impetus to growth and contributed to an increase in investment outlays. However, given the volatility of energy prices, these economies will struggle to sustain high growth rates in the longer term until diversification from energy becomes much more broad-based. The present strong growth rates in the oil exporters are masking deep-seated structural imbalances that have resulted in a "dual economy", which could stymie long-term growth. Prosperous natural resource sectors— where wages are high and output is growing at double-digit rates—co-exist with weak manufacturing and agricultural sectors, which are crowded out by a strengthening exchange rate (symptoms of the so-called Dutch disease). Energy has undoubtedly been the main driver of Russia's growth since the 1998 financial crisis (annual average real GDP growth was 6.7% in 1999-2005). Natural resource sectors have directly accounted for roughly two-thirds of the growth of industrial production since 2000, even though fuels production growth fell sharply in 2005. The oil sector alone accounted for over 40%. The natural resource sectors contributed directly more than one-third of Russian GDP growth, and the oil industry alone for close to one-quarter. This refers only to the direct contribution to GDP growth: taking into account the indirect effects on personal incomes and domestic demand pushes up further the total contribution. The empirical link between oil prices and Russia's output has been very strong for most of the past decade, although GDP growth slowed in Mixed outlook for the CIS
  • 54.
    52 Economies intransition: Regional overview Country Forecast September 2006 www.eiu.com © The Economist IntelligenceUnit Limited 2006 2005 despite record high oil prices. High price levels have stimulated energy output, facilitated improved fiscal performance and spurred domestic demand growth. The removal of any possible balance-of-payments constraints and the facilitation of sharp reductions in external debt have also boosted growth. However, high oil prices are not expected to persist over the long term, and the period of recovery growth for the economy as a whole (Russia's real GDP is still below its pre-transition level) is drawing to a close. There are questions about the longer-term sustainability of Russian growth—many of these are associated with the economy's natural resource dependence. At the same time, the increased statism in the economy and erosion in security of property rights over the past two years has in part offset the improvements in the business environment in the early part of the decade. Other factors also do not augur well for Russia's longer-term growth prospects, including infrastructure constraints and eroding health and education endowments. The vastness of Russia (about 17m sq km) is another disadvantage, since it means extremely long distances between population, natural resources and business centres. Russia faces a severe demographic challenge resulting from low birth rates, poor medical care and a potentially explosive AIDS situation. Its working-age population is set to shrink dramatically. Finally, the real appreciation of the rouble in recent years threatens to expose Russia to problems of Dutch disease— of a loss of competitiveness of the non-energy sector. Furthermore, even though the skill levels of Russia's workforce may still compare favourably with those in many emerging markets—mean years of schooling of the adult population are high, for instance—the quality of education is falling as a result of insufficient investment and poor salaries for teachers. Even on relatively favourable assumptions about key policy variables and progress in deregulation, our best-case long-term forecast for Russia is that the growth rate of real GDP will fall to about 3% after 2010. Falling growth in Russia
  • 55.
    Economies in transition:Regional overview 53 Country Forecast September 2006 www.eiu.com © The Economist IntelligenceUnit Limited 2006 Business environment rankings Business environment scores and ranks 2001-05 Total score a 2001-05 Global rank b 2006-10 Total score a 2006-10 Global rank b Change in total score Change in rank Grade 2001-05 Grade 2006-10 Azerbaijan 5.87 74 5.27 71 -0.60 3 very poor poor Bulgaria 5.67 49 6.68 45 1.00 4 moderate good Croatia 6.92 51 6.47 48 -0.45 3 moderate moderate Czech Republic 7.62 28 7.52 24 -0.10 4 good good Estonia 6.77 20 7.84 21 1.06 -1 good good Hungary 5.11 32 7.34 31 2.23 1 good good Kazakhstan 6.69 63 5.67 65 -1.02 -2 poor moderate Latvia 6.60 37 7.15 35 0.55 2 good good Lithuania 6.64 39 7.15 36 0.51 3 good good Poland 5.67 38 7.14 37 1.47 1 good good Romania 5.32 52 6.58 47 1.26 5 moderate good Russia 4.83 61 6.06 59 1.23 2 poor moderate Serbia 6.79 68 6.01 60 -0.78 8 very poor moderate Slovakia 6.71 31 7.50 25 0.79 6 good good Slovenia 4.51 33 7.28 32 2.77 1 good good Ukraine 6.48 73 5.43 68 -1.05 5 very poor poor World average 6.34 – 6.79 – 0.45 – moderate good Note. Qualitative grades are assigned according to the following scale: very good, score more than 8; good, 6.5-8; moderate, 5.5-6.4; poor, 5-5.4; very poor, less than 5. a Out of 10. b Out of 82 countries. The Economist Intelligence Unit has recently extended its business environment model from 60 to 82 countries, and from ten transition economies to 16. The new transition countries are Croatia, Estonia, Latvia, Lithuania, Slovenia and Serbia. Estonia is easily the top-ranked economy in the region. Among transition countries, Estonia's business environment now resembles most closely that of developed market economies across most categories. Recent years have brought considerable improvement in the east European investment climate. The early reformers among the countries of central Europe led the way in the early 1990s in adopting far-reaching stabilisation, liberalisation and privatisation programmes. Reform in the Commonwealth of Independent States (CIS), as well as in the Balkans, has been much more uneven and subject to periodic reversals, but even in these subregions significant progress has now been made. Looking at the transition region as a whole, its main advantages are a low-cost but qualified labour force; proximity to developed markets; long-term market potential; and the ample natural resource endowments that characterise some countries. East European business environments are expected to continue to improve over the medium term. This will be the case despite current worries about reform stagnation and a return to statist policies in Russia. Almost all of the countries in the region covered by our model are expected to see improved scores and most have improved global ranks in 2006-10 compared with the 2001-05 historical period.
  • 56.
    54 Economies intransition: Regional overview Country Forecast September 2006 www.eiu.com © The Economist IntelligenceUnit Limited 2006 Annual real GDP growth is expect to average 4-5% in 2006-10 and average inflation will continue to decline. More liberal policies towards the private sector, changes in tax regimes, further liberalisation of foreign trade and exchange regimes, and infrastructure development imply an average business environment in 2006-10 that will be significantly better than in the past— although it will still lag considerably behind western Europe and leading emerging markets. Business environment scores I II III IV V VI VII VIII IX X XI 2001-05 North America 7.9 8.5 7.8 9.3 8.7 9.8 7.6 9.4 8.0 9.4 8.6 Western Europe 8.1 8.0 6.1 7.9 8.3 8.5 6.3 8.5 6.8 8.2 7.7 Eastern Europe 5.7 7.1 5.6 5.1 6.5 7.0 5.6 5.5 6.3 5.6 6.0 Asia 6.3 7.6 6.0 6.0 6.7 7.2 6.8 6.1 6.5 5.7 6.5 Latin America 5.3 6.7 4.8 5.3 6.4 6.7 5.4 5.3 6.1 4.8 5.7 Middle East & Africa 4.6 6.9 5.6 4.4 5.7 5.3 5.7 5.0 5.3 4.6 5.3 2006-2010 North America 8.1 8.2 8.2 9.3 8.7 9.6 7.8 9.4 8.2 9.6 8.7 Western Europe 8.3 8.3 6.5 8.3 8.5 8.8 6.7 9.1 6.9 8.6 8.0 Eastern Europe 6.2 7.5 5.9 6.3 7.0 8.1 6.4 6.5 6.6 6.4 6.7 Asia 6.2 7.6 6.4 6.7 7.2 8.0 7.1 7.0 6.7 6.4 6.9 Latin America 5.4 7.3 5.3 5.5 6.4 7.2 5.4 5.8 6.1 5.5 6.0 Middle East & Africa 4.9 7.2 5.9 5.1 6.3 6.2 6.4 5.7 5.4 5.2 5.8 Note. I = Political environment; II = Macroeconomic environment; III = Market opportunities; IV = Policy towards private enterprise and competition; V Policy towards foreign investment; VI = Foreign trade and exchange controls; VII = Taxes; VIII = Financing; IX = The labour market; X = Infrastructure; XI = Overall score.
  • 57.
    Economies in transition:Regional overview 55 Country Forecast September 2006 www.eiu.com © The Economist IntelligenceUnit Limited 2006 Articles from previous issues Workers' remittances in eastern Europe, by Stuart Hensel, Senior Economist, Central and Eastern Europe, Economist Intelligence Unit Financial sector stability in south-eastern Europe: causes and consequences of rapid credit growth, by Matthew Shinkman, Senior Economist, Central and Eastern Europe, Economist Intelligence Unit Kosovo: a messy denouement, by Laza Kekic, Regional Director for Central and Eastern Europe, Economist Intelligence Unit Frozen conflicts in the Commonwealth of Independent States, by Anna Walker, Senior Editor, Central and Eastern Europe, Economist Intelligence Unit Is eastern Europe still price-competitive?, by Laza Kekic, Regional Director for Central and Eastern Europe, Economist Intelligence Unit Actual vs. potential trade: is the Commonwealth of Independent States underperforming?, by Leila Butt, Senior Economist, Central and Eastern Europe, Economist Intelligence Unit Do low corporate tax rates attract foreign investment? A look at recent evidence for the EU, by James Owen, Senior Economist, Central and Eastern Europe, Economist Intelligence Unit Agriculture in east-central Europe after the EU enlargement, by Hannah Chaplin, Research Fellow, Trinity College Dublin Privatisation in eastern Europe: the key to the transition?, by Saul Estrin, Professor of Economics and Deputy Dean, London Business School EU enlargement: one year on, by Katinka Barysch, Chief Economist, Centre for European Reform Eastern Europe's democratic transition: the stillbirth of politics, by Joan Hoey, Senior Editor, Central and Eastern Europe, The Economist Intelligence Unit Tax issues and the new EU member states, by James Owen, Senior Economist, Central and Eastern Europe, Economist Intelligence Unit Recent trends in foreign direct investment into eastern Europe, by Laza Kekic, Regional Director, Central and Eastern Europe, Economist Intelligence Unit Where is the EU's final frontier?, by Laza Kekic, Regional Director, Central and Eastern Europe, Economist Intelligence Unit The impact of EU enlargement on countries to the east, by Stuart Hensel, Senior Editor, Central and Eastern Europe, Economist Intelligence Unit December 2004 September 2004 March 2005 June 2005 September 2005 June 2006 December 2005 March 2006
  • 58.
    56 Economies intransition: Regional overview Country Forecast September 2006 www.eiu.com © The Economist IntelligenceUnit Limited 2006 EU enlargement and foreign direct investment flows, by Laza Kekic, Regional Director, Central and Eastern Europe, Economist Intelligence Unit The banking sector in the countries of former Yugoslavia, by Matthew Shinkman, Economist, Central and Eastern Europe, Economist Intelligence Unit Demographics, economic performance and pension reform in central and eastern Europe, by Katinka Barysch, Chief Economist, Centre for European Reform Balkan prospects: time for greater optimism?, by Laza Kekic, Regional Director for Central and Eastern Europe, Economist Intelligence Unit Russia: what kind of capitalism?, by Laza Kekic, Regional Director, Central and Eastern Europe, Economist Intelligence Unit The impact of September 11th 2001 on Central Asia, by Anna Walker, Editor, Central and Eastern Europe, Economist Intelligence Unit Business environments in eastern Europe, by Laza Kekic, Regional Director, Central and Eastern Europe, Economist Intelligence Unit Structural reform in an enlarged Europe: east-central Europe and the Lisbon process, by Katinka Barysch, Chief Economist, Centre for European Reform EU accession: the impact on long-term growth, by Laza Kekic, Regional Director, Central and Eastern Europe, Economist Intelligence Unit The shadow economy in eastern Europe, by Leila Butt, Economist, Central and Eastern Europe, Economist Intelligence Unit Will EU money help eastern Europe to catch up? by Katinka Barysch, Chief Economist, Centre for European Reform, London The Western Balkans: heading off a looming crisis? by Laza Kekic, Regional Director, Central and Eastern Europe, Economist Intelligence Unit Eastern Europe after NATO enlargement, by Jonathan Eyal, Director of Studies, Royal United Services Institute for Defence Studies, London The road to the Euro, by Laza Kekic, Regional Director, Central and Eastern Europe, Economist Intelligence Unit Administrative reform in transition, by Stuart Hensel, Economist Intelligence Unit Senior Economist/Editor, Central and Eastern Europe Poland's fall from grace, by Nicholas Spiro, Consultant to the Economist Intelligence Unit Labour market problems in eastern Europe, by Katinka Barysch, Economist Intelligence Unit Senior Economist, Central and Eastern Europe The European Union's eastward enlargement—the possibility of failure, by Laza Kekic, Economist Intelligence Unit Regional Director, Central and Eastern Europe June 2002 September 2002 December 2002 March 2003 June 2003 September 2003 December 2003 March 2004 June 2004
  • 59.
    Economies in transition:Regional overview 57 Country Forecast September 2006 www.eiu.com © The Economist IntelligenceUnit Limited 2006 The outlook for US-Russian relations, by Laza Kekic, Economist Intelligence Unit Regional Director, Central and Eastern Europe Small enterprises in eastern Europe: the key to a successful transition?, by Katinka Barysch, Economist Intelligence Unit Senior Economist, Central and Eastern Europe Are the resource-rich Caspian littoral states at risk of catching "Dutch disease"?, by Leila Butt, Economist Intelligence Unit Deputy editor, Central and Eastern Europe Multinational companies in eastern Europe: the key drivers of the transition, by Paul Lewis, Economist Intelligence Unit Managing Editor, East European Business Publications Oil and gas investment prospects in the Commonwealth of Independent States, by Dafne Ter-Sakarian, Economist Intelligence Unit Editor, Central and Eastern Europe, and Leila Butt, Economist Intelligence Unit Deputy editor, Central and Eastern Europe The effects of EU enlargement on the countries left outside, by Heather Grabbe, Research Director, Centre for European Reform The role of institutions in the transition, by Laza Kekic, Economist Intelligence Unit Regional Director, Central and Eastern Europe Convergence with the EU: alternative measures to assess the process, by Rupinder Singh, Economist Intelligence Unit Senior Economist, Central and Eastern Europe NATO's dilemma: playing twister in the Balkans, by Laza Kekic, Economist Intelligence Unit Regional Director, Central and Eastern Europe EU enlargement: what to expect?, by Laza Kekic, Economist Intelligence Unit Regional Director, Central and Eastern Europe US foreign policy towards eastern Europe: continuity or change?, by Dafne Ter-Sakarian, Economist Intelligence Unit Editor, Central and Eastern Europe The eastward enlargement of the EU and economic performance in east-central Europe—static and dynamic effects, by David A Dyker, School of European Studies, University of Sussex The competitiveness of the central and east European economies in EU markets, by Alan Smith, School of Slavonic and East European Studies Assessing output performance in the second stage of the transition, by Gavin Gray, Economist Intelligence Unit Senior Economist, Central and Eastern Europe Trends in foreign direct investment, by Laza Kekic, Economist Intelligence Unit Regional Director, Central and Eastern Europe March 2002 June 2001 March 2001 December 2000 September 2000 December 2001 September 2001 June 2000
  • 60.
    58 Economies intransition: Regional overview Country Forecast September 2006 www.eiu.com © The Economist IntelligenceUnit Limited 2006 Data summary 2004 2005 2006 2007 2008 2009 2010 Population (m) Balkansa 41.4 41.3 41.3 41.2 41.1 41.1 41.0 Balticsb 7.1 7.1 7.0 7.0 7.0 6.9 6.9 East-central Europec 65.9 65.8 65.7 65.7 65.6 65.5 65.4 CISd 214.5 213.8 213.2 212.6 212.0 211.5 210.9 East Europe (excl CIS)e 114.4 114.2 114.1 113.9 113.7 113.5 113.3 East Europe (incl CIS)f 328.9 328.0 327.3 326.5 325.7 325.0 324.2 GDP growth rates (%) Balkansa 7.3 4.7 5.8 4.9 4.8 4.5 4.1 Balticsb 7.6 8.8 8.8 7.4 6.5 6.1 5.9 East-central Europec 5.0 4.3 5.2 4.6 4.2 4.0 4.0 CISd 8.1 6.3 7.0 6.2 5.6 5.1 4.9 East Europe (excl CIS)e 5.8 4.7 5.6 4.9 4.5 4.3 4.2 East Europe (incl CIS)f 7.1 5.6 6.4 5.7 5.2 4.8 4.6 GDP (US$ bn) at nominal exchange rates Balkansa 157.4 187.1 215.5 256.6 275.5 293.1 312.0 Balticsb 47.5 54.6 63.6 76.5 81.2 85.6 91.0 East-central Europec 536.1 618.0 674.2 786.6 831.9 866.4 906.1 CISd 705.5 914.7 1,161.1 1,357.6 1,494.8 1,641.1 1,797.2 East Europe (excl CIS)e 741.0 859.7 953.2 1,119.8 1,188.5 1,245.2 1,309.1 East Europe (incl CIS)f 1,446.5 1,774.4 2,114.3 2,477.4 2,683.3 2,886.4 3,106.3 GDP per head (US$) at nominal exchange rates Balkansa 3,799 4,531 5,220 6,228 6,698 7,139 7,612 Balticsb 6,672 7,708 9,034 10,936 11,667 12,386 13,236 East-central Europec 8,139 9,390 10,253 11,977 12,681 13,224 13,848 CISd 3,289 4,278 5,446 6,386 7,052 7,761 8,523 East Europe (excl CIS)e 6,476 7,528 8,356 9,833 10,454 10,972 11,555 East Europe (incl CIS)f 4,398 5,409 6,461 7,589 8,239 8,882 9,583 GDP (US$ bn) at purchasing power parities Balkansa 335.9 362.2 394.7 427.1 461.8 498.1 534.8 Balticsb 90.2 101.1 113.2 125.4 138.1 151.2 165.1 East-central Europec 918.3 986.7 1,069.0 1,152.6 1,240.2 1,332.0 1,429.6 CISd 1,892.7 2,073.3 2,287.6 2,510.5 2,742.8 2,971.8 3,214.1 East Europe (excl CIS)e 1,344.4 1,450.0 1,576.9 1,705.1 1,840.1 1,981.3 2,129.6 East Europe (incl CIS)f 3,237.1 3,523.3 3,864.5 4,215.6 4,582.8 4,953.0 5,343.7 GDP per head (US$) at purchasing power parities Balkansa 8,107 8,770 9,563 10,365 11,227 12,131 13,047 Balticsb 12,673 14,277 16,078 17,914 19,846 21,870 24,025 East-central Europec 13,943 14,992 16,258 17,549 18,906 20,329 21,849 CISd 8,824 9,696 10,730 11,810 12,939 14,053 15,243 East Europe (excl CIS)e 11,751 12,697 13,824 14,972 16,185 17,457 18,796 East Europe (incl CIS)f 9,842 10,741 11,809 12,913 14,072 15,242 16,485 Consumer price inflation (%) Balkansa 11.6 10.1 9.0 6.8 5.4 4.7 4.1 Balticsb 3.0 4.2 4.4 3.6 3.2 2.8 2.8 East-central Europec 4.3 2.4 2.3 3.0 2.6 2.4 2.3 CISd 10.3 12.5 9.4 9.2 8.0 7.3 6.9 East Europe (excl CIS)e 5.8 4.2 3.8 3.7 3.1 2.8 2.5 East Europe (incl CIS)f 8.4 9.0 7.1 7.0 6.1 5.5 5.2
  • 61.
    Economies in transition:Regional overview 59 Country Forecast September 2006 www.eiu.com © The Economist IntelligenceUnit Limited 2006 2004 2005 2006 2007 2008 2009 2010 Merchandise exports (US$ bn) Balkansa 45.4 53.1 64.3 78.0 87.2 96.6 108.0 Balticsb 19.5 24.9 31.4 37.5 40.1 42.9 46.4 East-central Europec 249.0 286.0 331.6 377.8 415.8 447.7 485.1 CISd 241.2 314.5 403.1 448.9 474.0 486.5 520.9 East Europe (excl CIS)e 313.9 364.0 427.3 493.2 543.0 587.2 639.5 East Europe (incl CIS)f 555.2 678.6 830.4 942.1 1,017.0 1,073.7 1,160.4 Merchandise imports (US$ bn) Balkansa -71.1 -83.0 -101.1 -121.5 -133.2 -144.3 -159.2 Balticsb -26.7 -32.6 -40.3 -46.9 -49.7 -52.6 -56.1 East-central Europec -261.4 -292.6 -338.4 -387.2 -424.0 -456.7 -496.3 CISd -143.4 -183.8 -241.4 -289.0 -334.5 -374.9 -434.6 East Europe (excl CIS)e -359.2 -408.1 -479.8 -555.6 -606.9 -653.6 -711.6 East Europe (incl CIS)f -502.6 -591.9 -721.3 -844.7 -941.4 -1,028.6 -1,146.2 Trade balance (US$ bn) Balkansa -25.7 -29.9 -36.8 -43.5 -46.1 -47.7 -51.2 Balticsb -7.2 -7.7 -8.9 -9.5 -9.6 -9.7 -9.6 East-central Europec -12.4 -6.6 -6.8 -9.4 -8.1 -9.1 -11.2 CISd 97.8 130.8 161.7 159.8 139.4 111.6 86.3 East Europe (excl CIS)e -45.3 -44.1 -52.5 -62.4 -63.9 -66.5 -72.1 East Europe (incl CIS)f 52.6 86.6 109.1 97.4 75.6 45.1 14.2 Current-account balance (US$ bn) Balkansa -12.6 -16.2 -21.7 -24.3 -24.1 -23.3 -23.7 Balticsb -4.9 -5.2 -6.8 -7.3 -7.2 -7.1 -6.7 East-central Europec -27.8 -19.2 -21.4 -25.6 -26.3 -27.1 -29.7 CISd 64.7 85.8 109.6 104.1 82.4 54.2 22.3 East Europe (excl CIS)e -45.4 -40.6 -49.9 -57.1 -57.6 -57.4 -60.2 East Europe (incl CIS)f 19.3 45.2 59.7 47.0 24.8 -3.2 -37.9 Exports (% of GDP) Balkansa 28.9 28.4 29.8 30.4 31.6 33.0 34.6 Balticsb 41.1 45.6 49.3 49.0 49.3 50.1 51.0 East-central Europec 46.4 46.3 49.2 48.0 50.0 51.7 53.5 CISd 34.2 34.4 34.7 33.1 31.7 29.6 29.0 East Europe (excl CIS)e 42.4 42.3 44.8 44.0 45.7 47.2 48.8 East Europe (incl CIS)f 38.4 38.2 39.3 38.0 37.9 37.2 37.4 Current-account balance (% of GDP) Balkansa -8.0 -8.6 -10.1 -9.5 -8.8 -7.9 -7.6 Balticsb 0.0 0.0 0.0 0.0 0.0 0.0 0.0 East-central Europec -5.2 -3.1 -3.2 -3.3 -3.2 -3.1 -3.3 CISd 9.2 9.4 9.4 7.7 5.5 3.3 1.2 East Europe (excl CIS)e -6.1 -4.7 -5.2 -5.1 -4.8 -4.6 -4.6 East Europe (incl CIS)f 1.3 2.5 2.8 1.9 0.9 -0.1 -1.2 External debt (US$ bn) Balkansa 93.1 103.1 115.1 130.0 137.6 146.4 154.7 Balticsb 32.1 37.9 45.5 51.1 54.5 57.9 61.3 East-central Europec 244.8 275.2 303.2 342.7 358.9 367.9 383.3 CISd 253.3 284.2 358.0 407.2 452.9 495.9 545.7 East Europe (excl CIS)e 370.1 416.2 463.8 523.8 551.0 572.2 599.3 East Europe (incl CIS)f 623.3 700.4 821.8 931.0 1,003.9 1,068.1 1,145.0
  • 62.
    60 Economies intransition: Regional overview Country Forecast September 2006 www.eiu.com © The Economist IntelligenceUnit Limited 2006 2004 2005 2006 2007 2008 2009 2010 External debt (% of GDP) Balkansa 59.2 55.1 53.4 50.6 50.0 49.9 49.6 Balticsb 67.7 69.5 71.5 66.7 67.1 67.6 67.4 East-central Europec 45.7 44.5 45.0 43.6 43.1 42.5 42.3 CISd 35.9 31.1 30.8 30.0 30.3 30.2 30.4 East Europe (excl CIS)e 49.9 48.4 48.7 46.8 46.4 46.0 45.8 East Europe (incl CIS)f 43.1 39.5 38.9 37.6 37.4 37.0 36.9 External debt (% of exports) Balkansa 204.9 194.1 179.1 166.7 157.9 151.5 143.3 Balticsb 164.8 152.3 144.9 136.3 136.0 135.1 132.0 East-central Europec 98.3 96.2 91.4 90.7 86.3 82.2 79.0 CISd 105.0 90.3 88.8 90.7 95.6 101.9 104.8 East Europe (excl CIS)e 117.9 114.3 108.5 106.2 101.5 97.4 93.7 East Europe (incl CIS)f 112.3 103.2 99.0 98.8 98.7 99.5 98.7 a Comprises Bulgaria, Croatia, Romania and Serbia b Comprises Estonia, Latvia and Lithuania. c Comprises Czech Republic, Hungary, Poland, Slovakia and Slovenia. d Comprises Azerbaijan, Kazakhstan, Russia and Ukraine. e Comprises Bulgaria, Croatia, Czech Republic, Estonia, Hungary, Latvia, Lithuania, Poland, Serbia, Romania, Slovakia and Slovenia. f Comprises Azerbaijan, Bulgaria, Croatia, Czech Republic, Estonia, Hungary, Kazakhstan, Latvia, Lithuania, Poland, Romania, Russia, Serbia, Slovakia, Slovenia and Ukraine.
  • 63.
    Economies in transition:Regional overview 61 Country Forecast September 2006 www.eiu.com © The Economist IntelligenceUnit Limited 2006 Guide to the business rankings model Outline of the model The business rankings model measures the quality or attractiveness of the business environment in the 82 countries covered by Country Forecasts using a standard analytical framework. It is designed to reflect the main criteria used by companies to formulate their global business strategies, and is based not only on historical conditions but also on expectations about conditions prevailing over the next five years. This allows the Economist Intelligence Unit to utilise the regularity, depth and detail of its forecasting work to generate a unique set of forward-looking business environment rankings on a regional and global basis. The business rankings model examines ten separate criteria or categories, covering the political environment, the macroeconomic environment, market opportunities, policy towards free enterprise and competition, policy towards foreign investment, foreign trade and exchange controls, taxes, financing, the labour market and infrastructure. Each category contains a number of indicators that are assessed by the Economist Intelligence Unit for the last five years and the next five years. The number of indicators in each category varies from five (foreign trade and exchange regimes) to 16 (infrastructure), and there are 91 indicators in total. Almost half of the indicators are based on quantitative data (eg, GDP growth), and are mostly drawn from national and international statistical sources for the historical period (2001- 05) and from Economist Intelligence Unit forecasts for the forecast period (2006-10). The other indicators are qualitative in nature (eg, quality of the financial regulatory system), and are drawn from a range of data sources and business surveys adjusted by the Economist Intelligence Unit, for 2001-05. All forecasts for the qualitative indicators covering 2006-10 are based on Economist Intelligence Unit assessments. The main sources used in the business rankings model include CIA, World Factbook; Economist Intelligence Unit, Country Risk Service, Country Finance, Country Commerce; Freedom House, Annual Survey of Political Rights and Civil Liberties; Heritage Foundation, Index of Economic Freedom; IMF, Annual Report on Foreign Exchange Restrictions; International Institute for Management Development, World Competitiveness Yearbook; International Labour Organisation, International Labour Statistics Yearbook; UN, Human Development Report; US Social Security Administration, Social Security Programs Throughout the World; World Bank, World Development Report; World Development Indicators; World Economic Forum, Global Competitiveness Report. Calculating the rankings The rankings are calculated in several stages. First, each of the 91 indicators is scored on a scale from 1 (very bad for business) to 5 (very good for business). The aggregate category scores are derived on the basis of simple or weighted averages of the indicator scores within a given category. These are then adjusted, on the basis of a linear transformation, to produce index values on a 1-10 scale. An arithmetic average of the ten category index values is then calculated to yield the aggregate business environment score for each country, again on a 1-10 scale. The use of equal weights for the categories to derive the overall score reflects in part the theoretical uncertainty about the relative importance of the primary determinants of investment. Surveys of foreign direct investors' intentions yield widely differing results on the relative importance of different factors. Weighted scores for individual categories based on correlation coefficients of recent foreign direct investment inflows do not in any case produce overall results that are significantly different to those derived from a system based on equal weights. For most quantitative indicators the data are arrayed in ascending or descending order and split into five bands (quintiles). The countries falling in the first quintile are assigned scores of 5, those falling in the second quintile score 4 and so on. The cut-off points between bands are based on the average of the raw indicator values for the top and bottom countries in adjacent quintiles. The 2001-05 ranges are then used to derive 2006-10 scores. This allows for intertemporal as well as cross-country comparisons of the indicator and category scores. Measurement and grading issues The indices and rankings attempt to measure the average quality of the business environment over the entire historical or forecast period, not simply at the start or at the end of the period. Thus in the forecast we assign an average grade to elements of the business environment over 2006-10, not to the likely situation in 2010 only. The scores based on quantitative data are usually calculated on the basis of the numeric average for an indicator over the period. In some cases, the “average” is represented, as an approximation, by the recorded value at the mid-point of the period (2003 or 2008). In only a few cases is the relevant variable appropriately measured by the value at the start of the period (eg, educational attainments). For one indicator (the natural resources endowment), the score remains constant for both the historical and forecast periods.
  • 64.
    62 Economies intransition: Regional overview Country Forecast September 2006 www.eiu.com © The Economist IntelligenceUnit Limited 2006 List of indicators in the business rankings model Political environment 1. Risk of armed conflict 2. Risk of social unrest 3. Constitutional mechanisms for the orderly transfer of power 4. Threat of politically motivated violence 5. International disputes or tensions 6. Government policy towards business 7. Effectiveness of political system in policy formulation and execution 8. Quality of the bureaucracy 9. Transparency and fairness of political system 10. Corruption 11. Impact of crime Macroeconomic environment *1. Inflation *2. Budget balance as % of GDP *3. Government debt as % of GDP *4. Exchange-rate volatility *5. Current-account balance as % of GDP Market opportunities *1. GDP, US$ bn at PPP *2. GDP per head, US$ at PPP *3. Real GDP growth *4. Share of world merchandise trade *5. Average annual rate of growth of exports *6. Average annual rate of growth of imports *7. The natural resource endowment *8. Profitability Policy towards private enterprise and competition 1. Degree to which private property rights are protected 2. Government regulation on setting up new private businesses 3. Freedom of existing businesses to compete 4. Promotion of competition 5. Protection of intellectual property 6. Price controls 7. Distortions arising from lobbying by special interest groups 8. Distortions arising from state ownership/control Policy towards foreign investment 1. Government policy towards foreign capital 2. Openness of national culture to foreign influences 3. Risk of expropriation of foreign assets 4. Availability of investment protection schemes Foreign trade and exchange controls 1. Capital-account liberalisation **2. Tariff and non-tariff protection *3. Openness of trade 4. Restrictions on the current account Taxes **1. The corporate tax burden *2. The top marginal personal income tax *3. Value-added tax *4. Employers' social security contributions 5. Degree to which fiscal regime encourages new investment 6. Consistency and fairness of the tax system Financing 1. Openness of banking sector 2. Stockmarket capitalisation **3. Distortions in financial markets 4. Quality of the financial regulatory system 5. Access of foreigners to local capital market 6. Access to medium-term finance for investment The labour market **1. Incidence of strikes *2. Labour costs adjusted for productivity *3. Availability of skilled labour 4. Quality of workforce 5. Restrictiveness of labour laws 6. Extent of wage regulation 7. Hiring of foreign nationals *8. Cost of living Infrastructure *1. Telephone density **2. Reliability of telecoms network **3. Extent and quality of road network *4. Production of electricity per head **5. The infrastructure for retail and wholesale distribution **6. Extent and quality of the rail network 7. Quality of ports infrastructure *8. Stock of personal computers *9. R&D expenditure as % of GDP *10. Rents of office space Note. A single asterisk (*) denotes a purely quantitative indicator. Indicators with a double asterisk (**) are partly based on data. All other indicators are qualitative in nature.