Download to read offline


![iii
NAWRU Non-Accelerating Wage Rate of Unemployment
PMI Purchasing Managers' Index
REER Real Effective Exchange Rate
SGP Stability and Growth Pact
VAT Value-Added Tax
CPB Centraal Planbureau, the Netherlands Bureau for Economic Policy Analysis
ECB European Central Bank
EIB European Investment Bank
EFSF European Financial Stability Facility
EMU Economic and Monetary Union
ESM European Stability Mechanism
FOMC Federal Open Market Committee, US
Fed Federal Reserve, US
IMF International Monetary Fund
OBR Office for Budget Responsibility, UK
OECD Organisation for Economic Cooperation and Development
WTO World Trade Organisation
Other abbreviations
AQR Asset Quality Review
BLS Bank Lending Survey
CFCI Composite Financing Cost Indicator
DSGE Dynamic stochastic general equilibrium [model]
FDI Foreign Direct Investment
FLS Funding for Lending Scheme, UK
FY Financial year
JPA Job Protection Plan, Hungary
LFS Labour Force Survey
LTRO Longer-Term Refinancing Operation
MRO Main Refinancing Operations
NFC Non-Financial Corporations
OMT Outright Monetary Transactions
SME Small and medium-sized enterprises
SMP Securities Market Programme, ECB
QUEST Quarterly Estimation and Simulation Tool, DG ECFIN's DSGE model
Graphs/Tables/Units
a.a. Annual average
bbl Barrel
bn Billion
bps Basis points
lhs Left hand scale
pp. / pps. Percentage point / points
pts Points
Q Quarter
q-o-q% Quarter-on-quarter percentage change
rhs Right hand scale
SAAR Seasonally-Adjusted Annual Rate
tn Trillion
y-o-y% Year-on-year percentage change](https://image.slidesharecdn.com/europeancommissionsautumnforecast2014-141120054853-conversion-gate02/75/European-commission-s-autumn-forecast-2014-5-2048.jpg)


![EA and EU outlook
33
area over the forecast horizon, though more
moderately than during the crisis period and to
stabilise in the EU.
…amid narrowing cross-country differences.
Labour market conditions and performances
continue to differ substantially across EU countries
but these divergences seem to have begun
narrowing this year. Unemployment rates in a
number of Member States worst affected by the
crises, such as Ireland, Portugal, Spain and Greece
were considerably below their cyclical peaks in
August. Unemployment in Ireland and Portugal
was down 3.1 pps., while in Spain and Greece,
unemployment was down 1.2 pps. and 1.1 pps.
respectively. The reduction has been more limited
in countries with the lower cyclical peaks such as
Austria -0.3 pp. or Germany -0.5 pp.. Thus,
unemployment in the euro area as a whole has
fallen mainly because of declines in the most
stressed countries. Looking ahead, labour market
differences are expected to continue narrowing
over the forecast horizon, although they will
nonetheless remain large. Unemployment rates are
expected to range from 4.8% in Germany to about
22% in Greece and Spain in 2016.
7. INFLATION DEVELOPMENTS
The trend towards lower inflation across EU
Member States has continued in autumn, guided by
lower commodity prices and remaining economic
slack. The outlook of a gradual pick-up in HICP
inflation rests on a gradual narrowing of the output
gap and a gradually easing of the dampening
influence of external factors.
A confluence of factors is keeping inflation
very low...
The EU economy’s disinflationary slide has
continued in 2014. HICP inflation continued to fall
in the first three quarters to 0.5% in the EU and
0.4% in the euro area. The persistence of low
inflation in Europe can be explained by a mix of
global factors and the weak economic
environment. The decline in global commodity
prices, especially energy and food prices had a
significant impact in driving headline inflation
lower. The impact of lower commodity prices was
magnified by the appreciation of the euro against
the US dollar earlier this year. The depreciation
since May did not neutralise the stronger fall in
commodity prices over the summer. The remaining
slack in the economy and weak domestic demand
have kept underlying price pressures low, a fact
also reflected in the prices of services and non-energy
industrial goods.
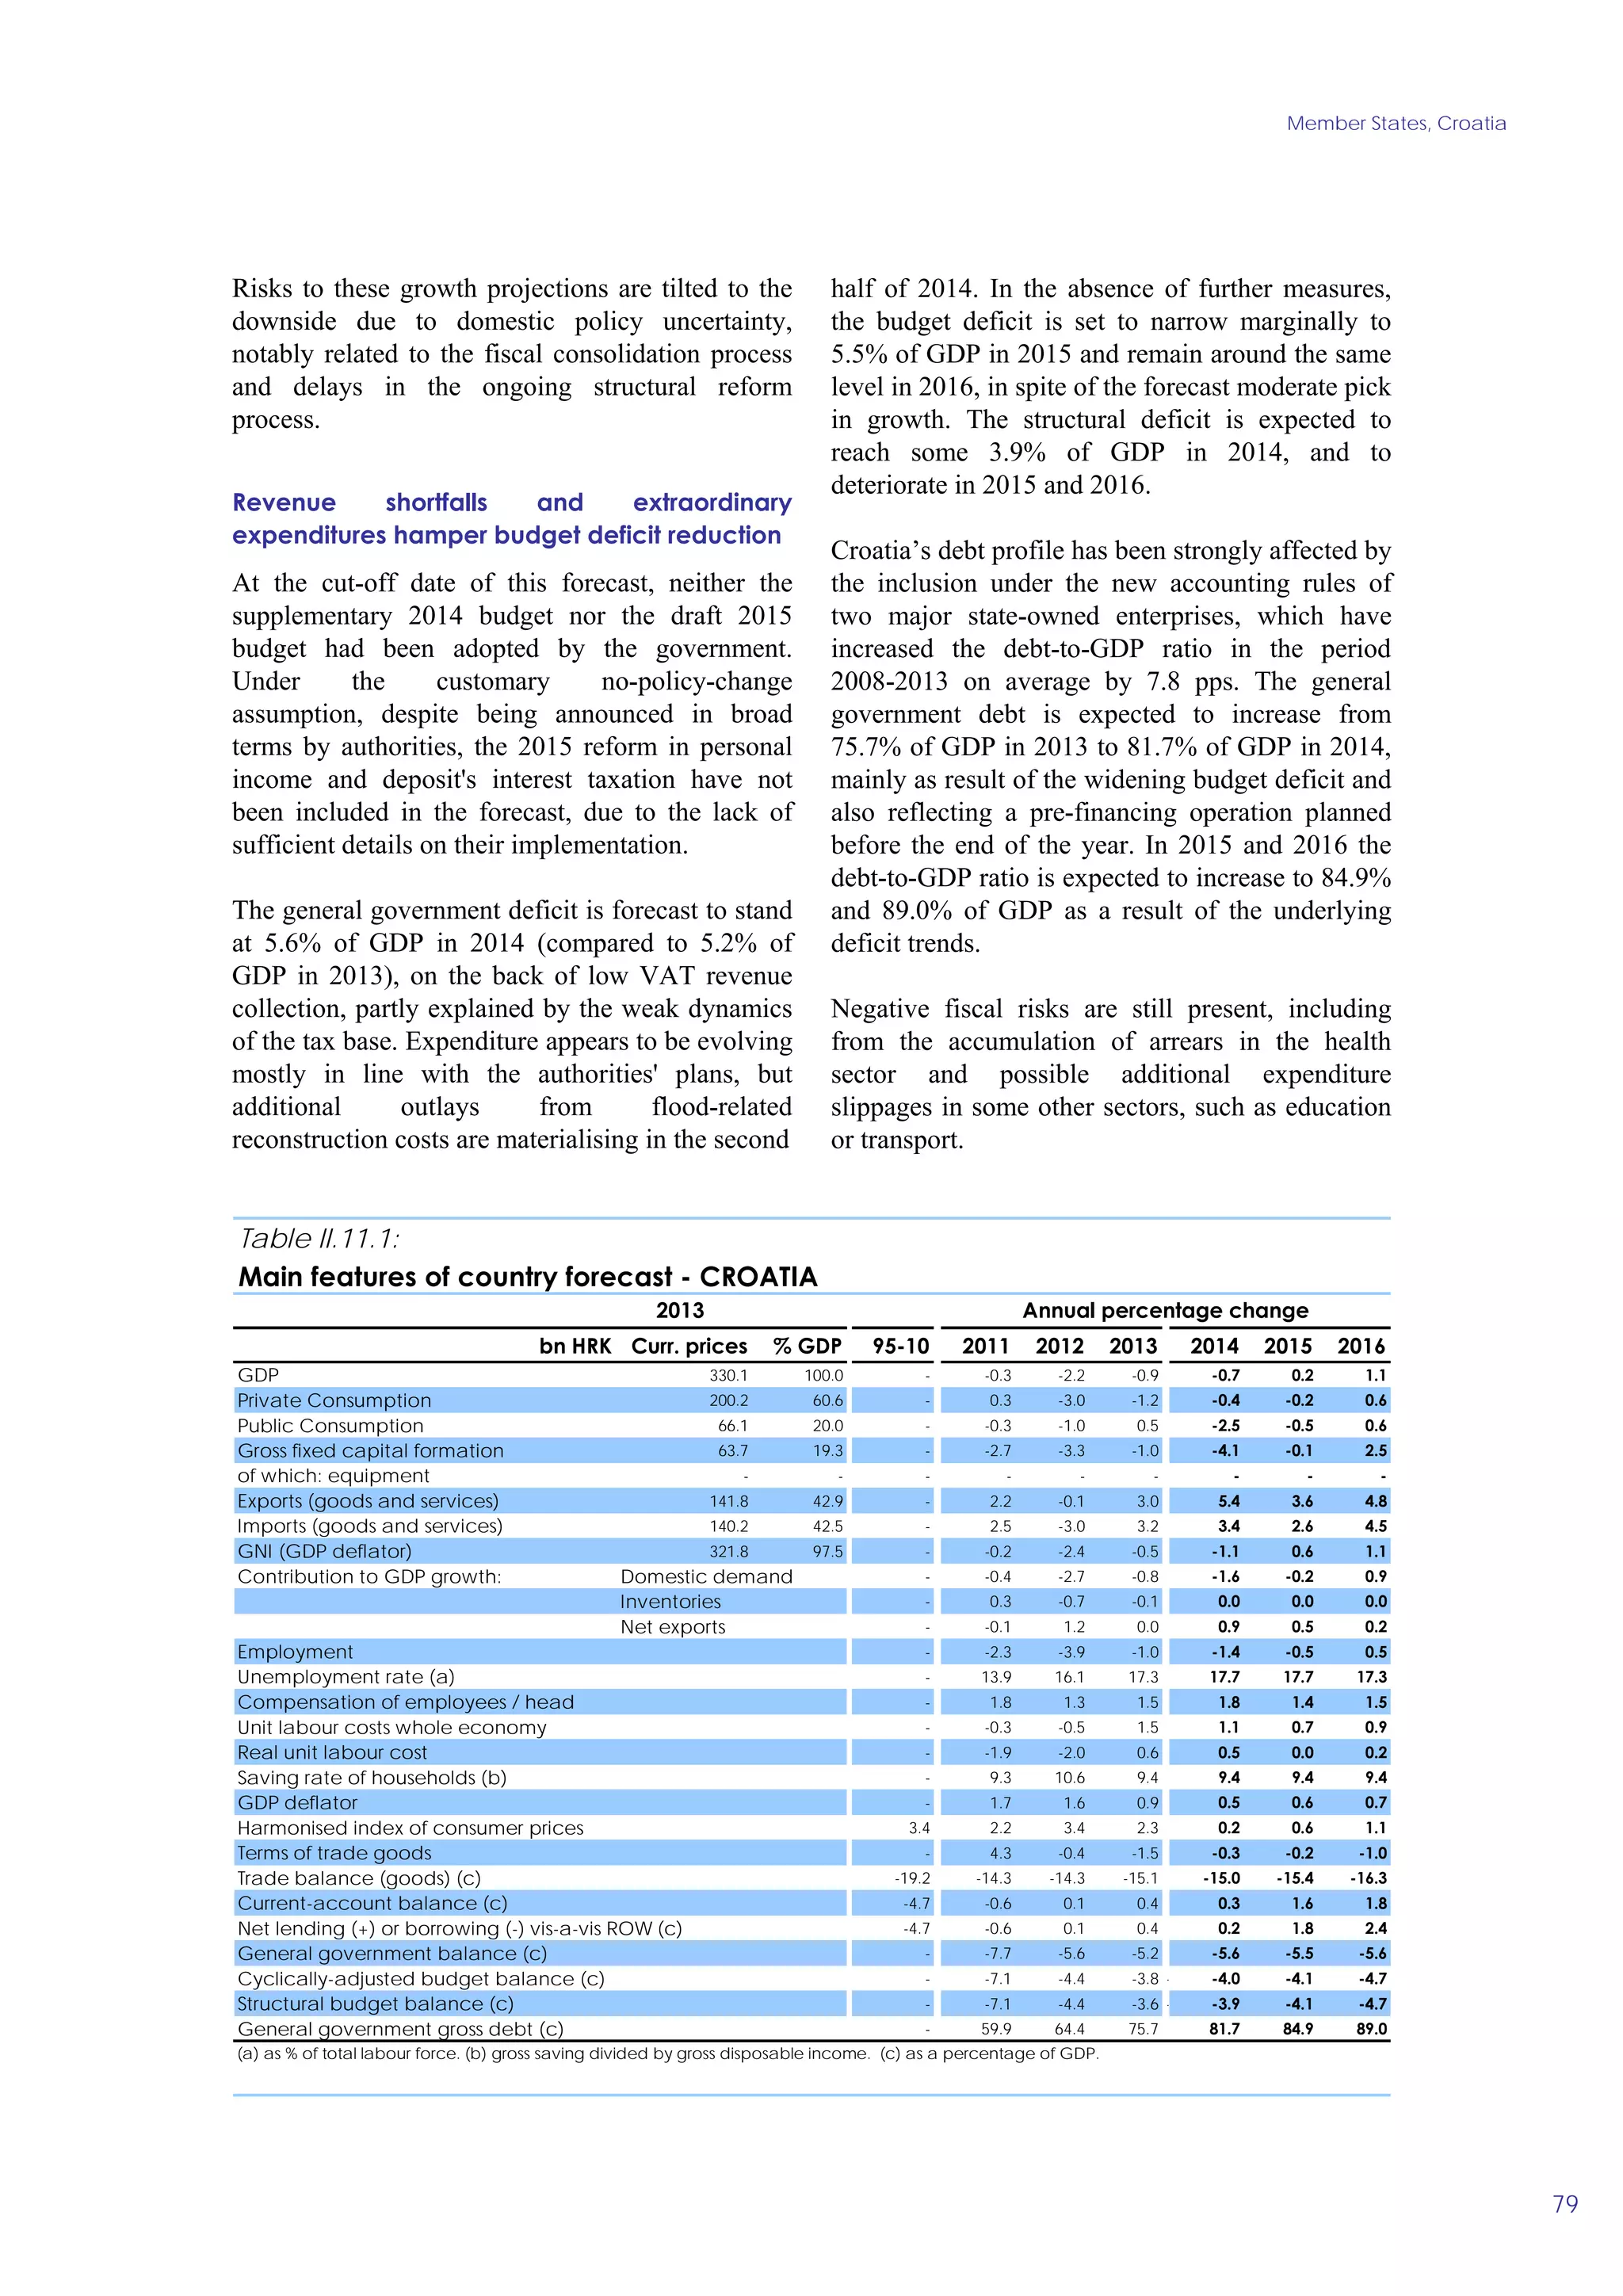
Core inflation (all items excluding energy and
unprocessed food) was on a gradual decline from
2012 up to the third quarter of 2014, but with only
marginal changes in 2014 in both the EU (Graph
I.32) and the euro area. The low level of core
inflation basically reflects historically low services
inflation due to weak demand and contained wage
pressures but also steadily declining non-energy
industrial goods inflation, which can be attributed
to low input prices and declining import prices. In
the third quarter of 2014, core inflation stood at
1.0% in the EU and 0.8% in the euro area, with
services inflation at 1.4% and 1.2% and inflation
of non-energy industrial goods close to zero in
both regions.
5
4
3
2
1
0
-1
%
forecast
Graph I.32: Inflation breakdown, EU
07 08 09 10 11 12 13 14 15 16
Energy and unprocessed food [pps.]
Other components (core inflation) [pps.]
HICP, all items
Disaggregated HICP data show that the decline in
food prices has increased in 2014 with food price
inflation standing at -0.9% in the EU and -0.8% in
the euro area in the third quarter. However, there is
no clear evidence that the decline is mainly caused
as a result of the Russian import ban on imports of
food products from the EU. The Member States hit
most directly by the ban are those with the highest
weights of the products concerned in their HICP
basket. A potential decrease in food prices is
therefore likely to vary across countries and
depends on the extent to which food exports can be
diverted, although diverting them to other Member
States would only matter for the regional
distribution of the impact on HICP inflation.](https://image.slidesharecdn.com/europeancommissionsautumnforecast2014-141120054853-conversion-gate02/75/European-commission-s-autumn-forecast-2014-45-2048.jpg)


The European Economic Forecast for autumn 2014 indicates a slow and fragile recovery for the EU economy, with modest GDP growth projections of 1.3% for the EU and 0.8% for the euro area. The report highlights ongoing challenges including high unemployment, low inflation, and a legacy of the global financial crisis impacting growth. It emphasizes the need for effective economic policies and structural reforms to stimulate investment and improve the economy's growth potential moving forward.