Downloaded 39 times


![This can be your title page Thank You Business Monitor International [email_address]](https://image.slidesharecdn.com/wherenextfortheworldeconomy-13058039096426-phpapp02-110519062013-phpapp02/85/Where-Next-For-The-World-Economy-56-320.jpg)

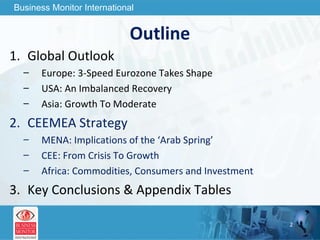
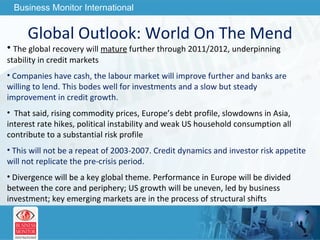
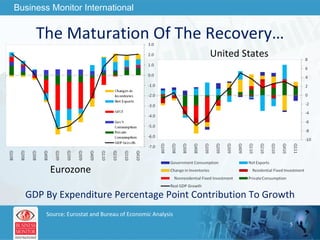
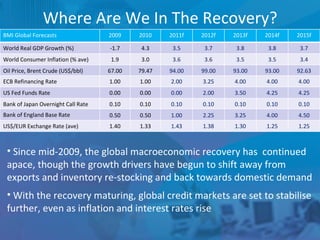
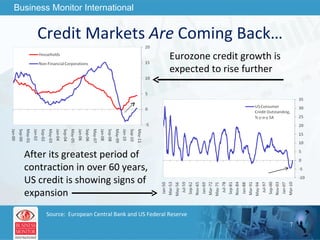
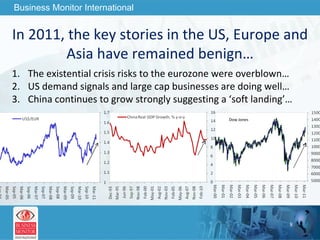
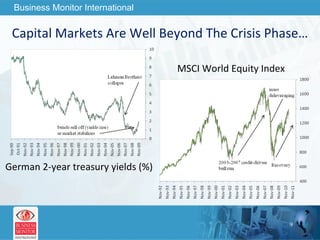
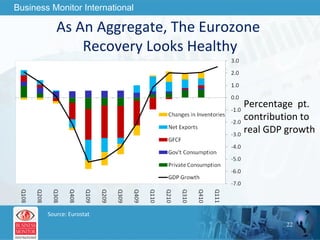
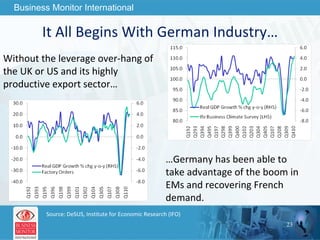
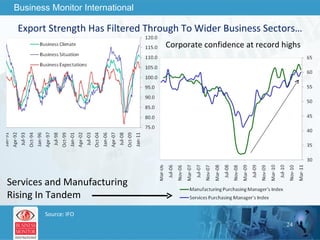
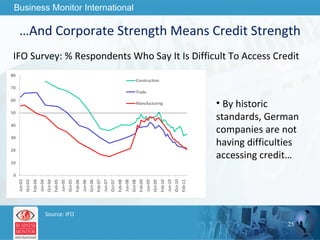
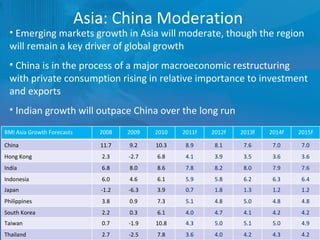
The document outlines forecasts and risks for the world economy from 2011 to 2015, highlighting a recovering global economy marked by varied regional growth dynamics and significant challenges. Key regions like the Eurozone are experiencing a divided recovery, with strong performances in core countries like Germany, while risks from debt and commodity price volatility loom large. The recovery landscape is characterized by an uneven U.S. growth pattern and moderate growth in emerging markets such as China and India.


