Download to read offline
![Ibikunle, R.A, Titiladunayo, I.F, Akinnuli, B.O, Lukman, A. F, Ikubanni, P. P and Agboola, O.O
http://www.iaeme.com/IJMET/index.asp 231 editor@iaeme.com
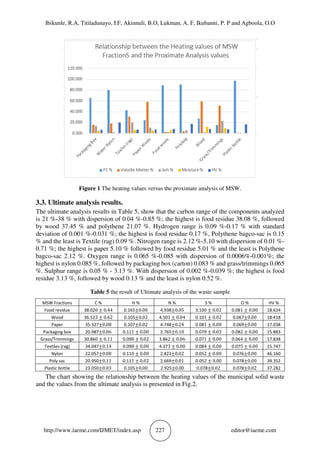
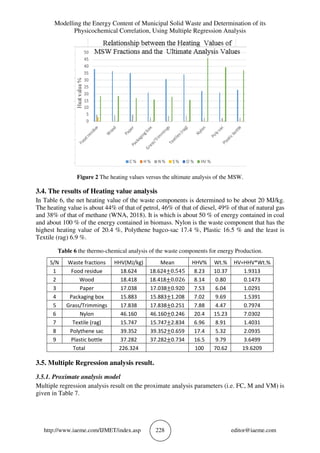
Multiple regression analysis on the physical composition data yielded the following model:
PCGVH ˆ010242.0ˆ008054.0ˆ010962.0171002.0ˆ +++= (11)
Where: HV is the heating value, G is the garbage composition of the municipal solid waste,
C is the cellulose components of the waste fractions and P the polyethylene fractions. Using
Jarque-Bera test for a diagnostic check, it shows that the error term is normally distributed
because the p-value, 0.20 is greater than 5% level of significance. Another diagnostic check was
conducted using variance inflation factor (VIF) to examine whether the regressors are correlated
(i.e. to check for multicollinearity problem). The variance inflation factor (VIF) is less than 10;
this infers there is no multi-collinearity which implies that the regressors are not correlated. The
results of p-value show that all the independent variables all have positive effect on the heating
value. .It implies 1 % increase in Garbage, Cellulose and Polyethylene fractions, will cause
heating value to increase by 2 %, 17 % and 3 % respectively. The R-squared shows about 98 %
of the variation in the response is explained by the regressors. Moreover, Garbage and
Polyethylene show that the model fitted to the data is significant at 5 %.
4. CONCLUSIONS
Energy content estimation of municipal solid waste is of practical interest in the design and
operation of the related energy conversion systems. Model development is necessary for the
accurate estimation of heating value in order to minimize cost in the design and operation of
municipal solid waste based engineering application. In this research, three models have been
developed based on multiple regression analysis, for the estimation of the high heating value of
municipal solid waste; using their contents of fixed carbon, moisture, volatile matter, carbon,
hydrogen, nitrogen, sulfur and the physical compositions. The multiple regression models
obtained from the physical composition, proximate and ultimate analyses give an accurate
prediction of the energy content of MSW from Ilorin metropolis. The results of this study show
that the developed model equations give high estimation performance. The model based on
ultimate analysis reveals that 1% increase in carbon and nitrogen will increase heating value by
79.08% and 10.83% respectively while a 1% increase in hydrogen and nitrogen decrease heating
value by 30.2% and 619.1% respectively. The model based on proximate analysis implies that
fixed carbon and volatile matter have positive effect on heating value while moisture has a
negative effect. It shows that 1 % increase in fixed carbon and volatile matter will increase the
heating value by 8 % and 37 % respectively; while 1 % increase in moisture content will reduce
heating value by 11 %. Also the model based on physical composition implies 1 % increase in
Garbage, Cellulose and Polyethylene fractions, will cause heating value to increase by 2 %, 17
% and 3 % respectively. This study reveals that the waste streams generated in Ilorin metropolis
have substantial combustible volatile matters, constituent elements, and organic matters that
could add to the heating values thereby making the MSW, suitable for energy generation. The
heating values of the MSW are 226 MJ/kg and 20 MJ/kg, high heating and low heating values
respectively. The regression model equations developed in this study constitute a reliable
reference study, for the estimation of heating value of municipal solid waste (MSW) and also
help the researchers that are working on MSW as an energy resource for power generation.
REFERENCES
[1] Adekunle, J.O., Ibrahim, J.S., Kucha, E.I., (2015): Proximate and Ultimate analysis of
Biological Briquettes of Nigerian’s Ogboyaga and Okaba Sub – bituminous Coal. British
Journal of Applied Science and Technology 7: 114 – 123.
[2] Akkaya, E., and Demir, A., (2009): Energy Content Estimation of Solid Waste by Multiple
Regression Analysis. 5 th International Advanced Technologies Symposiu. Karabuk.
[3] ASTM D1348-94: American Standard Test Method for Volatile matter content.](https://image.slidesharecdn.com/ijmet0911024-190402071852/85/Ijmet-09-11_024-12-320.jpg)
![Modelling the Energy Content of Municipal Solid Waste and Determination of its
Physicochemical Correlation, Using Multiple Regression Analysis
http://www.iaeme.com/IJMET/index.asp 232 editor@iaeme.com
[4] ASTM D3172-73: American Standard Test Method for Fixed Carbon in Proximate Analysis.
[5] ASTM D5231: American Standard Test Method for Characterization of Municipal Solid
Waste Streams.
[6] ASTM D5291: American Standard Test Method), Standard Test Method for Ultimate
Analysis.
[7] ASTM D5468-02: American Standard Test Method for Gross Calorific and Ash Value of
Waste Materials.
[8] ASTM D5468-02: American Standard Test Method), Standard Test Method for Heating
value.
[9] ASTM D7582–12: American Standard Test Method for Proximate analysis of Coal and
Coke by Macro Thermo-gravimetric Analysis.
[10] Benjamin, T.A, Emmanuel, E.O, and Gideon, A.D., (2014): Characterization of Municipal
Solid Waste in the Federal Capital Abuja, Nigeria, Global Journal of Science Frontier
Research: Health, Environment and Earth Science, 14 (2).
[11] Cynthia, O., Keat, T.L., Moses, M., (2013): The prospect of electricity generation from
municipal solid waste (MSW) in Ghana: A better waste management option, Journal of fuel
processing Technology, 110: 94 -102.
[12] EC SWA-Tool (2012): European Commission Solid Waste Tool: Development of a
Methodology Tool to Enhance the Precision and Comparability of Solid Waste Analysis
Data. Available from www.wastesolutions.org. (Accessed 12 December 2016).
[13] Islam, K.M.N., (2016): Municipal Solid Waste to Energy Generation in Bangladesh: Possible
Scenarios to Generate Renewable Electricity in Dhaka and Chittagong City. Journal of
Renewable Energy. Available from www.hindawi.com/journals . (Accessed 25 November
2017).
[14] Issam, A.K.A, Maria, M.B, Salam, A.T., Saheed, H.Q., and Kassinos, D.B., (2010): Solid
waste characterization, qualification, and management practices in developing countries, “A
case study: Nubulus District-Palestine.” Journal of Environmental management: 91: 1131 –
1138.
[15] Juin. L., Rajendra, D. P., and Thomas, M.H., (2012): Modeling the Energy Content of
Municipal Solid Waste Using Multiple Regression Analysis. Available from
http://www.tandfonline.com/loi/uawm20. (Accessed 9 July 2017).
[16] Kuleape, R., Cobinna, S.J., Danpare, S.B., Duwiejuah, A.B., Amoako, E.E., Asare, W.,
(2014): Assessment of the energy recovery potentials of solid waste generated in Akosombo,
Ghana. Africa Journal Environmental Science and Technology. 8: 297-305.
[17] Majumder, A.K., Jain, R., Banerjee, P., and Barnwal, J.P., (2008): Development of a new
proximate analysis based correlation to predict calorific value off coal, Fuel 87: 3077-3081.
[18] Shi, H., Maphinpey, N., Aqsha, A., Silbermann, R., (2016): Characterization,
thermochemical conversion studies and heating value modeling of municipal solid waste,
Journal of Waste Management, 48: 34 – 47.
[19] Shu, H.Y., Lu, H.C., Fan, H.J., Chang, M.C; Chen, J.C., (2006): Prediction for energy content
of Taiwan, municipal solid waste using multilayer perceptron neural networks. Journal of
the Air & Waste Management Association 56:852-858.
[20] Vairam, S., and Ramesh, S., (2013): Engineering Chemistry. John Wiley and sons Ltd.,
Southern Gate, United Kingdom.](https://image.slidesharecdn.com/ijmet0911024-190402071852/85/Ijmet-09-11_024-13-320.jpg)

The document discusses a study on the energy content of municipal solid waste (MSW) in Ilorin, Nigeria, using multiple regression analysis to develop predictive models based on various physicochemical characteristics. It addresses the significant environmental issues arising from inefficient waste management and explores waste-to-energy methods for energy recovery from MSW. The study involves characterizing waste samples and developing three regression models to estimate the energy content based on proximate and ultimate analyses of the waste components.


