This paper introduces a novel algorithm that combines independent component analysis (ICA) and translation invariant wavelet transform to effectively denoise electroencephalogram (EEG) signals affected by noise. The proposed method, Cycle Spinning Wavelet Transform ICA (CTICA), outperforms conventional ICA techniques (FastICA, EFICA, and Pearson-ICA) in terms of mean square error, signal-to-noise ratio, and overall accuracy as demonstrated through experiments. This approach aims to address the limitations of existing denoising methods by leveraging the strengths of both ICA and wavelet transforms.
![Janett Walters-Williams & Yan Li
International Journal of Biometrics and Bioinformatics Volume (5) : Issue (2) : 2011 130
A New Approach to Denoising EEG Signals - Merger of
Translation Invariant Wavelet and ICA
Janett Walters-Williams jwalters@utech.edu.jm
School of Computing & Information Technology
Faculty of Engineering & Computing
University of Technology, Jamaica
237 Old Hope Road,Kingston 6, Jamaica W.I.
Yan Li liyan@usq.edu.au
Department of Mathematics & Computing
Faculty of Sciences
University of Southern Queensland
Toowoomba, Australia
Abstract
In this paper we present a new algorithm using a merger of Independent Component Analysis
and Translation Invariant Wavelet Transform. The efficacy of this algorithm is evaluated by
applying contaminated EEG signals. Its performance was compared to three fixed-point ICA
algorithms (FastICA, EFICA and Pearson-ICA) using Mean Square Error (MSE), Peak Signal to
Noise Ratio (PSNR), Signal to Distortion Ratio (SDR), and Amari Performance Index.
Experiments reveal that our new technique is the most accurate separation method.
Keywords:Independent Component Analysis, Wavelet Transform, Unscented Kalman Filter,
Electroencephalogram (EEG), Cycle Spinning
1. INTRODUCTION
The use of electroencephalogram (EEG) in the field of Medicine has had a great impact on the
study of the human brain. The EEG itself represents the brain activity for a subject and gives us
an objective mode of recording brain stimulation. It also has been suggested by several studies
that EEGs can be used to detect several diseases such as Creutzfeldt-Jakob diseases (CJD),
Alzheimer’s, Dementia, Epilepsy, and Schizophrenia. The signals received, however, have
several origins that lead to the complexity of their identification. This complexity is made of both
the pure EEG signal and other non-cerebral signals called artifacts or noise. The artifacts have
resulted in the contamination of the EEG signals; hence the removal of these noises has
generated a large number of denoising techniques and methods, for example Fourier transform,
time-frequency analysis, Wavelet Transform (WT), Neural Networks (NN), and Independent
Component Analysis (ICA).
Independent Component Analysis (ICA) originated from the field of Blind Source Separation
(BSS) [8]. In the BSS problem, a set of observations is given while the underlying signal
information is hidden; the mixing weights of the individual signals are unknown. BSS is aimed at
identifying the source signals and/or the mixing weights so as to separate these information
sources into signal domain, feature domain or model domain [5]. ICA therefore calls for the
separation of the EEG into its constituent independent components (ICs) and then eliminating the
ICs that are believed to contribute to the noise. It is subjective, inconvenient and a time
consuming process when dealing with large amount of EEG data.
Different types of ICA algorithms were proposed in the last 10 to 12 years. Most of them suppose
that the sources are stationary and are based explicitly or implicitly on high order statistics
computation. Therefore, Gaussian sources cannot be separated, as they don’t have higher than 2](https://image.slidesharecdn.com/ijbb-65-160207090843/75/A-New-Approach-to-Denoising-EEG-Signals-Merger-of-Translation-Invariant-Wavelet-and-ICA-1-2048.jpg)
![Janett Walters-Williams & Yan Li
International Journal of Biometrics and Bioinformatics Volume (5) : Issue (2) : 2011 131
statistic moments. Other types of algorithms do not make the stationarity hypothesis, and use the
non stationary structure of the signals (i.e. their time or frequency structure) to separate them.
These methods use second order statistics (SOS) only, and they are called SOS algorithms. As
EEG signals are highly non-stationary, these type of algorithms are the most widely used.
Like ICA, Wavelet Transform (WT) has been used to study EEG signals [3][20][32][35-36][41][44]
successfully because of its good localization properties in time and frequency domain [13]. Here,
the EEG signals pass through two complementary filters and emerge as two signals,
approximation and details. This is called decomposition or analysis. The components can be
assembled back into the original signal without loss of information. This process is called
reconstruction or synthesis. The mathematical manipulation, which implies analysis and
synthesis, is called discrete wavelet transform (DWT) and inverse discrete wavelet transform
(IDWT). There have been many approaches to denoising using WT; those based on shrinkage
are the most popular [32] where the EEG signals are decomposed into wavelets and noise
removal done using thresholding and shrinkage.
Akin [1] in his research compared WT with fast Fourier transform and found that WT was better in
detecting brain diseases. His research was confirmed by Hermann et al [16]. Unser et al [39]
showed that wavelet is good at denoising EEG signals as well as other biomedical signals. WT
has therefore emerged as one of the superior technique in analyzing non-stationary signals like
EEG. Its capability in transforming a time domain signal into time and frequency localization helps
to understand the behaviour of a signal better. WT however has limitations such as Gibbs
phenomena [7].
Each of the above methods presents their own limitations. In our opinion a method that aims to fix
these limitations should be a more effective denoising method. This is possible as each method is
used to overcome the limitation of the other. We present in this paper a new method of extracting
noise from EEG signals which aims to remove the limitations of ICA and WT while improving
effectiveness – Cycle Spinning Wavelet Transform ICA (CTICA). The performance of CTICA is
analyzed and compared with three known fixed-point ICA algorithms – FastICA, EFICA and
Pearson-ICA, by using EEG signals contaminated with noise. Mean Square Error (MSE), Peak
Signal to Noise Ratio (PSNR), Signal to Distortion Ratio (SDR), and Amari Performance Index
are used as criteria for testing the quality of denoising.
2. SUPPORTING LITERATURE
EEG Signals
The nervous system sends commands and communicates by trains of electric impulses. When
the neurons of the human brain process information they do so by changing the flow of electrical
current across their membranes. These changing current (potential) generate electric fields that
can be recorded from the scalp. Studies are interested in these electrical potentials but they can
only be received by direct measurement. This requires a patient to under-go surgery for
electrodes to be placed inside the head. This is not acceptable because of the risk to the patient.
Researchers therefore collect recordings from the scalp receiving the global descriptions of the
brain activity. Because the same potential is recorded from more than one electrode, signals from
the electrodes are supposed to be highly correlated. These are collected by the use of an
electroencephalograph and called electroencephalogram (EEG) signals.
Understanding the brain is a huge part of Neuroscience, and the development of EEG was for the
elucidation of such a phenomenon. The morphology of the EEG signals has been used by
researches and in clinical practice to:
• Diagnose epilepsy and see what type of seizures is occurring.
• Produce the most useful and important test in confirming a diagnosis of epilepsy.
• Check for problems with loss of consciousness or dementia.
• Help find out a person's chance of recovery after a change in consciousness.
• Find out if a person who is in a coma is brain-dead.](https://image.slidesharecdn.com/ijbb-65-160207090843/75/A-New-Approach-to-Denoising-EEG-Signals-Merger-of-Translation-Invariant-Wavelet-and-ICA-2-2048.jpg)
![Janett Walters-Williams & Yan Li
International Journal of Biometrics and Bioinformatics Volume (5) : Issue (2) : 2011 132
• Study sleep disorders, such as narcolepsy.
• Watch brain activity while a person is receiving general anesthesia during brain surgery.
• Help find out if a person has a physical problem (in the brain, spinal cord, or nervous
system) or a mental health problem.
The signals must therefore present a true and clear picture about brain activities. Being a physical
system, recording electrical potentials, present EEG with problems; all neurons, including those
outside the brain, communicate using electrical impulses. These non-cerebral impulses are
produced from:
• Eye movements & blinking - Electrooculogram (EOG)
• Cardiac Movements - Cardiograph (ECG/ EKG)
• Muscle Movements - Electromyogram (EMG)
• Chewing & Sucking Movement – Glossokinetic
• The machinery used to record signals
• The power lines.
EEG recordings are therefore a combination of these signals called artifacts or noise and the pure
EEG signal defined mathematically as:
( ) ( ) ( )E t S t N t= + (1)
where S is pure EEG signal, N is the noise and E represents the recorded signal. The presence
of these noises introduces spikes which can be confused with neurological rhythms. They also
mimic EEG signals, overlaying these signals resulting in signal distortion (Figure 1). Correct
analysis is therefore impossible, resulting in misdiagnosis in the case of some patients. Noise
must be eliminated or attenuated.
FIGURE 1: EEG contaminated with EOG producing spikes
The method of cancellation of the contaminated segments, although practiced, can lead to
considerable information loss thus other methods such as Principal Components Analysis (PCA)
[45], the use of a dipole model [18] and more recently ICA and WT have been utilized.
Independent Component Analysis
Independent Component Analysis (ICA) is an approach for the solution of the BSS problem [8]. It
can be represented mathematically according to Hyvarinen, Karhunen & Oja [19] as:
X A s n= + (2)](https://image.slidesharecdn.com/ijbb-65-160207090843/75/A-New-Approach-to-Denoising-EEG-Signals-Merger-of-Translation-Invariant-Wavelet-and-ICA-3-2048.jpg)
![Janett Walters-Williams & Yan Li
International Journal of Biometrics and Bioinformatics Volume (5) : Issue (2) : 2011 133
where X is the observed signal, n is the noise, A is the mixing matrix and s the independent
components (ICs) or sources. (It can be seen that mathematically it is similar to Eq. 1). The
problem is to determine A and recover s knowing only the measured signal X (equivalent to E(t)
in Eq. (1)). This leads to finding the linear transformation W of X, i.e. the inverse of the mixing
matrix A, to determine the independent outputs as:
u W X W A s= = (3)
where u is the estimated ICs. For this solution to work the assumption is made that the
components are statistically independent, while the mixture is not. This is plausible since
biological areas are spatially distinct and generate a specific activation; they however correlate in
their flow of information [18].
ICA algorithms are suitable for denoising EEG signals because
(i) the signals recorded are the combination of temporal ICs arising from spatially fixed
sources and
(ii) the signals tend to be transient (localized in time), restricted to certain ranges of temporal
and spatial frequencies (localized in scale) and prominent over certain scalp regions
(localized in space) [28].
Wavelet Transform
Wavelet Transform (WT) is a form of time-frequency analysis been used successfully in denoising
biomedical signals by decomposing signals in the time-scale space instead of time-frequency
space. It is so because it uses a method called wavelet shrinkage proposed by Donoho &
Johnstone [9]. Each decomposed signal is called a wavelet (Fig 2).
FIGURE 2 : Demonstration of (a) a signal and (b) a wavelet
There are two basic types of WT. One type is designed to be easily reversible (invertible); that
means the original signal can be easily recovered after it has been transformed. This kind of WT
is used for image compression and cleaning (noise and blur reduction). Typically, the WT of the
image is first computed, the wavelet representation is then modified appropriately, and then the
WT is reversed (inverted) to obtain a new image.The second type is designed for signal analysis
for study of EEG or other biomedical signals. In these cases, a modified form of the original signal
is not needed and the WT need not be inverted.
WT decomposes a signal into a set of coefficients called the discrete wavelet transform (DWT)
according to:
, ,( ) ( )j k j k
t Z
C E t g t
∈
= ∑ (4)
where Cj,k is the wavelet coefficient and gj,k is the scaling function defined as:
2
2 ( 2 )
j
j
g t k
−
−
− (5)](https://image.slidesharecdn.com/ijbb-65-160207090843/75/A-New-Approach-to-Denoising-EEG-Signals-Merger-of-Translation-Invariant-Wavelet-and-ICA-4-2048.jpg)
![Janett Walters-Williams & Yan Li
International Journal of Biometrics and Bioinformatics Volume (5) : Issue (2) : 2011 134
The wavelet and scaling functions depend on the chosen wavelet family, such as Haar,
Daubechies and Coiflet. Compressed versions of the wavelet function match the high-frequency
components, while stretched versions match the low-frequency components. By correlating the
original signal with wavelet functions of different sizes, the details of the signal can be obtained at
several scales or moments. These correlations with the different wavelet functions can be
arranged in a hierarchical scheme called multi-resolution decomposition. The multi-resolution
decomposition algorithm separates the signal into “details” at different moments and wavelet
coefficients [35-36]. As the moments increase the amplitude of the discrete details become
smaller, however the coefficients of the useful signals increase [44-45].
Considering Eq. (1) the wavelet transform of E(t) produces wavelet coefficients of the noiseless
signal S(t) and the coefficients of the noise N(t). Researchers found that wavelet denoising is
performed by taking the wavelet transform of the noise-corrupted E(t) and passing the detail
coefficients, of the wavelet transform, through a threshold filter where the details, if small enough,
might be omitted without substantially affecting the main signals. There are two main threshold
filters – soft and hard. Research has shown that soft-thresholding has better mathematical
characteristics [44-45] and provides smoother results [15]. Once discarded these coefficients are
replaced with zeroes during reconstruction using an inverse wavelet transform to yield an
estimate for the true signal, defined as:
( ) ( )( )( )
^
1
( ) ( )] ( )thS t D E t W W E t−
= = Λ (6)
where thΛ is the diagonal thresholding operator that zeroes out wavelet coefficients less than the
threshold, th. It has been shown that this algorithm offers the advantages of smoothness and
adaptation. However, as Coifman and Donoho [7] pointed out, this algorithm exhibits visual
artifacts such Gibbs phenomena in the neighbourhoodof discontinuities.
Unscented Kalman Filter
Unscented Kalman Filter (UKF) is a Bayesian filter which uses minimum mean-squared error
(MMSE) as the criterion to measure optimality [4][34]. For highly nonlinear systems, the linear
estimate of the nonlinear model does not provide a good approximation of the model, and the
Extended Kalman Filter (EKF) will not track signals around sharp turning points. Another problem
with the EKF is that the estimated covariance matrix tends to underestimate the true covariance
matrix and therefore risks becoming inconsistent in the statistical sense without the addition of
"stabilising noise". UKF was found to address these flaws. It involves the Unscented
Transformation (UT), a method used to calculate the first and second order statistics of the
outputs of nonlinear systems with Gaussian. The nonlinear stochastic system used for the
algorithm is:
1k k k k
k k k
x A x B u v
y H x w
+ = + +
= +
(7)
where A and H are the known and constant matrices respectively, xk is the unobserved state of
the system, uk is a known exogenous input, yk is the observed measurement signal, vk is the
process noise and wk is the measurement noise.
UKF uses the intuition that it is easier to approximate a probability distribution function rather than
to approximate an arbitrary nonlinear function or transformation. Following this intuition, a set of
sample points, called sigma points, are generated around the mean, which are thenpropagated
through the nonlinear map to get a more accurate estimation of the mean and covariance of the
mapping results. In this way, it avoids the need to calculate the Jacobian, which for complex
functions can be a difficult task in itself (i.e., requiring complicated derivatives if done analytically
or being computationally costly if done numerically).](https://image.slidesharecdn.com/ijbb-65-160207090843/75/A-New-Approach-to-Denoising-EEG-Signals-Merger-of-Translation-Invariant-Wavelet-and-ICA-5-2048.jpg)
![Janett Walters-Williams & Yan Li
International Journal of Biometrics and Bioinformatics Volume (5) : Issue (2) : 2011 135
3. METHODOLOGY
Reasons for Algorithm
Although ICA is popular and for the most part does not result in much data loss; its performance
depends on the size of the data set i.e. the number of signals. The larger the set, the higher the
probability that the effective number of sources will overcome the number of channels (fixed over
time), resulting in an over complete ICA. This algorithm might not be able to separate noise from
the signals. Another problem with ICA algorithms has to do with the signals in frequency domain.
Although noise has different distinguishing features, once they overlap the EEG signals ICA
cannot filter them without discarding the true signals as well. This results in data loss.
WT utilizes the distinguishing features of the noise however. Once wavelet coefficients are
created, noise can be identified. Decomposition is done at different levels (L); DWT produces
different scale effects (Fig 3). Mallat [2] proved that as scales increase the WT of EEG and noise
present different inclination. Noise concentrates on scale 21, decreasing significantly when the
scale increases, while EEG concentrates on the 22-25 scales. Elimination of the smaller scales
denoise the EEG signals. WT therefore removes any overlapping of noise and EEG signals that
ICA cannot filter out.
Recently there has been research comparing the denoising techniques of both ICA and WT. It
was found that
(i) if noise and signals are nearly the same or higher amplitude, wavelets had difficultly
distinguishing them. ICA, on the other hand, looks at the underlying distributions thus
distinguishing each [46] and
(ii) ICA gives high performance when datasets are large. It suffers however from the trade off
between a small data set and high performance [20].
Research therefore shows that ICA and wavelets complement each other, removing the
limitations of each [35]. Since then research has been done applying a combination of both with
ICA as a per- or post- denoising tool. Inuso et al. [20] used them where ICA and wavelets are
joint. They found that their method outperformed the pre- and post- ICA models.
With or without ICA, conventional wavelet coefficients of 2 signals maybe quite different in many
properties as WT is not time invariant, consequently, if the noisy signal is shifted in time,
denoised, and then shifted back, the result will, in general, be different from the estimate obtained
from denoising without shifting. This result in serious problems such as pseudo-Gibbs
phenomenaalternating undershoot and overshoot of a special target level near singularity points
of signals [42].
FIGURE 3: Noisy EEG and its Wavelet Transform at different scales](https://image.slidesharecdn.com/ijbb-65-160207090843/75/A-New-Approach-to-Denoising-EEG-Signals-Merger-of-Translation-Invariant-Wavelet-and-ICA-6-2048.jpg)
![Janett Walters-Williams & Yan Li
International Journal of Biometrics and Bioinformatics Volume (5) : Issue (2) : 2011 136
Cycle Spinning (CS) was proposed by Coifman & Donoho [7] as a simple yet efficient method that
utilizes the periodic time-invariance of WT in fixing the noise found in wavelet coefficients and
defined as:
( )( )( )
1 2^
1
, ,
1, 11 2
1
( )
k k
i j i j
i j
s S T T S x
k k
θ−
− −
= =
= ∑ (8)
where (k1,k2) are maximum number of shifts, T the shift variant transform, Si,j is the circulant shift,
and θ the threshold operator. CS calls for the suppression of these noises by shifting the signals
in time and computing the estimate. Using different shifts produce different estimates which are
not completely independent; consequently averaging these estimates results in a reduction in the
noise generated in each shift. This results in the denoising of all possible unique circularly shifted
version of the signal and the creation of the Translation Invariant Wavelet Transform (TIWT)
method.
Apart from the use of ICA improvements of WT have been investigated. The idea of Wiener
filtering of individual wavelet coefficient arose from the fact that wavelet transforms tend to
decorrelate data. An improved wavelet domain denoising technique was therefore proposed that
utilizes the Wiener filtering of wavelet coefficients [13]. Research shows that this technique has
superior performance over other denoising algorithms using thresholding or shrinkage of wavelet
coefficients and has motivated the analysis of many denoising algorithms in terms of optimal
filtering of noisy wavelet coefficients. In 2006 the combination of WT and the Kalman Filter (KF)
was a novel idea. In the experiments, researchers found that the combination effectively correct
overlapped spectra and reduce noise [38]. Mastriani et al. [29] created the KalmanShrink for the
WT; simulations showed that the threshold had better performance than the most commonly used
filters [29]. The use of KF and WT combination therefore improved denoising techniques.
Research has also shown that the KF outperforms the Wiener Filter when applied to WT [31].
UKF is advancement on KF.
Each method aims at improving the other in that
(i) WT removes overlapping of noise signals that ICA cannot filter out.
(ii) ICA can distinguish between noise and signals that are nearly the same or higher
amplitude which WT has difficultly with.
(iii) WT exhibits serious problems such as pseudo-Gibbs phenomena which CS eliminates
and
(iv) Combination of filters and WT effectively correct overlapped spectra
This paper proposes a merger of all four methodologies.
FIGURE 4: Proposed CTICA - Artifacts Removal System
Design
In this paper we are presenting another method to denoising EEG signals using WT and ICA
along with smaller methods to improve their performance. Some of the ideas appear in earlier
algorithms; however the main differences of CTICA are:
(i)the use of CS, and
(ii) the merger of WT, UKF and ICA into one ( this has never been done before).
ICA
Denoising
Decomposed
intoWavelet
s
Raw EEG
Filtering
using
UKF
Reconstruct
Signal
Independent
Components
Wavelets Pure EEGFiltered
wavelets](https://image.slidesharecdn.com/ijbb-65-160207090843/75/A-New-Approach-to-Denoising-EEG-Signals-Merger-of-Translation-Invariant-Wavelet-and-ICA-7-2048.jpg)
![Janett Walters-Williams & Yan Li
International Journal of Biometrics and Bioinformatics Volume (5) : Issue (2) : 2011 137
A block diagram representation of the proposed work is shown in Figure 4. The algorithm can be
divided into the following:
1. Signal Collection
This algorithm is designed to denoise both natural and artificially noised EEG signals. They
should therefore be mathematically defined based on Eq. (1).
2. Apply CS to signal
The number of time shifts is determined; in so doing signals are forcibly shifted so that their
features change positions removing the undesirable oscillations which result in pseudo-Gibbs
phenomena. The circulant shift by h is defined as:
( ) ( )( ) ( ) m odhS f n f n h N= + (9)
where f(n) is the signal, S is time shift operator and N is the number of signals. The time-shift
operator S is unitary and therefore invertible i.e. (Sh)-1
= S-h
3. Decomposition of Signal
The signals are decomposed into 5 levels of DWT using the Symmlet family, separating noise
and true signals. Symmlets are orthogonal and its regularity increases with the increase in the
number of moments [11]. After experiments the number of vanishing moments chosen is 8
(Sym8).
4. Filter Coefficients
Perform UKF on the coefficients to filter out some noise reducing the shrinkage threshold.
5. Choose and Apply Threshold Value
Denoise using the soft-thresholding method discarding all coefficients below the threshold value
using VisuShrink based on the universal threshold defined by Donoho & Johnstone [9] given as:
2
2 l o gT Nσ= (10)
where N is the number of samples and σ2
is the noise power.
6. Apply ICA algorithm
Signals and noise may have nearly the same frequency characteristics and overlap in time thus
producing noisy coefficients such as beta activity and muscle noise, that WT has not been able to
distinguish and remove. ICA is able to look at the underlying distributions thus distinguish noise
and remove them. Research has shown that ICA is a robust denoising method where its
performance is not affected by the severity of the mixing signals [10]. We implemented a
symmetrical fixed-point ICA algorithm based on the Hyvarinen model [19] where the gradient
function is:
( ) ta n h ( , )g y a y= (11)
A fixed-point algorithm has a cubic or at least a quadratic convergence, is not linear and no
parameters have to be chosen for usage which makes it a better choice than other ICA models.
7. Reconstruction of Signals
EEG signals are reconstructed using inverse DWT.
8. Apply CS
Revert signals to their original time shift and average the results obtained to produce the
denoised EEG signals.](https://image.slidesharecdn.com/ijbb-65-160207090843/75/A-New-Approach-to-Denoising-EEG-Signals-Merger-of-Translation-Invariant-Wavelet-and-ICA-8-2048.jpg)
![Janett Walters-Williams & Yan Li
International Journal of Biometrics and Bioinformatics Volume (5) : Issue (2) : 2011 138
The proposed algorithm can be expressed as Avg [Shift – Denoise -Unshift] i.e. using Eq. (9) it is
defined as:
( )( )h H h ha v g S T S f∈ − (12)
where H is the range of shifts, T is the wavelet shrinkage denoising operator, h the circular shift
and the maximum of His the length of the signalN from Eq. (9).
Evaluation
There are different means to access the separation quality performed by ICA methods; however
the performance measures used throughout this section will be:
(i) the Mean Square Error (MSE),
(ii) the Peak Signal to Noise Ratio (PSNR),
(iii) the Signal to Distortion Ratio (SDR), and
(iv) the Amari Performance Index
We employed fixed point benchmark ICAs with the linearity g(u) = tanh and the symmetric
orthogonalization for comparison, namely:fixed-point - FastICA[19], EFICA[28] and Pearson-ICA
[26]
FIGURE 5 : Sample EEG signals from a male subject
4. EXPERIMENTAL DATA
In order to do the study effectively data was collected for analysis from two sites.
(i) http://www.filewatcher.com/b/ftp/ftp.ieee.org/uploads/press/rangayyan.0.0.html [48]. Data
was collected at a sampling rate of 100Hz but noise free. These signals were artificially
contaminated.
(ii) http://sccn.ucsd.edu/~arno/fam2data/publicly_available_EEG_data.html [47]. All data are
real comprised of EEG signals from both human and animals. Data were of different
types.
(a) Data set acquired is a collection of 32-channel data from one male subject who
performed a visual task. Fig. 5 shows 10 signals from this dataset.
(b) Human data based on five disabled and four healthy subjects. The disabled subjects
(1-5) were all wheelchair-bound but had varying communication and limb muscle
control abilities. The four healthy subjects (6-9) were all male PhD students, ages 30
who had no known neurological deficits. Signals were recorded at 2048 Hz sampling
rate from 32 electrodes placed at the standard positions of the 10-20 international
system.](https://image.slidesharecdn.com/ijbb-65-160207090843/75/A-New-Approach-to-Denoising-EEG-Signals-Merger-of-Translation-Invariant-Wavelet-and-ICA-9-2048.jpg)
![Janett Walters-Williams & Yan Li
International Journal of Biometrics and Bioinformatics Volume (5) : Issue (2) : 2011 140
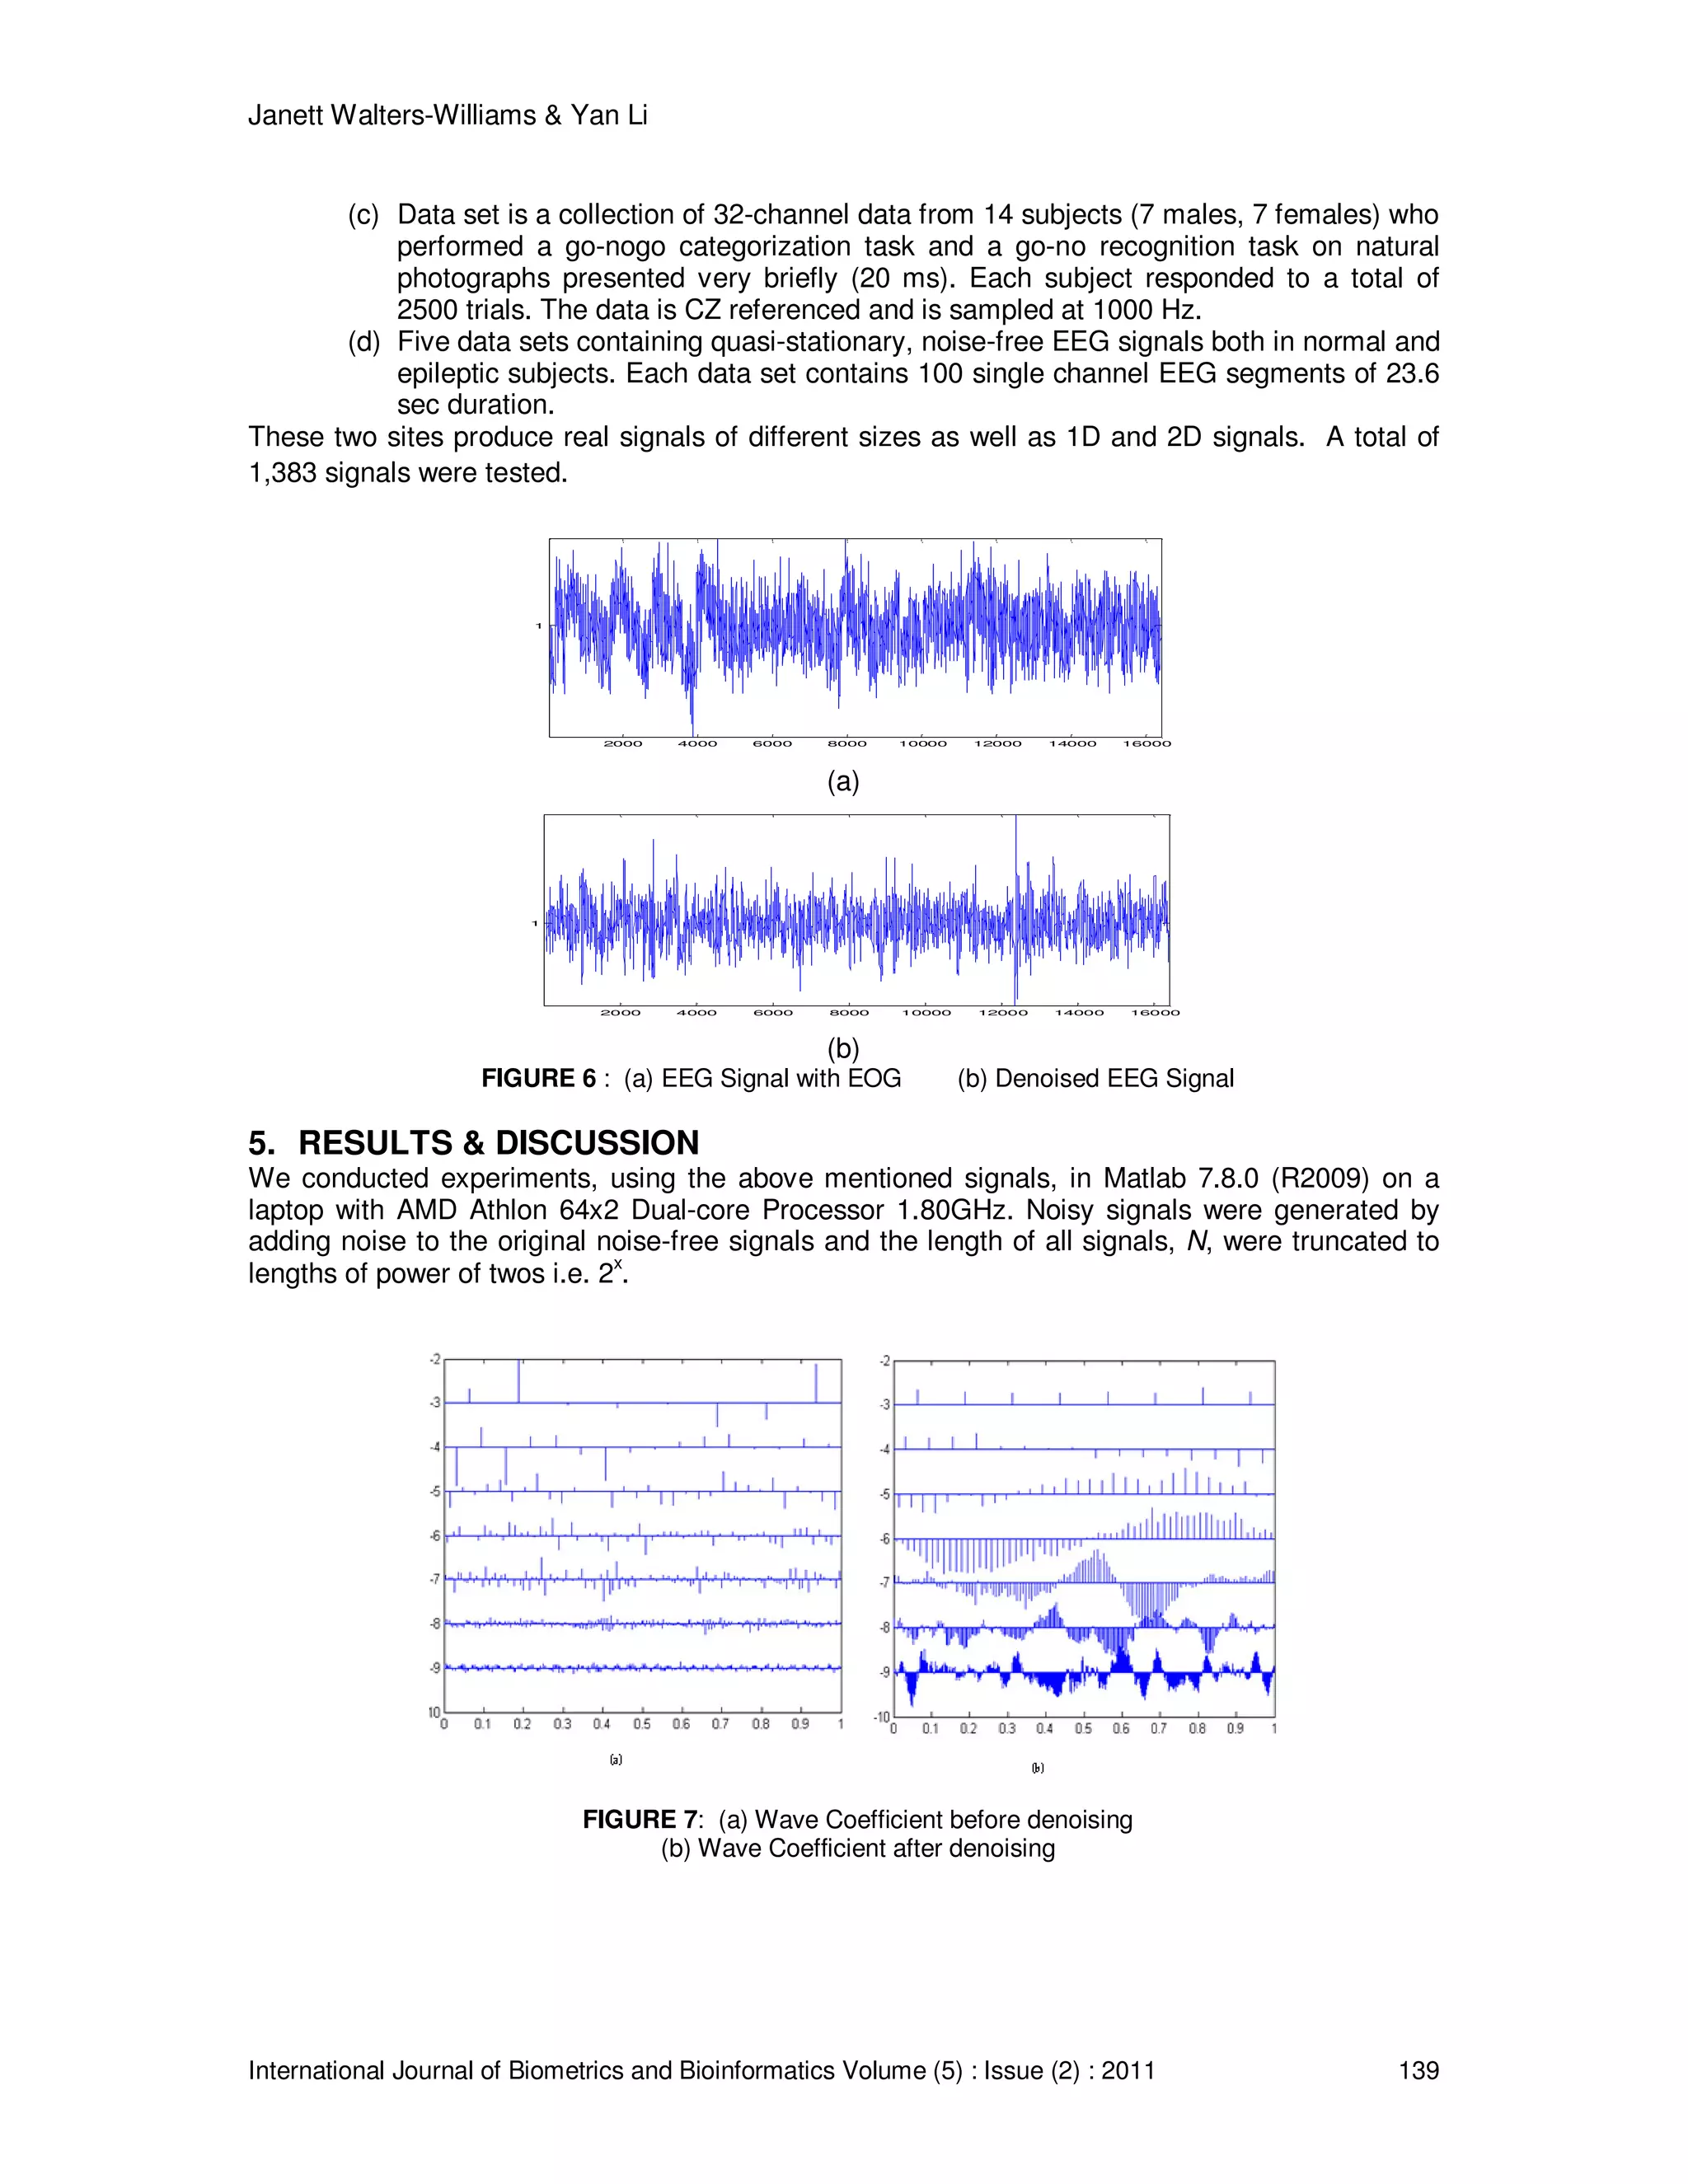
Figure 6 shows the results of the above algorithm on one EEG signal contaminated with EOG.
Investigations on the wavelet coefficients (Figure 7) also show that there are major changes in
the wavelets - some wavelets have been zeroed because of their identification to noise.
CTICA FASTICA EFICA PEARSON
1411.00 1489.70 1412.40 1337.20
950.09 1014.80 951.75 890.67
714.51 769.91 715.31 662.73
693.71 749.04 694.70 642.40
757.94 815.16 758.81 704.47
858.63 920.96 859.34 799.85
849.22 923.80 849.61 778.53
788.22 850.93 788.77 728.96
875.44 941.76 876.23 813.07
369.86 410.65 370.30 332.04
297.61 333.63 298.10 264.57
526.54 574.16 527.08 482.01
636.14 696.30 636.44 579.28
1031.70 1116.70 1032.00 950.71
236.44 269.07 236.93 206.84
383.87 424.57 384.31 346.05
650.56 598.48 651.06 598.48
694.03 752.93 694.55 638.52
577.78 646.60 577.90 513.06
449.89 504.49 450.01 398.64
TABLE 1: MSE for 15 EEG signals with EOG noise
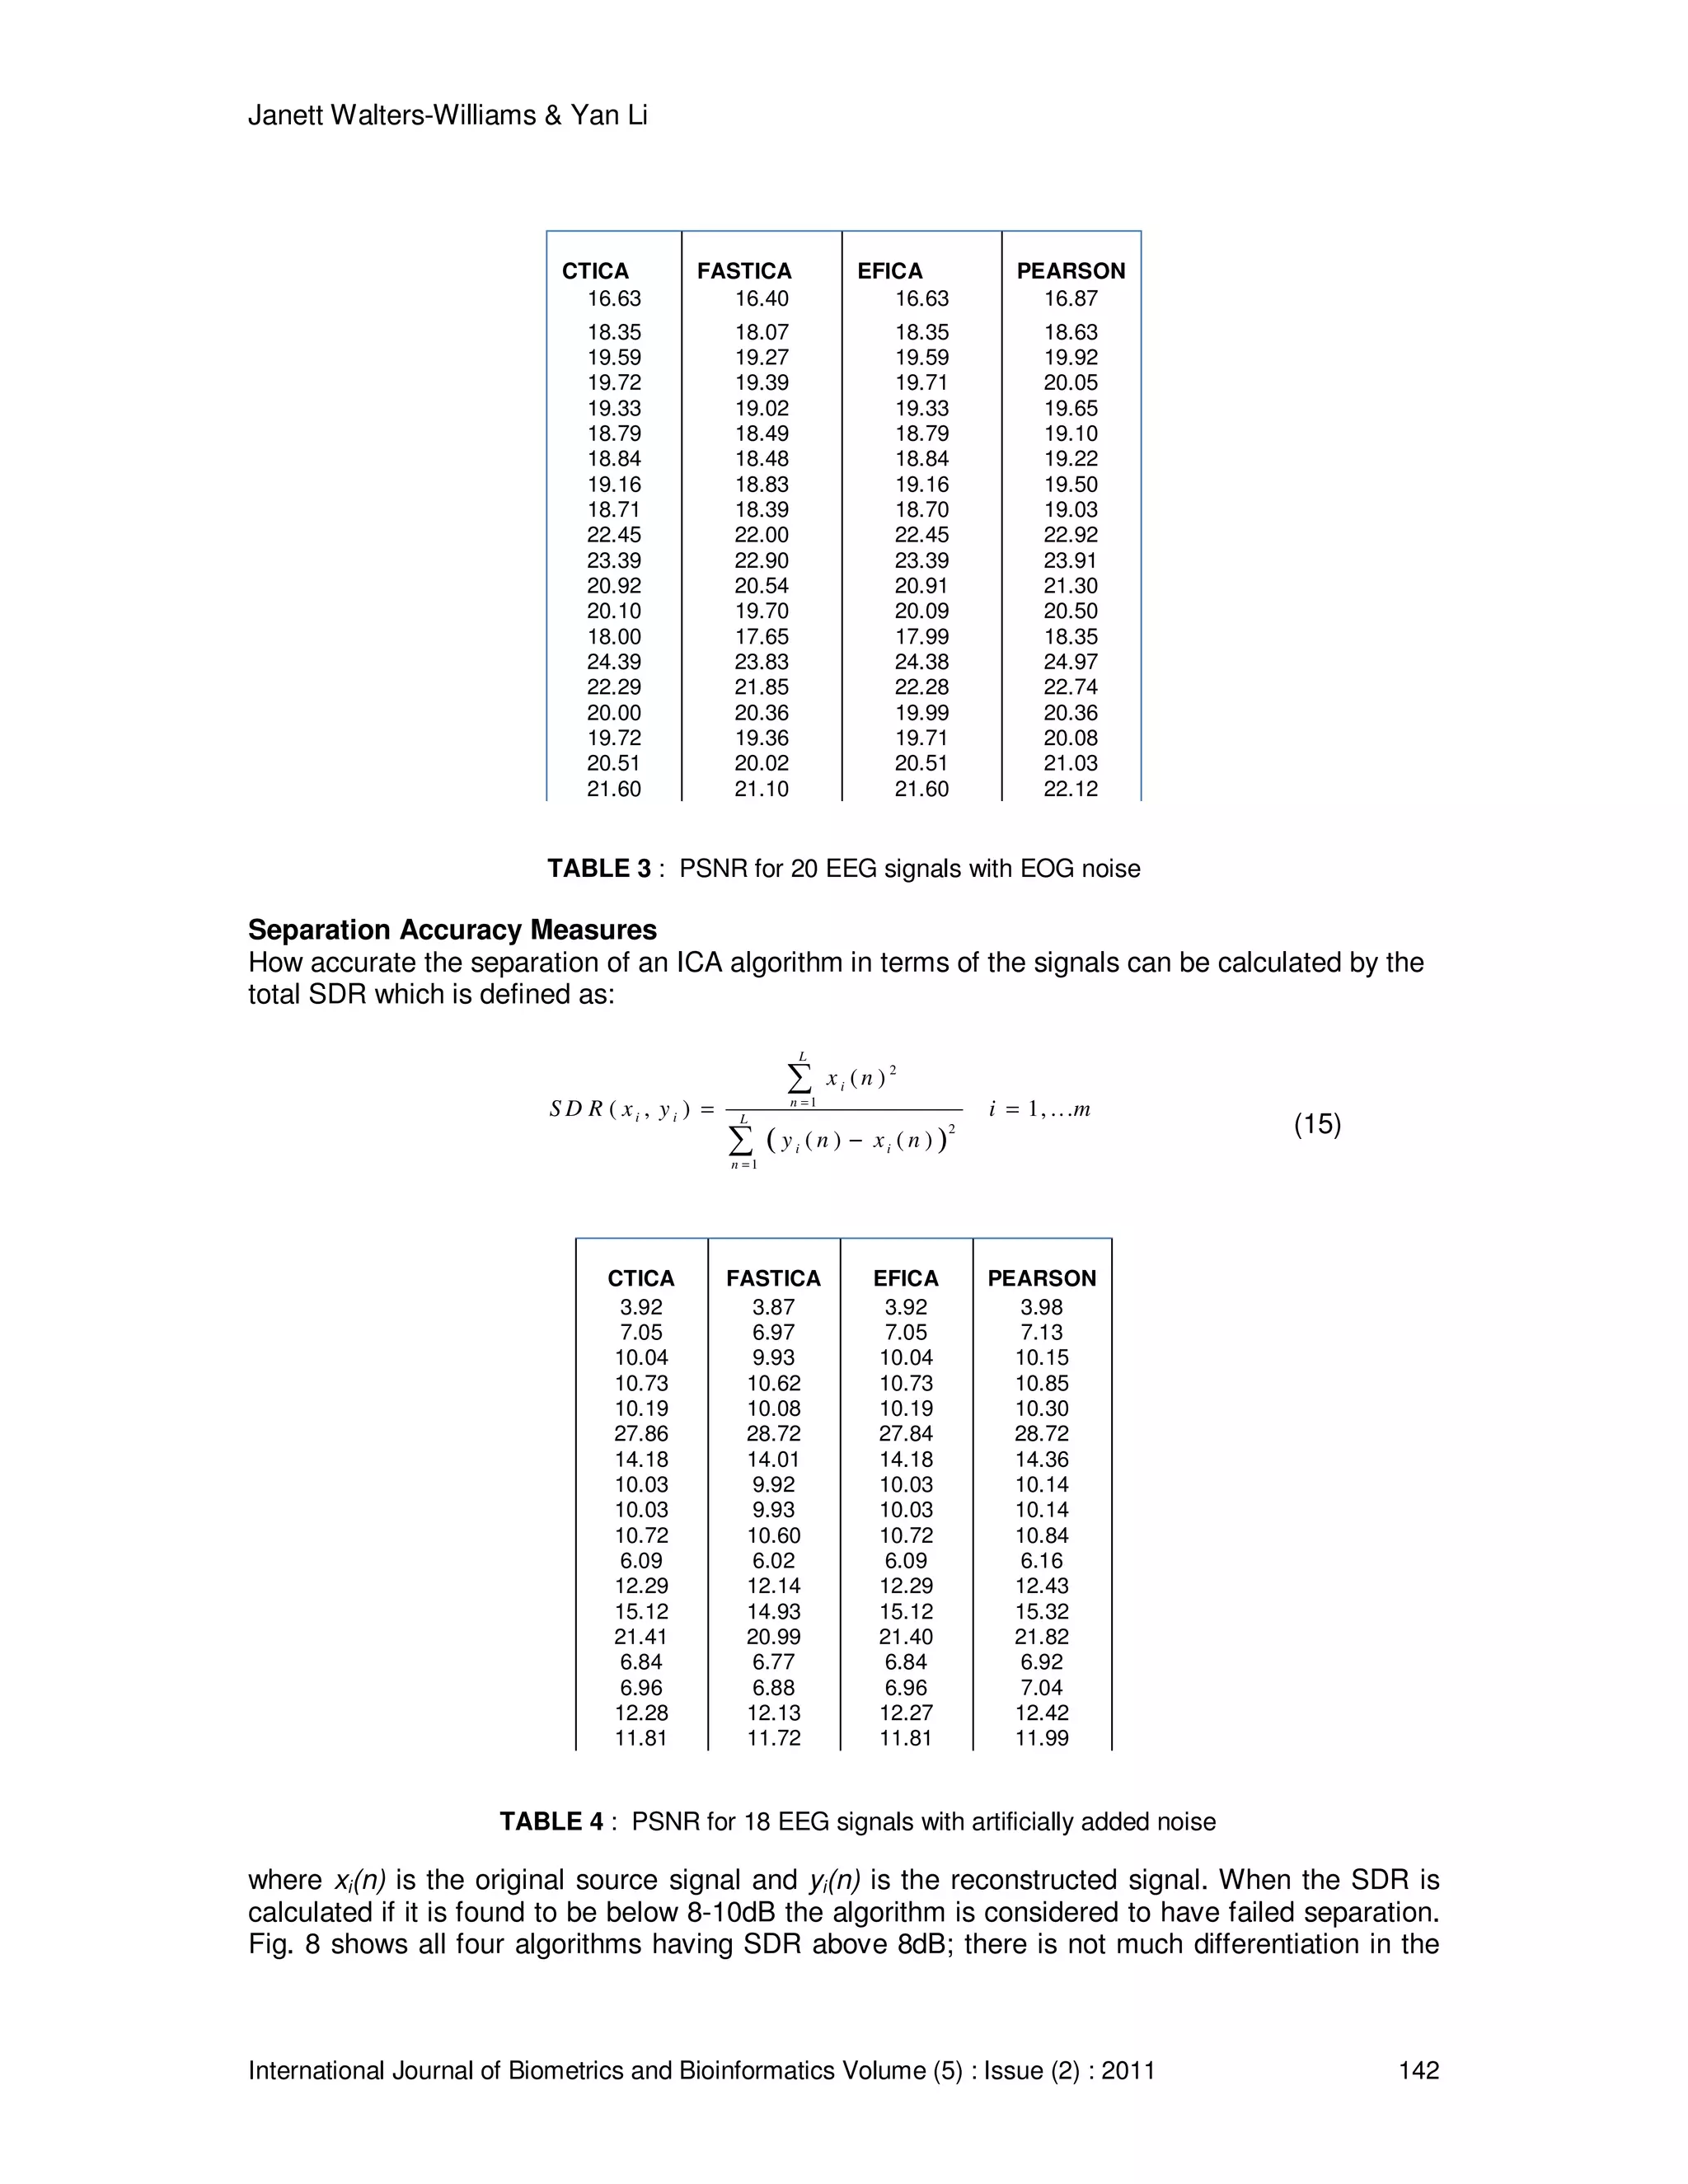
Noise/Signal Measures
The MSE measures the average of the square of the “error” which is the amount by which the
estimator differs from the quantity to be estimated. Mathematically it is defined as:
2
1 1
1
[ ( , ) '( , )]
M N
y x
MSE I x y I x y
MN = =
= −∑∑ (13)
The error is the amount by which the estimator differs from the quantity to be estimated. The
difference occurs because of randomness or because the estimator doesn't account for
information that could produce a more accurate estimate. . For a perfect fit, I(x,y) = I’(x,y) and
MSE = 0; so, the MSE index ranges from 0 to infinity, with 0 corresponding to the ideal. The
smaller the
MSE therefore the closer the estimator is to the actual data and the less the error on the signal;
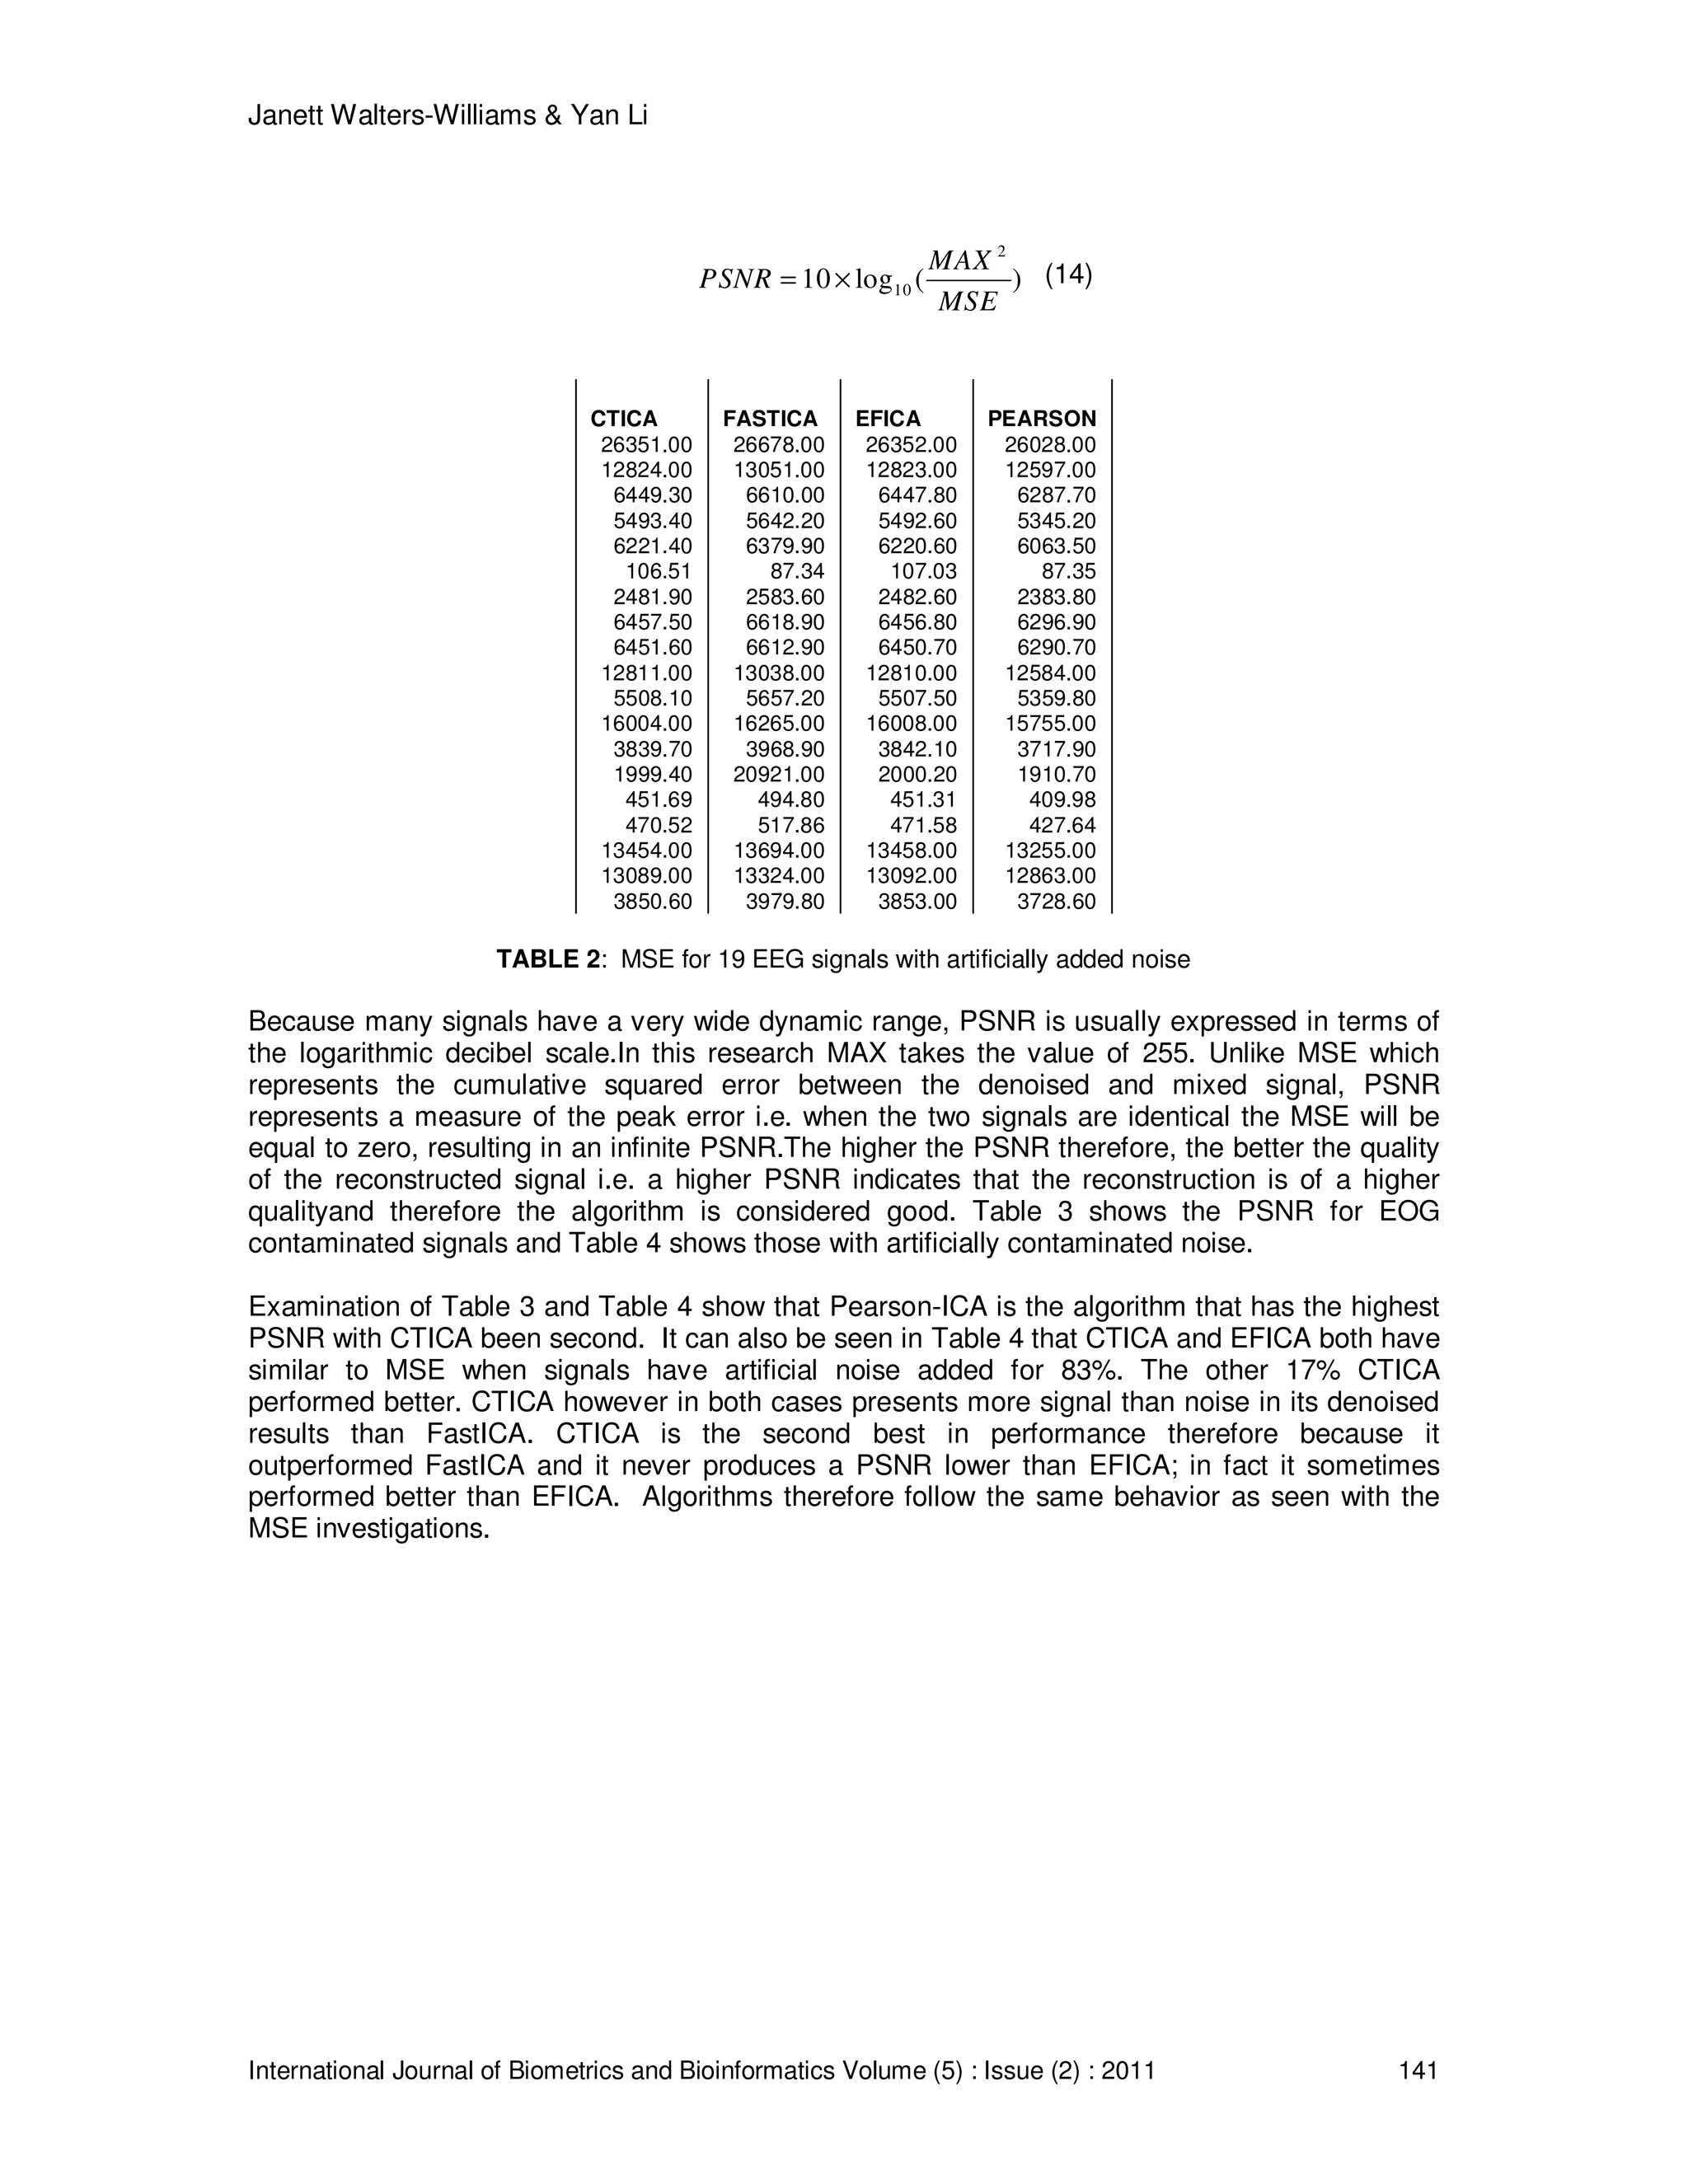
CTICA was compared in both Table 1 and Table 2. Examination shows that on average our
method had the second lowest MSE next to Pearson-ICA.
PSNR is the ratio between the maximum possible power of a signal and the power of corrupting
noise that affects the fidelity of its representation. Mathematically it is defined as:](https://image.slidesharecdn.com/ijbb-65-160207090843/75/A-New-Approach-to-Denoising-EEG-Signals-Merger-of-Translation-Invariant-Wavelet-and-ICA-11-2048.jpg)
![Janett Walters-Williams & Yan Li
International Journal of Biometrics and Bioinformatics Volume (5) : Issue (2) : 2011 145
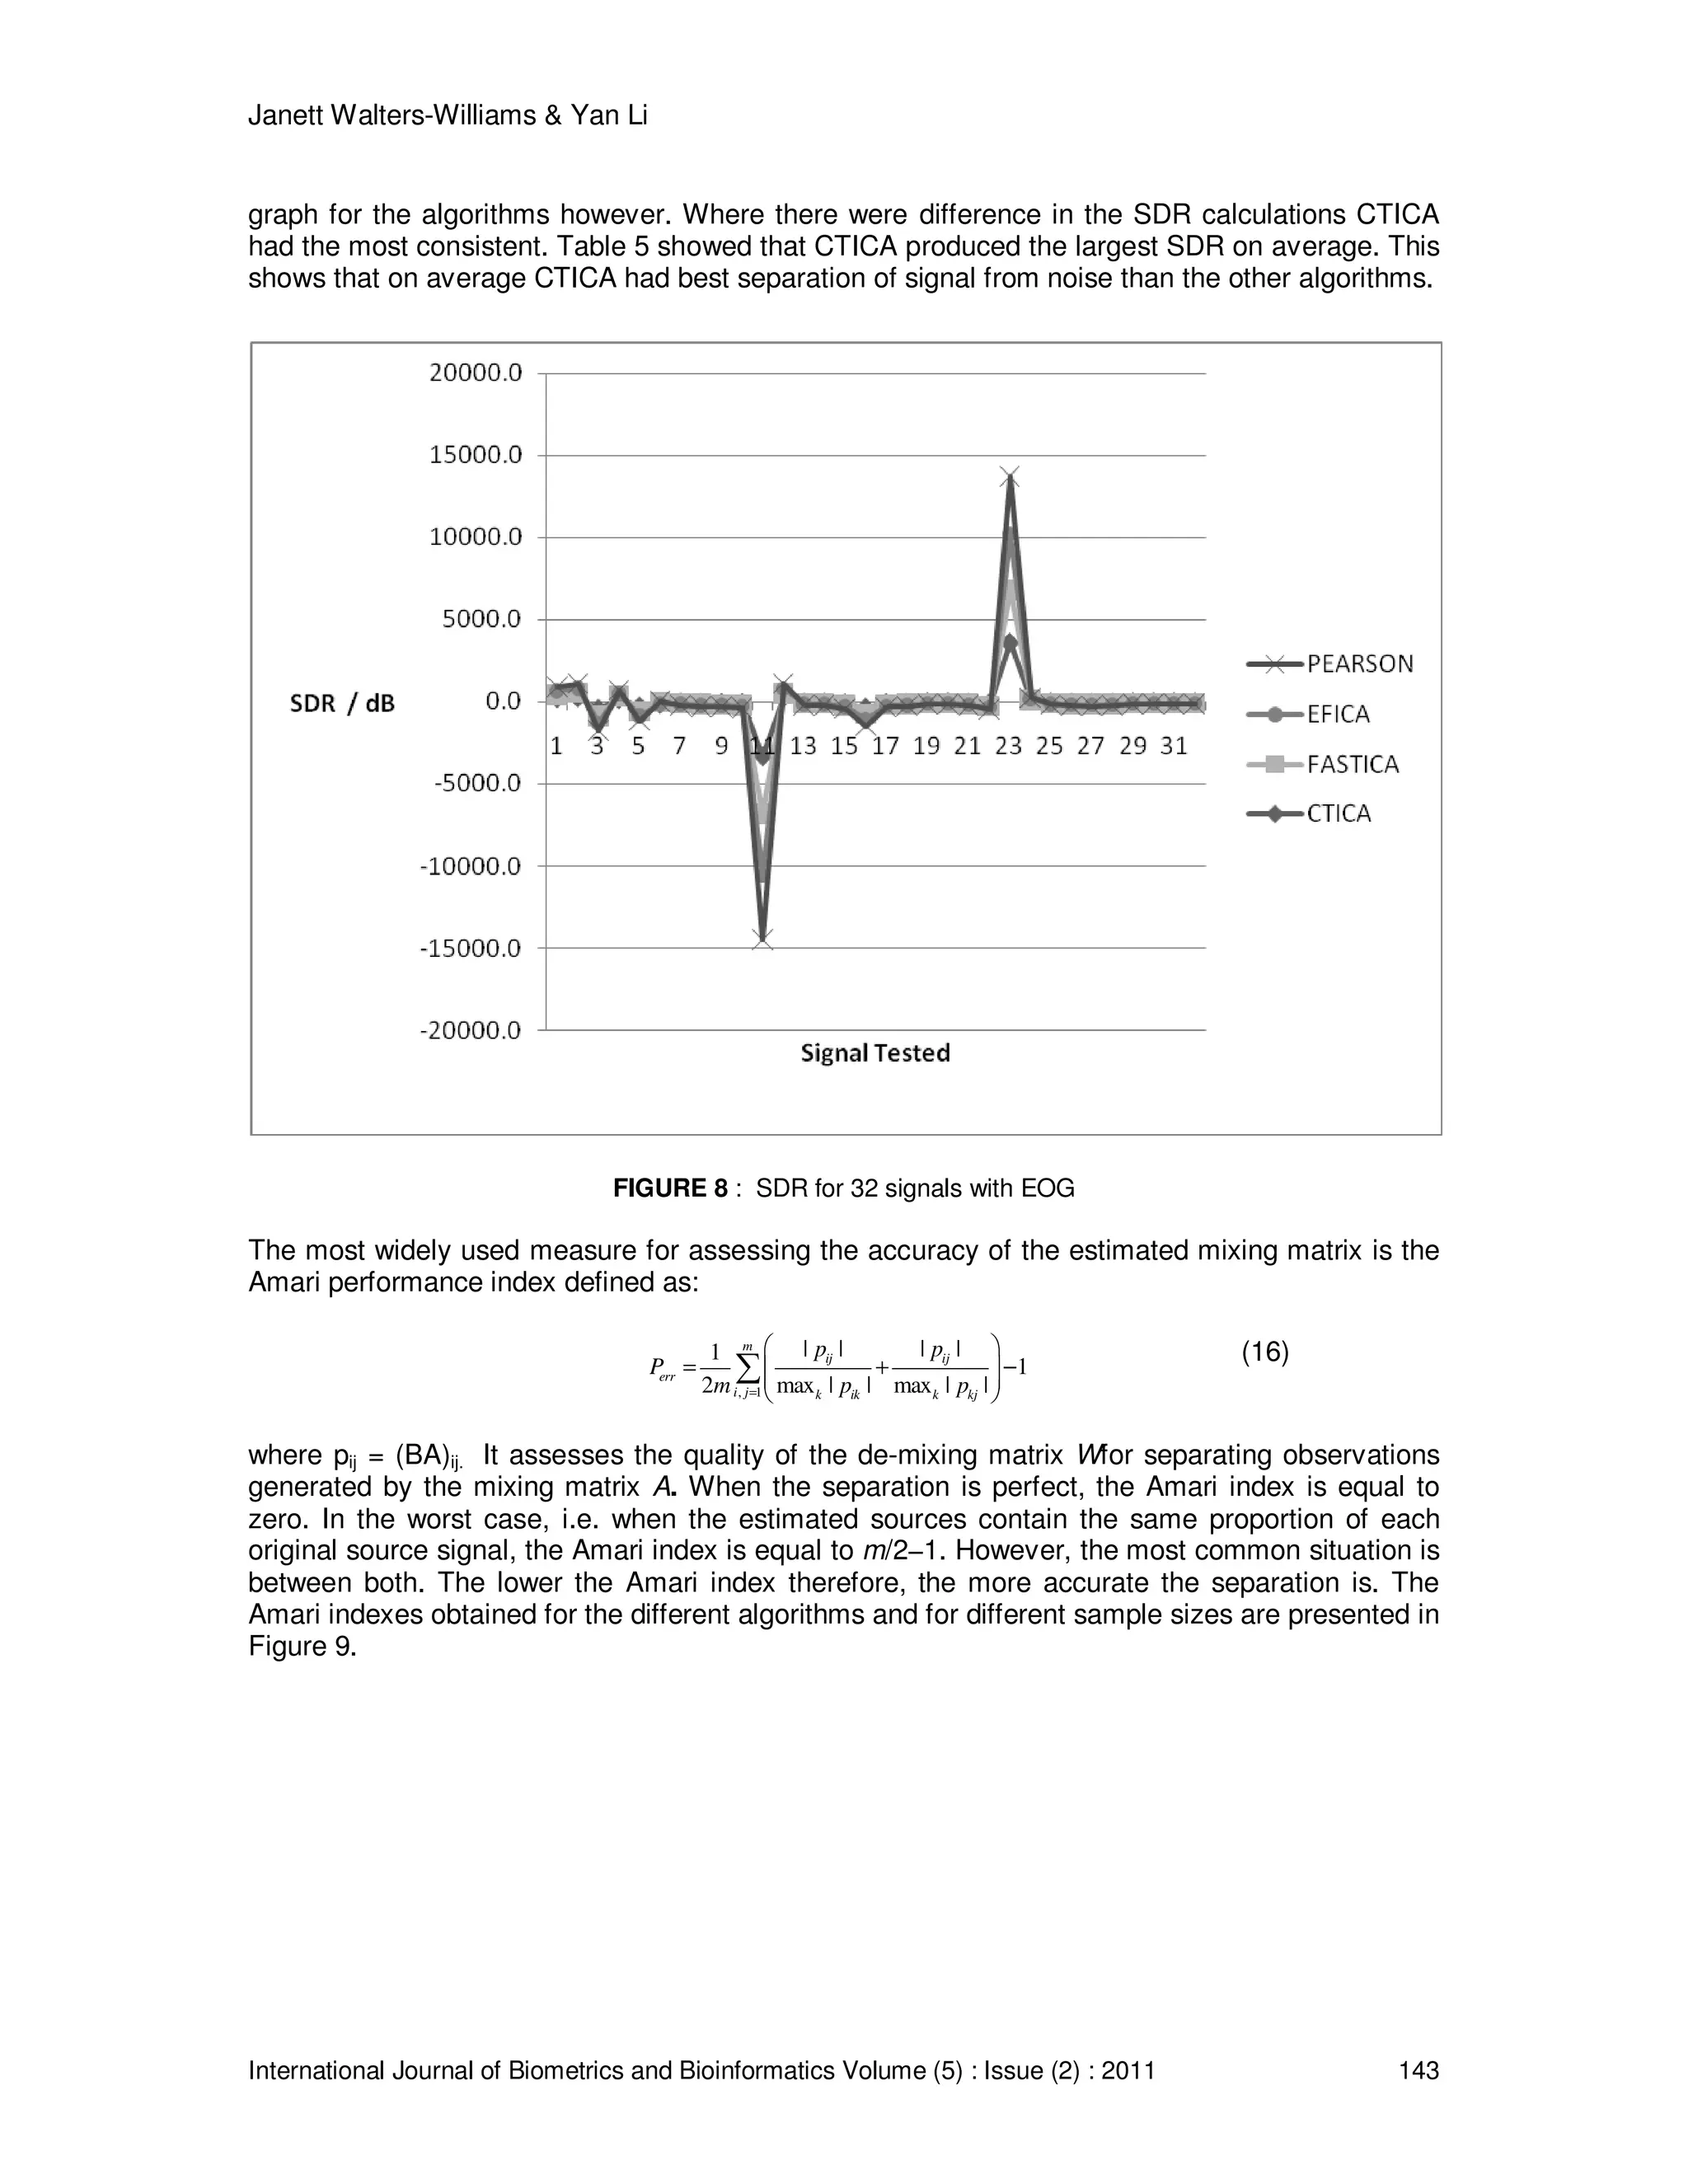
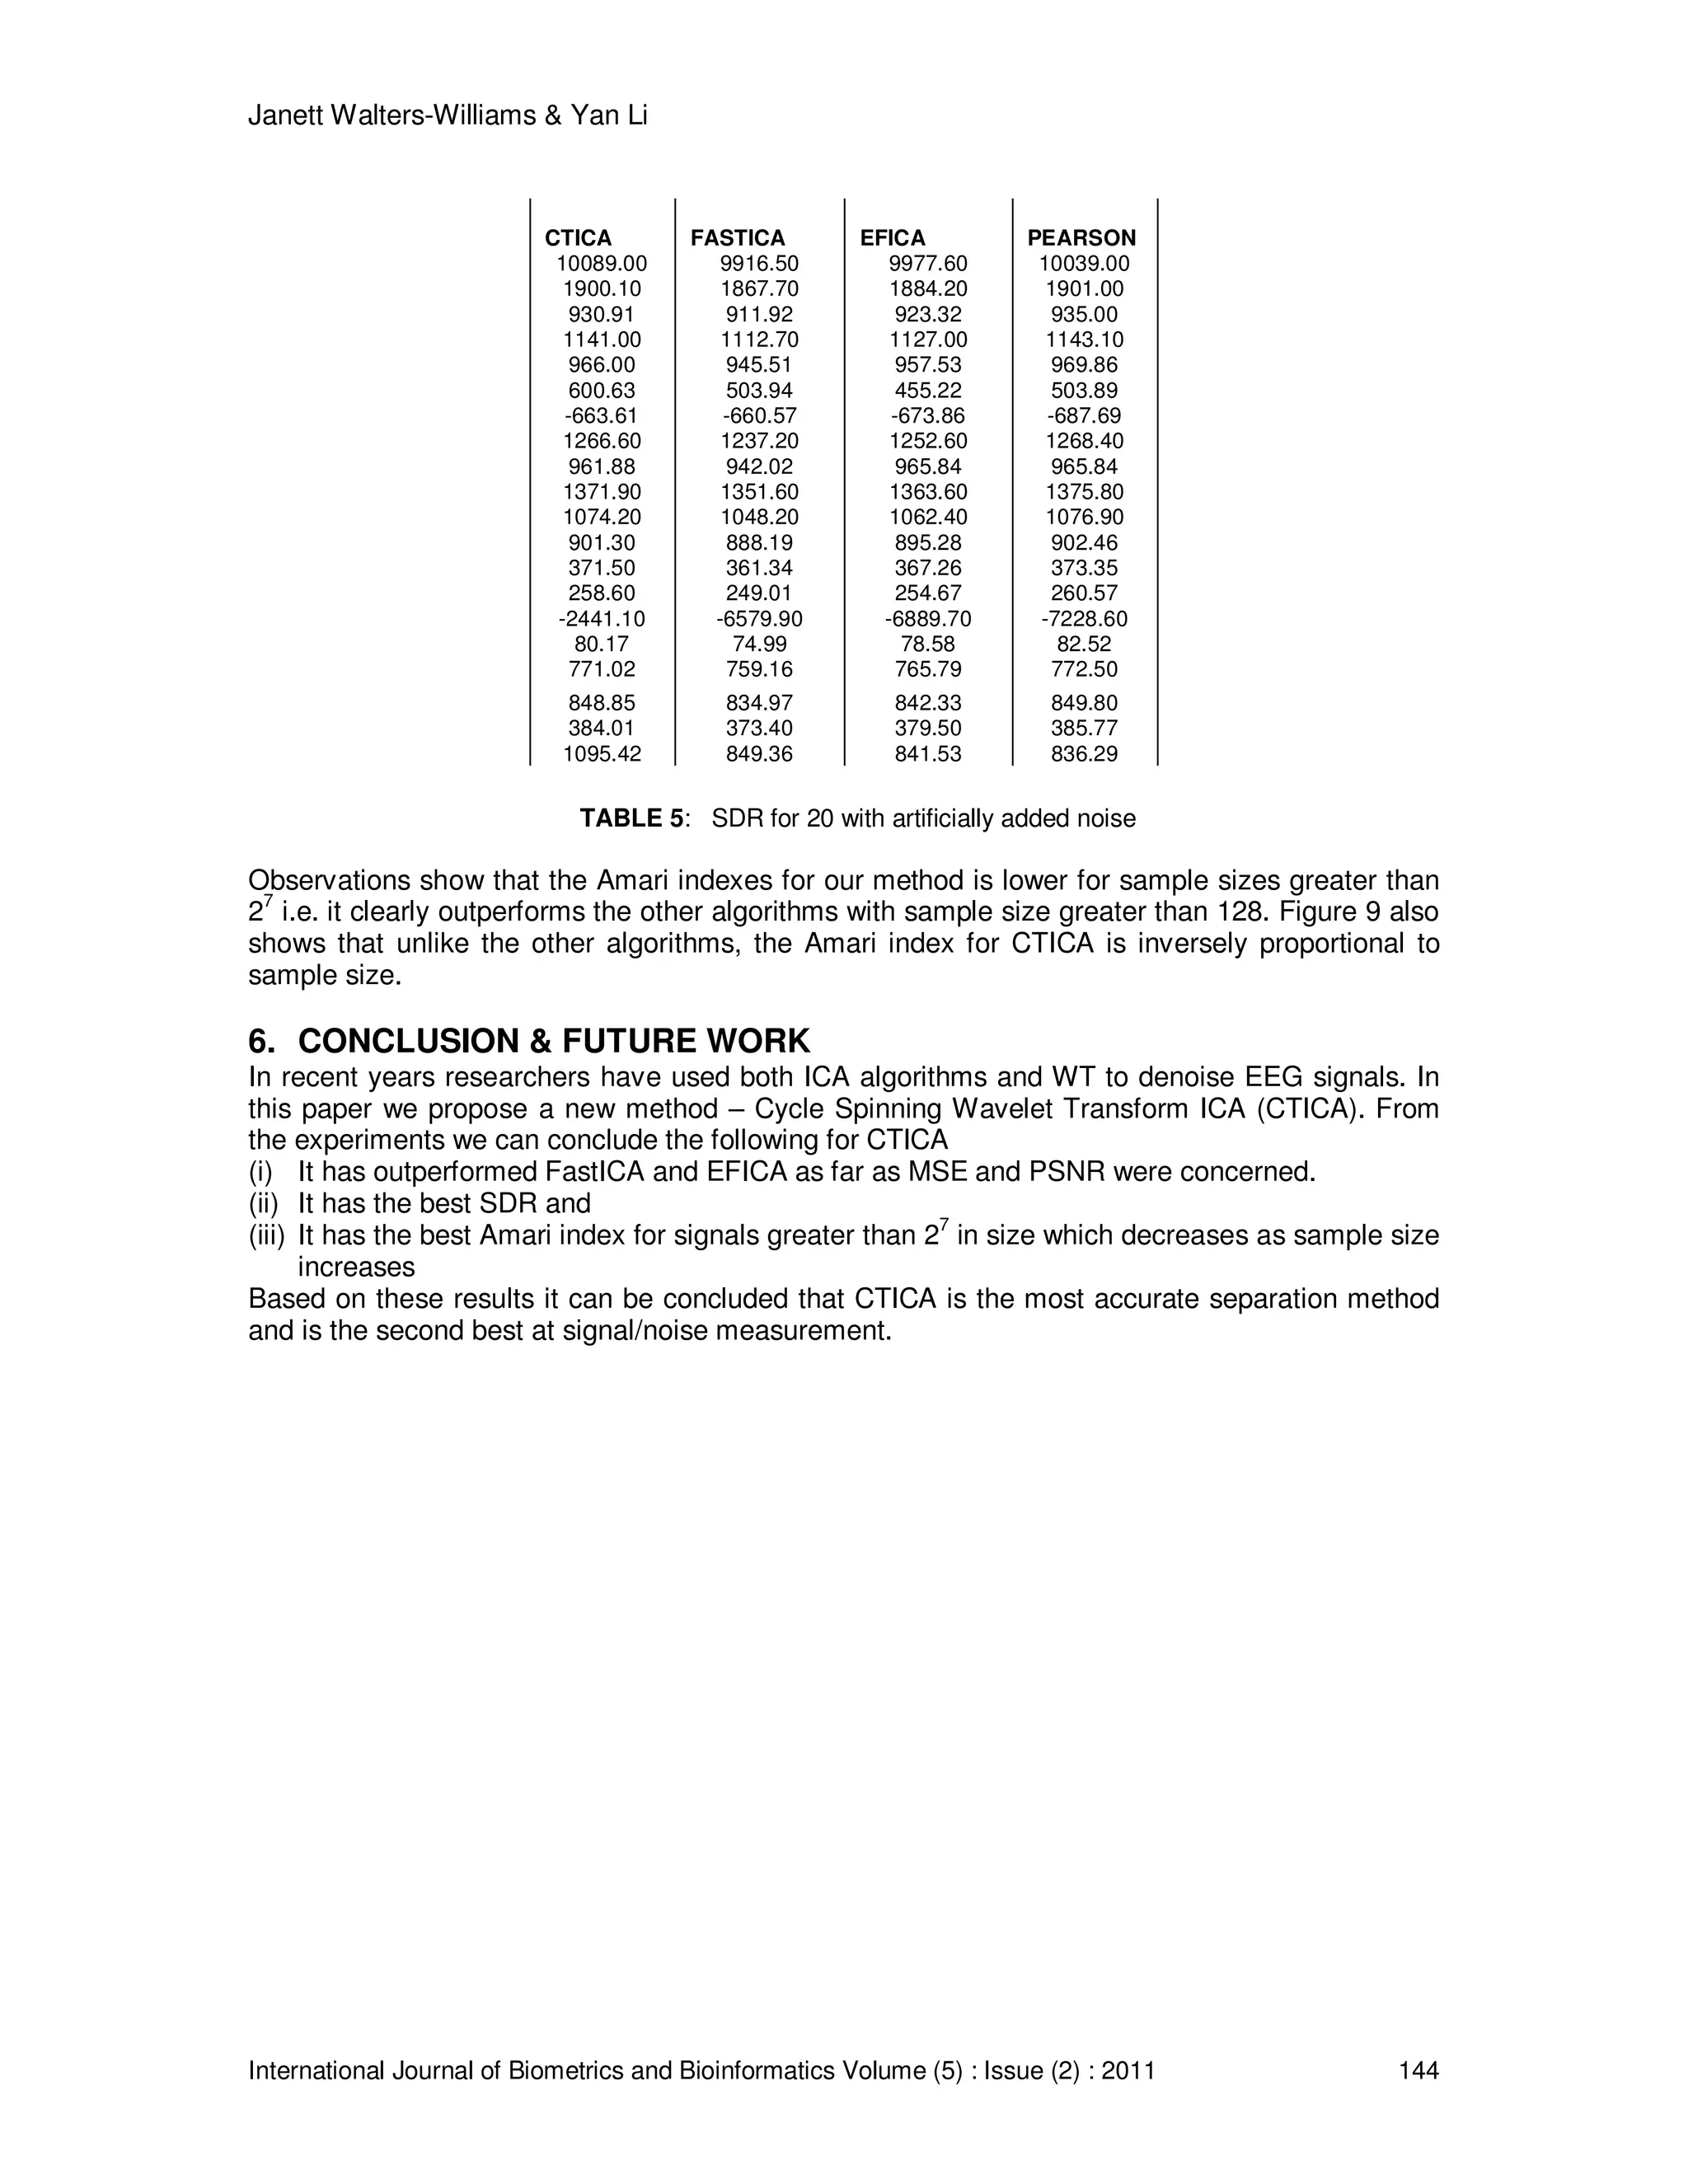
FIGURE 9: Amari Results for the four algorithms
7. REFERENCES
[1] M. Akin, “Comparison of Wavelet Transform and FFT Methods in the Analysis of EEG
Signals”, Journal of Medical Systems 26(3), 241-247, 2002.
[2] M. Alfaouri and K. Daqrouq, “ECGSignal Denoising By Wavelet Transform Thresholding”,
American Journal of Applied Sciences 5 (3), 276-281, 2008.
[3] M.I. Bhatti, A. Pervaiz and M.H. Baig, “EEG Signal Decomposition and Improved Spectral
Analysis Using Wavelet Transform”, In Proceedings of the 23
rd
Engineering in Medicine and
Biology Society 2, 2001, 1862-1864.
[4] Z. Chen, “Bayesian Filtering: From Kalman Filters to Particle Filters, and Beyond”, Adaptive
Systems Lab., McMaster University., Hamilton, Ontario, Canada, 2003, Retrieved June 20,
2009, from: http://users.isr.ist.utl.pt/~jpg/tfc0607/chen_bayesian.pdf.
[5] J. Chien; H. Hsin-Lung and S. Furui, “A new mutual information measure for independent
component analysis”, In the Proceedings of the IEEE International Conference on
Acoustics, Speech and Signal Processing, 2008 (ICASSP 2008), 2008, 1817 – 1820
[6] S. Choi, A. Cichocki, L. Zhang, and S. Amari, “Approximate Maximum Likelihood Source
Separation Using the Natural Gradient”,In the Proceedings of theIEICE Transaction
Fundamental E84A(12), 2002.
[7] R.R. Coifman, and D.L. Donoho, “Translation Invariant Denoising”,Lecture Notes in Statistics:
Wavelets and Statistics, 125-150, 1995.
[8] P. Comon, “Independent Component Analysis, a new concept?”, Signal Processing,
Elsevier, 36(3), 287-314, 1994.](https://image.slidesharecdn.com/ijbb-65-160207090843/75/A-New-Approach-to-Denoising-EEG-Signals-Merger-of-Translation-Invariant-Wavelet-and-ICA-16-2048.jpg)
![Janett Walters-Williams & Yan Li
International Journal of Biometrics and Bioinformatics Volume (5) : Issue (2) : 2011 146
[9] D.L. Donoho and I. Johnstone, “Adapting to unknown smoothness via wavelet shrinkage”,
Journal of American Statistical Association, 90,1200—1224, 1995.
[10] U.E. Emuir, A. Akin, A. Ertuzun, B. Sankur and K. Harmanci, “Wavelet Denoising vs ICA
Denoising for Functional Optical Imaging”, In the Proceedings of the 1st
International IEEE
EMBS Conference on Neural Engineering, 2003, 384-387.
[11] B. Ferguson, D. Abbott, “Denoising Techniques for Terahertz Response of Biological
Samples”, Microelectronics Journal 32, 943-953, 2001.
[12] N. Gadhok, and W. Kinsner, “Robust ICA for Cognitive Informatics”. International Journal of
Cognitive Informatics and Natural Intelligence (IJCINI) 2(4),86-92, 2008.
[13] S. P. Ghael, A. M. Sayeed and R. G. Baraniuk, “Improved Wavelet Denoising via Empirical
Wiener Filtering”, In the Proceedings of theSPIEvol. 3169, 389-399, 1997.
[14] A. Graps, An Introduction to Wavelets. IEEE Journal of Computational Science and
Engineering 2(2),1-17, 1995.
[15] Y.M. Hawwar, A.M. Reza, and R.D. Turney, Filtering(Denoising) in the Wavelet Transform
Domain,, Unpublished, Department of Electrical Engineering And Computer Science,
University of Wisconsin-Milwaukee, 2002.
[16] C.S. Herrmann, M. Grigutsch and N.A. Busch, (2005). EEG oscillations and wavelet
analysis. Event-related potentials: A methods handbook,MIT Press, 229-259, 2005.
[17] G.G. Herrero, and K. Egiazarian, “Independent Component Analysis by a Resampling
Strategy”, Technical Report 2005, Retrieved September 18, 2009,
fromhttp://www.cs.tut.fi/~gomezher/projects/bss/rica/rica.pdf
[18] S. Hoffman, and M. Falkenstien , “The Correction of Eye Blink Artefacts in the EEG: A
Comparison of a Two Prominent Methods”, PLoS One 3(8):e3004, 2008
[19] A. Hyvärinen and E. Oja, “A Fast Fixed-Point Algorithm for Independent Component
Analysis” , Neural Computation,9(7), 1483-1492, 1997
[20] A. Hyvarinen, J. Karhunen and E. Oja , Independent Component Analysis, eds. Wiley &
Sons, 2001
[21] G. Inuso, F. La Foresta, N. Mammone, and F.C. Morabito, “Wavelet-ICA methodology for
efficient artifact removal from Electroencephalographic recordings”, In the Proceedings of
the International Conference on Neural Networks,1524-1529, 2007.
[22] N. Jacob, and A. Martin, “Image Denoising in the Wavelet Domain Using Wiener Filtering”,
Unpublished course project, University of Wisconsin, Madison, Wisconsin, USA, 2004.
[23] S. Julier, and J.K. Uhlmann, “Unscented Filtering and Nonlinear Estimation”,Proceedings of
the. IEEE 92(3), 401-421, 2004.
[24] S. Julier, and J.K. Uhlmann, “A New Extension of the Kalman Filter to Nonlinear Systems”
In the Proceedingd of AeroSense: 11th Int. Symp. Aerospace/Defense Sensing, Simulation
and Controls,182-193, 1997.](https://image.slidesharecdn.com/ijbb-65-160207090843/75/A-New-Approach-to-Denoising-EEG-Signals-Merger-of-Translation-Invariant-Wavelet-and-ICA-17-2048.jpg)
![Janett Walters-Williams & Yan Li
International Journal of Biometrics and Bioinformatics Volume (5) : Issue (2) : 2011 147
[25] A. Kallapur, S. Anavatti, and M. Garratt, “Extended and Unscented Kalman Filters for
Attitude Estimation of an Unmanned Aerial Vehicle,In the Proceedings of the 27th
IASTED
Int. Conf. Modelling, Identification, and Control (MIC 2008) , 2008
[26] J. Karvanen, J.,Eriksson, and K.V. Pearson, “System Based Method for Blind Separation",
In the Proceedings of Second International Workshop on Independent Component Analysis
and Blind Signal Separation, Helsinki 2000, 585—590, 2000.
[27] L. Kaur, S. Gupta, and R.C. Chauhan, “Image Denoising using Wavelet Thresholding”, In
the Proceedings of the 3
rd
Indian Conf. Computer Vision, Graphics & Image Processing
(ICVGIP 2002), 22(14), 2002.
[28] Z. Koldovský and P. Tichavský, P., "Time-Domain Blind Audio Source Separation Using
Advanced ICA Methods", In the Proceedings of the 8th Annual Conference of the
International Speech Communication Association (Interspeech 2007), pp. 846-849, 2007.
[29] V. Krishnaveni, S. Jayaraman, A. Gunasekaran, and K. Ramadoss, Automatic Removal of
Ocular Artifacts using JADE Algorithm and Neural Network, International Journal of
Intelligent Systems and Technologies 1(4), 322-333, 2006.
[30] V. Krishnaveni, S. Jayaraman, S. Aravind, V. Hariharasudhan, and K. Ramadoss,
“Automatic Identification and Removal of Ocular Artifacts from EEG using Wavelet
Transform”,Measurement Science Review 6(2, 4), 45-57, 2006.
[31] S. Makeig, J. Anthony, A. J. Bell, T. Jung, and T.J. Sejnowski,. “Independent Component
Analysis of Electroencephalographic data”, Advances in Neural Information Processing
Systems 8, 1996.
[32] M. Mastriani, and A.E. Giraldez, “Kalman’s Shrinkage for Wavelet-Based Despeckling of
SAR Images”, International Journal of Intelligent Systems and Technologies 1(3),190-196,
2006.
[33] N. Nikolaev, A. Gotchev, “ECG Signal Denoising using Wavelet Domain Wiener Filtering” In
the Proceedings of the 10
th
European Signal Processing Conference (EUSIPCO 2000),
2000
[34] S. Postalcioglu, K. Erkan, E.D. Bolat, “Comparison of Kalman Filter and Wavelet Filter for
Denoising”, In the Proceedings of the International Conference onNeural Networks and
Brain 2005 Vol. 2, 951 – 954, 13-15 Oct. 2005
[35] V.V.K.D.V. Prasad, P. Siddaiah, and B. Prabhaksrs Rao, “A New Wavelet Based Method
for Denoising of Biological Signals”, International Journal of Computer Science and
Network Security 8(1), 2008, 238-244, 2008.
[36] R. Romo-Vazquez, R., Ranta, V. Louis-Dorr, and D. Maquin, “Ocular Artifacts Removal in
Scalp EEG: Combining ICA and Wavelet Denoising”, In the Proceedings of Physics in
Signal and Image Processing (PSISP 07), 2007
[37] R. Sameni, M.B. Shamsollahi, and C. Jutten, “Filtering Electrocardiogram Signals using the
Extended Kalman Filter”, In the Proceedings of the 27th
IEEE Engineering in Medicine and
Biology (EMBS) Annual Conference, 5639-5642, 2005.](https://image.slidesharecdn.com/ijbb-65-160207090843/75/A-New-Approach-to-Denoising-EEG-Signals-Merger-of-Translation-Invariant-Wavelet-and-ICA-18-2048.jpg)
![Janett Walters-Williams & Yan Li
International Journal of Biometrics and Bioinformatics Volume (5) : Issue (2) : 2011 148
[38] P. Senthil Kumar, R. Arumuganathan, K. Sivakumar, and C. Vimal, “A Wavelet based
Statistical Method for De-noising of Ocular Artifacts in EEG Signals”,IJCSNS International
Journal of Computer Science and Network Security. 8(9), 87-92, 2008.
[39] P. Senthil Kumar, R. Arumuganathan, K. Sivakumar, and C. Vimal, “Removal of Ocular
Artifacts in the EEG through Wavelet Transform without using an EOG Reference
Channel”, International Journal of Open Problems in Computer Science & Mathematics
1(3). 2008
[40] P. Shui, and Y. Zhao, Image Denoising Algorithm using Doubling Local Wiener Filtering
with Block Adaptive Windows in Wavelet Domain, Signal Processing 87(7), 1721-1734,
2007.
[41] L. SuWen, L, WenQing, X. PinHua, Z. YuJui, “Application of Kalman Filtering and Wavelet
Transform in DOAS”, In the Proceedings of the 2006 IEEE International Conference on
Information Acquisition, 748-753, 2006.
[42] M. Unser, and A. Aldroubi, “A Review of Wavelets in Biomedical Applications”, In the
Proceedings of the IEEE 84(4), 626-638, 1996.](https://image.slidesharecdn.com/ijbb-65-160207090843/75/A-New-Approach-to-Denoising-EEG-Signals-Merger-of-Translation-Invariant-Wavelet-and-ICA-19-2048.jpg)