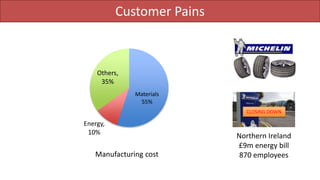
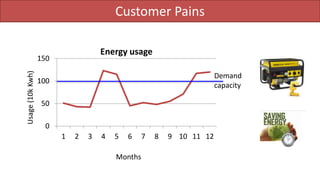
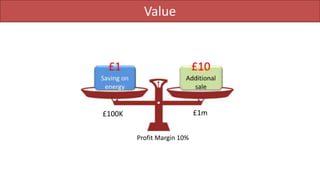
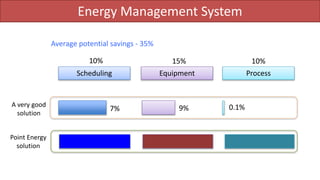
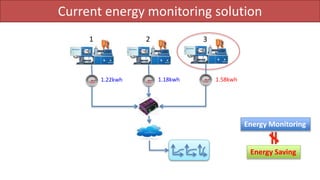
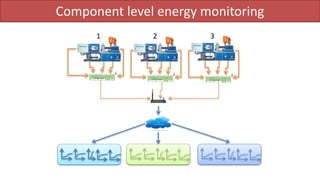
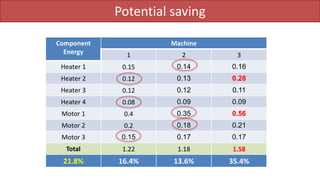
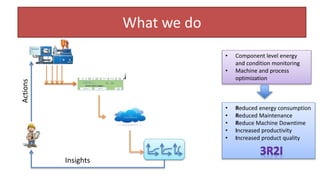
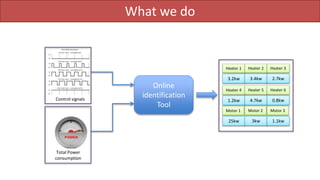
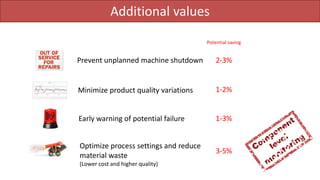
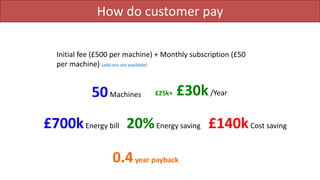
Point Energy Technology
PE Tech
Providing actionable insights that reduce your energy
costs and optimise your manufacturing processes
Dr Jing DENG
j.deng@qub.ac.uk
k.li@qub.ac.uk
Team
Dr Jing Deng Prof Kang Li
Joseph Devlin
Ronan Cunningham
Lead
Business mentor
Academic advisor
Marketing
Dr Haikuan Wang
Hardware Engineer
Shaojun Gan
Software Engineer
Customer Pains
Manufacturing cost
Northern Ireland
£9m energy bill
870 employees
CLOSING DOWN
Materials
55%
Energy,
10%
Others,
35%
Customer Pains
0
50
100
150
1 2 3 4 5 6 7 8 9 10 11 12
Energy usage
Usage(10kKwh)
Demand
capacity
Months
Value
Value
Profit Margin 10%
£100K £1m
Energy Management System
Average potential savings - 35%
Scheduling Equipment Process
10% 15% 10%
7% 9% 0.1%A very good
solution
Point Energy
solution
Current energy monitoring solution
1.22kwh 1.18kwh 1.58kwh
1 2 3
Energy Monitoring
Energy Saving
Component level energy monitoring
1 2 3
Power Logging
RS485/
RS422
RS485/
RS422
RS232 Ethernet
WIFI/
GPRS
Analog ports
CAN
Digital IOs
Smart Data Logger
Power
Supply
Power Logging
RS485/
RS422
RS485/
RS422
RS232 Ethernet
WIFI/
GPRS
Analog ports
CAN
Digital IOs
Smart Data Logger
Power
Supply
Power Logging
RS485/
RS422
RS485/
RS422
RS232 Ethernet
WIFI/
GPRS
Analog ports
CAN
Digital IOs
Smart Data Logger
Power
Supply
Potential saving
Component
Energy
Machine
1 2 3
Heater 1 0.15 0.14 0.16
Heater 2 0.12 0.13 0.28
Heater 3 0.12 0.12 0.11
Heater 4 0.08 0.09 0.09
Motor 1 0.4 0.35 0.56
Motor 2 0.2 0.18 0.21
Motor 3 0.15 0.17 0.17
Total 1.22 1.18 1.58
21.8% 16.4% 13.6% 35.4%
What we do
Power Logging
RS485/
RS422
RS485/
RS422
RS232 Ethernet
WIFI/
GPRS
Analog ports
CAN
Digital IOs
Smart Data Logger
Power
Supply
• Component level energy
and condition monitoring
• Machine and process
optimization
• Reduced energy consumption
• Reduced Maintenance
• Reduce Machine Downtime
• Increased productivity
• Increased product quality
Insights
Actions
What we do
Online
identification
Tool
Control signals
Heater 1
3.2kw
Heater 2
3.4kw
Heater 3
2.7kw
Heater 4
1.2kw
Heater 5
4.7kw
Heater 6
0.8kw
Motor 1
25kw
Motor 2
3kw
Motor 3
1.1kw
Total Power
consumption
ICURe Journey
86
Interviews
Polymer
processing
Food
processing
Steel
making
Chemical
processing
Car
Making
IT and
Automation
Energy
monitoring
ICURe Journey
Additional values
Prevent unplanned machine shutdown 2-3%
Minimize product quality variations 1-2%
Early warning of potential failure 1-3%
Optimize process settings and reduce
material waste
(Lower cost and higher quality)
3-5%
Potential saving
Additional values
ISO 14067
- Carbon Footprint
Energy
Audit
Current Market
10% Machine level energy monitoring
80% of machines are over 10 years old
Only a few new machines have component
level energy monitoring (simple display, no
logging)
Current Market
UK manufacturing industry£148 Billion
£7.4 Billion Total Energy cost 5%
£1.48 Billion 20% Saving
30% of Saving£444 Million
£22.2 Billion The world 50X
£222 Million 1% Share
Competitors
• Lack of detailed information
• Lack of actionable insights
• Saving is not significant
• Cost is too high
How do customer pay
Initial fee (£500 per machine) + Monthly subscription (£50
per machine) (add-ons are available)
50Machines
£700kEnergy bill 20%Energy saving £140kCost saving
£25k+ £30k/Year
0.4year payback
Simple 5 years plan
Sales
Year 1 Year 2 Year 3 Year 4 Year 5
Customer 10 30 80 150 300
Sale £550,000.00 £1,400,000.00 £3,650,000.00 £6,250,000.00 £12,750,000.00
Cost
Year 1 Year 2 Year 3 Year 4 Year 5
Employee 5 10 15 25 50
Wages £175,000.00 £380,000.00 £615,000.00 £1,050,000.00 £2,150,000.00
Hardware £50,000.00 £100,000.00 £250,000.00 £350,000.00 £750,000.00
Marketing £10,000.00 £15,000.00 £25,000.00 £40,000.00 £80,000.00
Others £20,000.00 £30,000.00 £50,000.00 £80,000.00 £12,000.00
Total £255,000.00 £525,000.00 £940,000.00 £1,520,000.00 £2,992,000.00
Profit £295,000.00 £875,000.00 £2,710,000.00 £4,730,000.00 £9,758,000.00
Next Step
• Form a spin-out
• No more research and development is needed
• Time is important
• IP protection is to be considered
We can start the business now
Trials are being set up in 3 local companies
Thanks!

I cure option roundabout haikuan

  • 1.
    Point Energy Technology PETech Providing actionable insights that reduce your energy costs and optimise your manufacturing processes Dr Jing DENG j.deng@qub.ac.uk k.li@qub.ac.uk
  • 2.
    Team Dr Jing DengProf Kang Li Joseph Devlin Ronan Cunningham Lead Business mentor Academic advisor Marketing Dr Haikuan Wang Hardware Engineer Shaojun Gan Software Engineer
  • 3.
    Customer Pains Manufacturing cost NorthernIreland £9m energy bill 870 employees CLOSING DOWN Materials 55% Energy, 10% Others, 35%
  • 4.
    Customer Pains 0 50 100 150 1 23 4 5 6 7 8 9 10 11 12 Energy usage Usage(10kKwh) Demand capacity Months
  • 5.
  • 6.
  • 7.
    Energy Management System Averagepotential savings - 35% Scheduling Equipment Process 10% 15% 10% 7% 9% 0.1%A very good solution Point Energy solution
  • 8.
    Current energy monitoringsolution 1.22kwh 1.18kwh 1.58kwh 1 2 3 Energy Monitoring Energy Saving
  • 9.
    Component level energymonitoring 1 2 3 Power Logging RS485/ RS422 RS485/ RS422 RS232 Ethernet WIFI/ GPRS Analog ports CAN Digital IOs Smart Data Logger Power Supply Power Logging RS485/ RS422 RS485/ RS422 RS232 Ethernet WIFI/ GPRS Analog ports CAN Digital IOs Smart Data Logger Power Supply Power Logging RS485/ RS422 RS485/ RS422 RS232 Ethernet WIFI/ GPRS Analog ports CAN Digital IOs Smart Data Logger Power Supply
  • 10.
    Potential saving Component Energy Machine 1 23 Heater 1 0.15 0.14 0.16 Heater 2 0.12 0.13 0.28 Heater 3 0.12 0.12 0.11 Heater 4 0.08 0.09 0.09 Motor 1 0.4 0.35 0.56 Motor 2 0.2 0.18 0.21 Motor 3 0.15 0.17 0.17 Total 1.22 1.18 1.58 21.8% 16.4% 13.6% 35.4%
  • 11.
    What we do PowerLogging RS485/ RS422 RS485/ RS422 RS232 Ethernet WIFI/ GPRS Analog ports CAN Digital IOs Smart Data Logger Power Supply • Component level energy and condition monitoring • Machine and process optimization • Reduced energy consumption • Reduced Maintenance • Reduce Machine Downtime • Increased productivity • Increased product quality Insights Actions
  • 12.
    What we do Online identification Tool Controlsignals Heater 1 3.2kw Heater 2 3.4kw Heater 3 2.7kw Heater 4 1.2kw Heater 5 4.7kw Heater 6 0.8kw Motor 1 25kw Motor 2 3kw Motor 3 1.1kw Total Power consumption
  • 13.
  • 14.
  • 15.
    Additional values Prevent unplannedmachine shutdown 2-3% Minimize product quality variations 1-2% Early warning of potential failure 1-3% Optimize process settings and reduce material waste (Lower cost and higher quality) 3-5% Potential saving
  • 16.
    Additional values ISO 14067 -Carbon Footprint Energy Audit
  • 17.
    Current Market 10% Machinelevel energy monitoring 80% of machines are over 10 years old Only a few new machines have component level energy monitoring (simple display, no logging)
  • 18.
    Current Market UK manufacturingindustry£148 Billion £7.4 Billion Total Energy cost 5% £1.48 Billion 20% Saving 30% of Saving£444 Million £22.2 Billion The world 50X £222 Million 1% Share
  • 19.
    Competitors • Lack ofdetailed information • Lack of actionable insights • Saving is not significant • Cost is too high
  • 20.
    How do customerpay Initial fee (£500 per machine) + Monthly subscription (£50 per machine) (add-ons are available) 50Machines £700kEnergy bill 20%Energy saving £140kCost saving £25k+ £30k/Year 0.4year payback
  • 21.
    Simple 5 yearsplan Sales Year 1 Year 2 Year 3 Year 4 Year 5 Customer 10 30 80 150 300 Sale £550,000.00 £1,400,000.00 £3,650,000.00 £6,250,000.00 £12,750,000.00 Cost Year 1 Year 2 Year 3 Year 4 Year 5 Employee 5 10 15 25 50 Wages £175,000.00 £380,000.00 £615,000.00 £1,050,000.00 £2,150,000.00 Hardware £50,000.00 £100,000.00 £250,000.00 £350,000.00 £750,000.00 Marketing £10,000.00 £15,000.00 £25,000.00 £40,000.00 £80,000.00 Others £20,000.00 £30,000.00 £50,000.00 £80,000.00 £12,000.00 Total £255,000.00 £525,000.00 £940,000.00 £1,520,000.00 £2,992,000.00 Profit £295,000.00 £875,000.00 £2,710,000.00 £4,730,000.00 £9,758,000.00
  • 22.
    Next Step • Forma spin-out • No more research and development is needed • Time is important • IP protection is to be considered We can start the business now Trials are being set up in 3 local companies Thanks!

Editor's Notes

  • #2 Good afternoon everybody, my name is Jing Deng, I am the junior researcher on point energy team. We are about to provide a solution for energy intensive manufacturers to visualize their energy usage in a detailed and granular manner, Providing actionable insights to reduce their energy costs and optimise their manufacturing proceses
  • #3 Our team includes me as the lead, the senior researcher is Prof Kang Li, business mentor Ronan Cunningham, Joseph Devlin is willing to do the marketing, Dr Haikuan Wang is a hardware engineering, and Mr Gan responsible for software platform.
  • #4 So let me start with the customer pains I learned from this ICURe journey. This pie chart show a typical cost structure from energy intensive manufacturing companies – e.g., food and plastics processing, from here you can see that the average energy cost is about 10% of the overall costs. This figure can be even higher, for example 50% for cement manufacturing. It is well known that energy price is still going up due to more strict legislation on emissions. Therefore, reducing energy usage becomes vital for sustainable manufacturing. One example is a tyre manufacturer called Michelin in Northern Ireland, where their energy bill is about £9m per year. This make them no longer competitive in the marketplace and they have decided to shut down this factory in 2018 with the possible future loss of almost 900 jobs.
  • #5 Another pain within manufacturing industry is the demand capacity. This is the maximum power a company can draw from the network without paying expensive premium. This capacity limit is due to the grid infrastructure constrains and carbon emission legislation. However, many companies may need extra power from time to time, particularly when they are growing their business. To avoid paying such expensive premium, some companies choose to install on-site generation. Which, However, is also expensive and it is only a short term solution. Improving the energy efficiency at the level of 20-30% using our technology, All these problems can be eliminated or at least alleviated.
  • #6 The value for saving energy is obviously the reduced manufacturing cost. But if you linked this saving to the company profit, it becomes more significant
  • #7 For example, a company’s profit margin can be at the level of 10%, that means every £1 saving is equivalent to the effect of £10 of additional sales. For typical medium size manufacturer, their annual energy bills are typically £500k, and if proper action has been taken place to monitor and manage the energy usage, they can easily achieve £100k saving from energy cost. If this value were to be achieved through sales, the company would have to increase their sales by £1m. which is much harder and more costly to achieve than reducing their energy usage..
  • #8 Overall, our market survey found that an average of 35% energy savings can be achieved for the majority of manufacturing companies, through three aspects, namely Scheduling, equipment, and process. Scheduling is about planning the use of energy wisely and effectively to avoid high energy tariff and reduce peak consumption, which can achieve about 10% energy saving; equipment upgrading or retrofitting can save about to 15% energy cost, but expensive to implement; Process optimization can achieve about 10% energy saving, but it requires detailed process information, specialized knowledge, and advanced data analysis. Some solutions are available in the market, which help customers to monitor and reduce energy consumption at different level of details and costs, but the majority lacks of detailed information and data analysis, their savings are very limited. Especially on the process optimization. Point Energy offers a solution that can maximise energy savings in each of these three elements, particularly on the equipment and process, and we have over 20 years of research and innovation track record on process modelling and optimization, winning a number of prizes and awards.
  • #9 To illustrate the current market solutions. Let’s take a look at an example of a company with three machines to make the same parts. The current market solution to monitor energy usage at machinery level includes a power meter attached to each machine, a data logger used to collect energy data, and sent to a server, and some graphs or interfaces to show energy usage. The monitoring system shows the first machine used 1.22 kwh in production, the second machine used 1.18kwh to perform the same job, while the third machine use a lot more power. The current solution doesn’t tell why the third machine use more energy than others and does not provide any actionable insights to reduce the high energy consumption. In summary, current energy monitoring solution does not guarantee energy saving.
  • #10 The Point energy technology is differently from others. We record more signals from the machine, that is, we do component level monitoring, and we do it in a simple and cost effectively way using our hardware and software technologies.
  • #11 At the component level, we calculate the energy consumption of each energy intensive unit, here each machine has 4 heaters and 3 motors. By using component level energy monitoring, it shows that second heater and first motor of the 3rd machine use more energy than normal. This might indicate that the third machine needs urgent maintenance and that the second heater and 1st motor are the components to check first. So this actionable insights will help to reduce energy consumption at machine 3. Now, if we take a look at each component from different machines, it shows energy usage varies. If we take actions to improve their efficiency, some extra saving can also be achieved on the first and second machine. This cannot be achieved by simply machine level energy monitoring.
  • #12 So what our system looks like, it has a low-cost data logger which connect to machine either through communication or own customized clip sensors. The collected data is then sent to a cloud server which is normally hosted by us, but it can also be in our customers’ own server due to the confidentiality. The Server carries out analysis based on rich information received, and provide actionable insights for production manger or machine maintenance engineers to take proper actions. We provide component level energy and condition monitoring, and machine and process optimization, and the benefits to our customers are what we have called 3R2I. The 3R2I is …..
  • #13 Different from all existing solutions, we collect control signals from the machine. These signals can either be measured physically through our own low-cost and non-invasive clip sensors, or obtained directly from the communication port of the machines. Combining these data with the total power usage, the energy consumption from each energy intensive part is interpreted through our unique online identification tools, This is based on our 20 years of research and innovation track records, which won a number of prizes and awards. Through these we provide the insights required.
  • #14 So to validate our assumptions, I have managed to speak over 150 people and carried out 86 detailed interview, covering different manufacturing sectors of different size and nature, such as polymer processing and food processing, as well as energy service companies to understand what their solution looks like, what is the size of their market, and what their customers paid.
  • #15 And this slide shows different companies I have spoken to during my ICURe journey
  • #16 From this market exploitation, I also identified some additional values that our solutions benefit the industry. These includes, 1,2,3,4, and the estimated additional savings range from 7% to 13%. All these benefits can only be achieved at component level energy monitoring using our technologies, which is unique.
  • #17 To meet regulations and legislations, some companies also spent lots of money on energy audit, and get ISO certificate which is related to quality and energy management. Our system would help this as it records detailed and relevant data that would help companies for preparing their ISO accreditation or energy audit.
  • #18 So what is the market size. Currently, only 10% of manufacturing companies monitor energy usage at machine level. This means that 90% of energy intensive manufacturing companies have no real insight into their energy consumption and no understanding of how to change the situation. More than 80% of the machines in many factories, in particular SMEs are more than 10 years old, have no built-in capability to provide the required information, and the efficiency can be low, and maintenance costs tend to be increased. Among the new machines, only a significantly smaller percentage are capable of monitoring energy use at the component level. Even given this, the usage of these information is very limited.
  • #19 The UK manufacturing industry has a total turnover of £148b. The average energy cost is 5% of the turnover. If an average of 20% savings is achieved using OUR Technology, and we only request 30% of the savings from our customers, this leads to a £444 Million market in UK on energy saving. The world manufacturing is 50 times larger than UK, and if we only take 1% share of the energy saving market, the space for us is £222 million per year. Obviously, this is not immediately possible but a significant and substantial market to aim for.
  • #20 Of course there are some competitors in this market, each has its own specialized market, some provide more advanced solution than others, and their values for customer varies significantly. Generally, these solution cannot achieve the best energy saving due to lack of detailed information, lack of actionable insights, and their cost is normally too high in this market.
  • #21 Based on our survey data, we propose a simple yet realistic payment structure which is £500 of initial installation fee per machine, and £50 of monthly subscription fee per machine. The cost is very competitive than other solution providers, and more importantly, our technologies offers much better solutions than our competitors. A typical medium sized manufacturing company has 50 machines, their annual energy bill is about £700k. If they pay £25k installation fee plus £30k service fee annually, we can help them to save an average of 20% energy cost, this ends up with £140k saving per annual. The payback is less than half year, and we only take a small portion of their savings.
  • #22 Based on the revenue structure, I make a simple 5 years plan. Within 5 years, we plan to achieve a profit of nearly £10 millions.
  • #23 The next step for us is to form a spin-out company and run the business ASAP. We don’t need more R&D, we have done this in our previous POC project and three trials are being setup in 3 local companies. Timing is important for us as the market needs this solution urgently, not only in UK and other developed countries, more urgently from developing countries like China and India. We will consider IP protection seriously in the near future. (Licensing is not an option as energy saving market is customer specific service, each customer has their unique situation which cannot be covered by single technology. )