Download to read offline
![Solution “Typical”
Payback
(Months)
Energy
Savings
(%)
Advantages Considerations
Automatic
Monitoring and
Targetting (aM&T)
3 to 12 3 - 10% of
total utility use
Highly useful for effective energy
management
Critical information for employee
engagement programmes
Can identify low, medium, high cost
opportunities for energy and utility
consumption
Can identify exceptional consumptions
immediately
High quality performance reporting
Need to consider means for
collecting data
Essential to have appropriate
reporting and processes
Level of sophistication tailored to
energy spend
Resource support considerations
High efficiency
motors
3 to 12 2 - 5% Improved intrinsic efficiency
Direct replacements for standard motors
Implement as part of a motor
management programme
Efficiency level IE2 is mandatory from
June 11
Not necessary for very light duty
applications (say less than 1000
hours per year)
May not be suitable for high torque
applications - e.g. Crushers in the
aggregates industry
Appropriate alignment (laser) should
be considered for direct drive
applications
Variable Speed drives
3 to 12 20-70% Smoother control of process - reduced
maintenance and improved reliability
Controlled starting and stopping
Longer system life
Different level of savings for Variable
Torque and Constant Torque
applications
Ensure that the motors are suitable
for VSD operation - esp. old or cheap
motors
May not be able to reduce the speed
greatly if high constant head
pressure is required
Correct installation and maintenance
is important
Lighting
LED’s 1 to 12 70% Higher lumens / Watt Consideration must be given to the
environment in which lamps are
being fitted
Colour rendition qualities need to be
considered
(Metal Halide)
High
Frequency
fittings
12 to 36 10-30% Integrate controls
Dimmable
Maximum savings available where
daylight savings to be made
(T5
Fluorescent)
12 to 36 10-50% Dimmable
Integrate controls
Higher number of fittings may be
required if retrofitting existing
Fluorescent lamp installation
High
Frequency
adapters
12 to 36 20-50% Reduced installation requirements
Energy savings similar to high frequency
fittings
Maintenance
May not be possible to retrofit to
older fittings
Controls
[including
constant light
control with
DALI,KNX etc]
12 to 48 30% Improved control of lighting
Reduced ‘lighting pollution’
Extend lamp life
A number of light fittings will not be
compatible with controls
Consideration should be given to
integrating lighting control to local
environment / process control
Enhanced
Automation Systems
12 to 48 2 -10% Operational efficiency improvements
Less labour intensive
Quality of product - consistent
Integrate data collection and energy
management functions into existing
automation systems](https://image.slidesharecdn.com/energyefficiency-wheretoinvest-170103204230/75/Energy-efficiency-where-to-invest-3-2048.jpg)


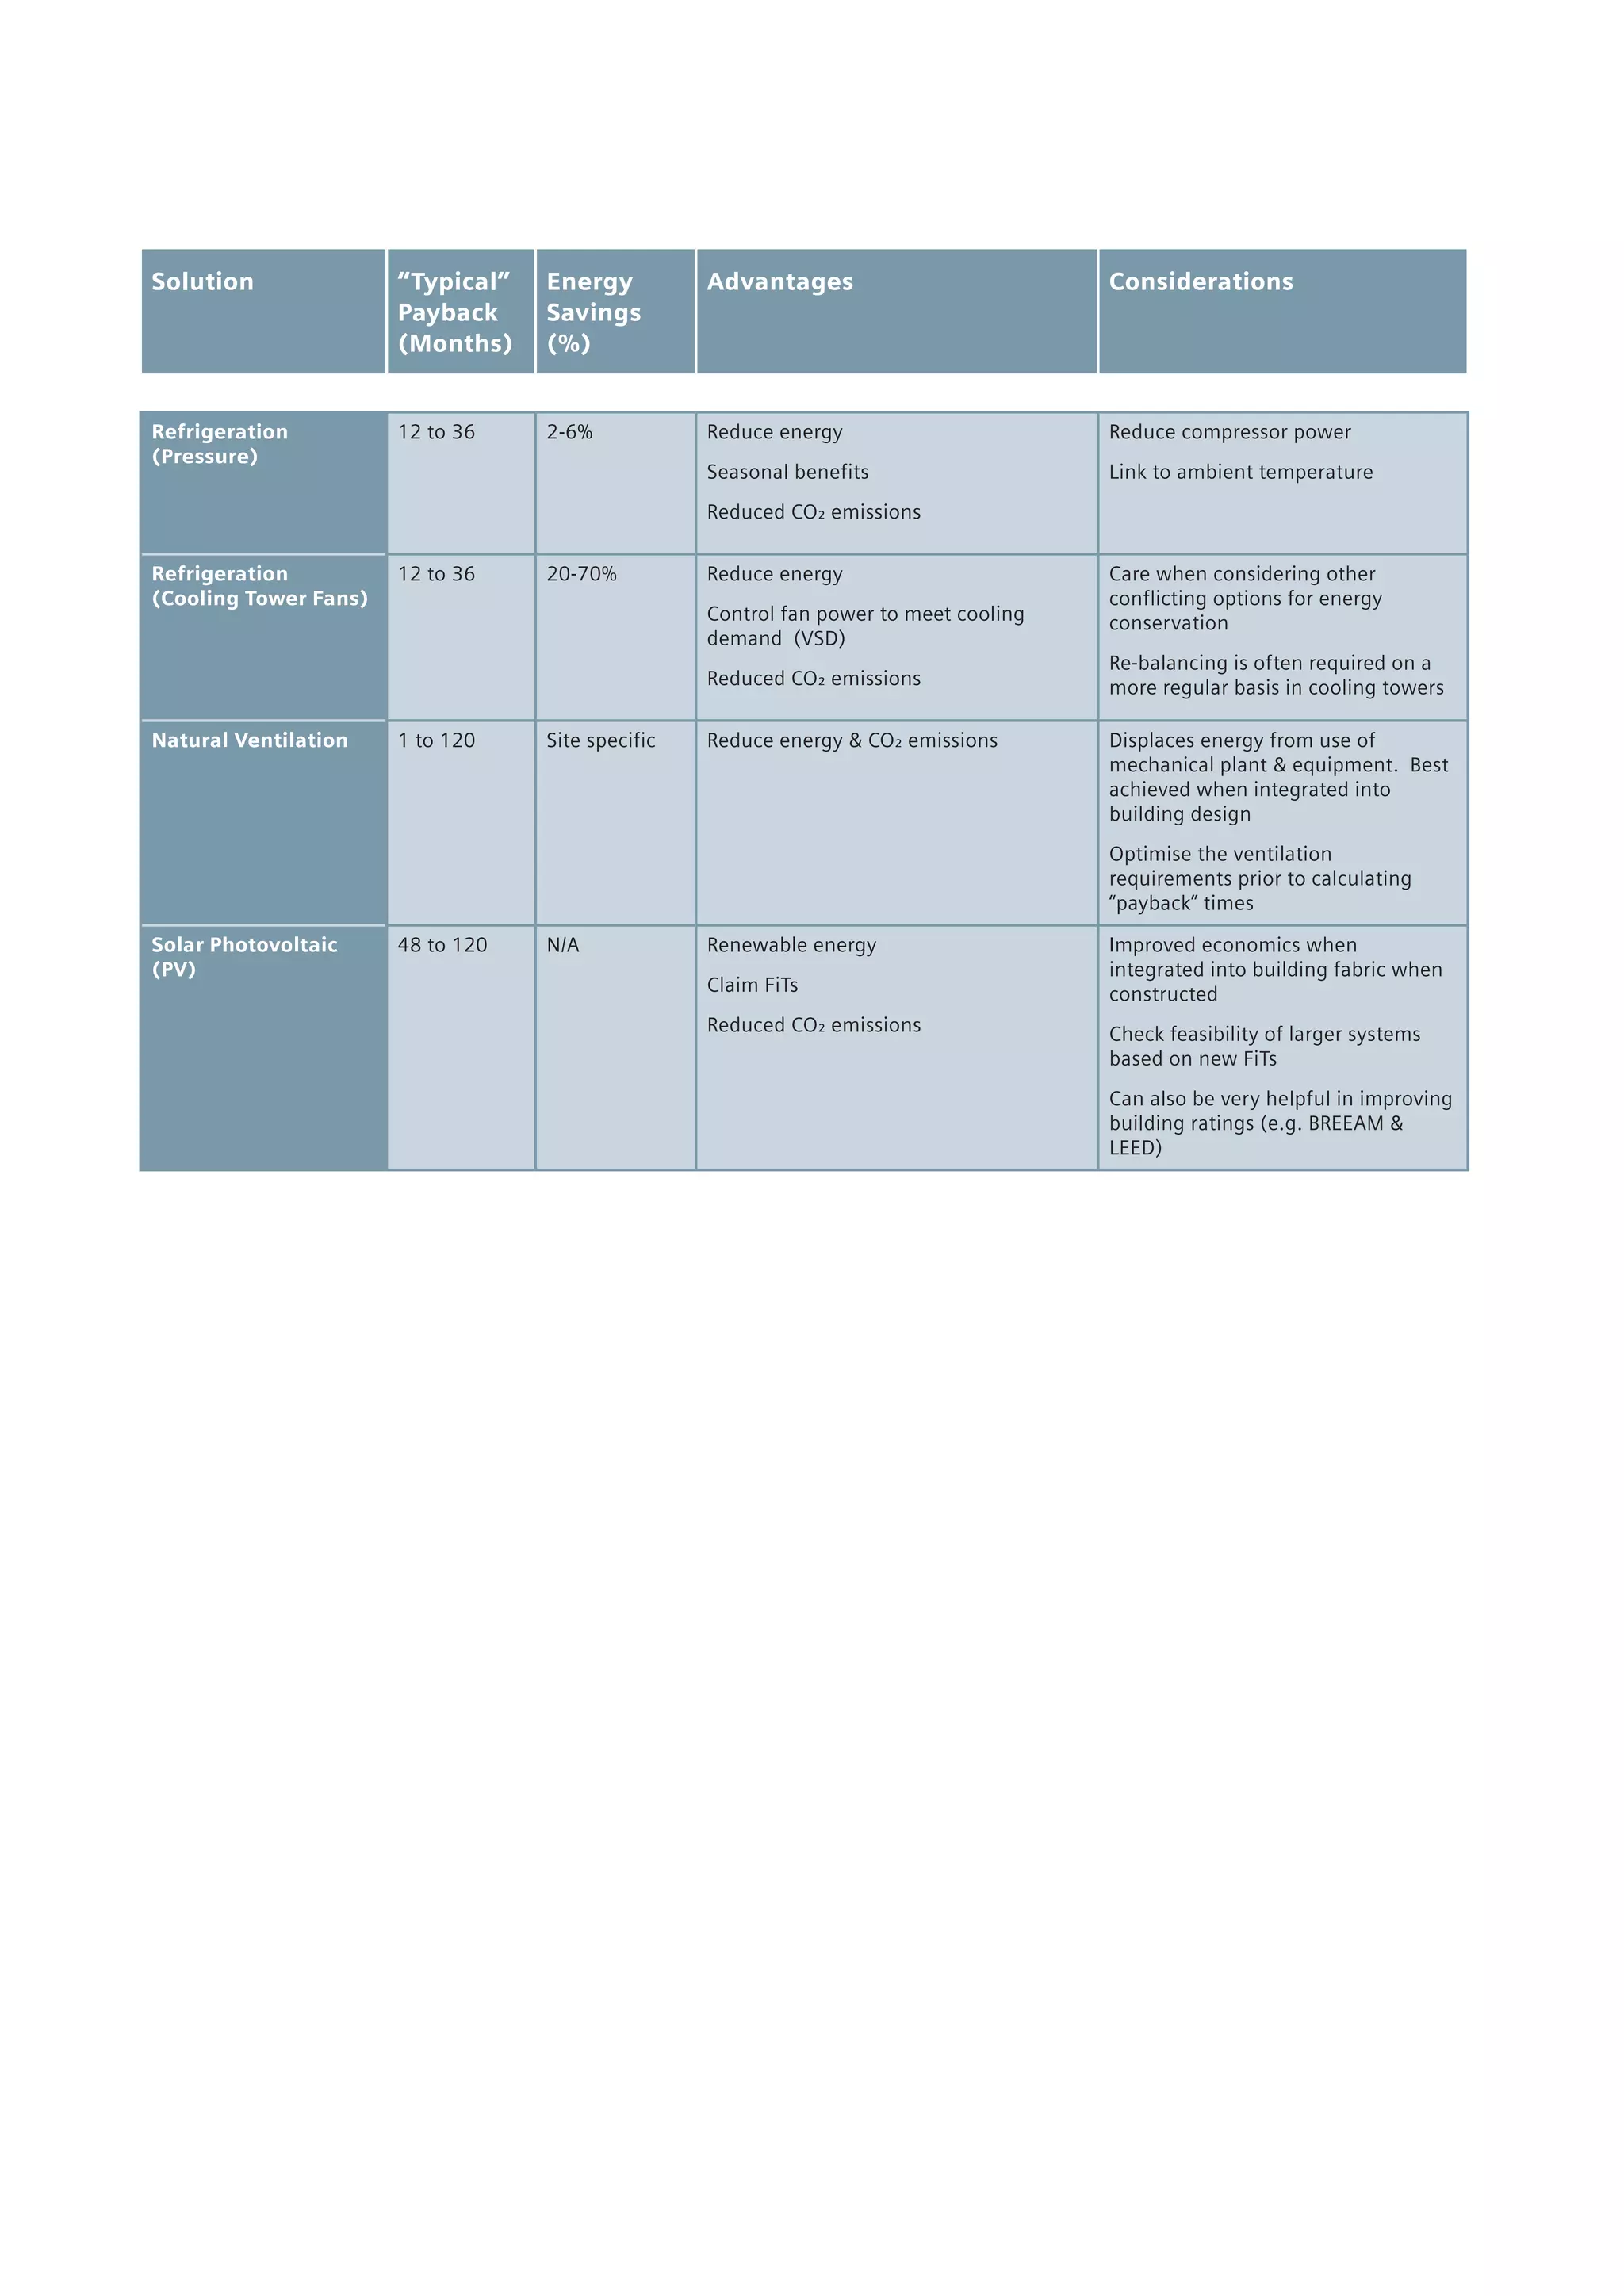


Automatic monitoring and targeting (aM&T) can identify opportunities to reduce energy consumption within 3 to 12 months and save 3-10% of total utility costs. It provides performance reporting and allows immediate identification of exceptional energy usage. Considerations include means for collecting data and having appropriate reporting processes. Variable speed drives can pay back within 3 to 12 months while saving 20-70% of energy costs from smoother process control, longer equipment life, and other advantages. Ensuring motor compatibility and proper installation and maintenance is important. Lighting upgrades like LEDs and high frequency fittings typically pay back within 1 to 3 years while saving 70-50% of energy. Considerations include environmental compatibility, color rendition, number


