Download to read offline


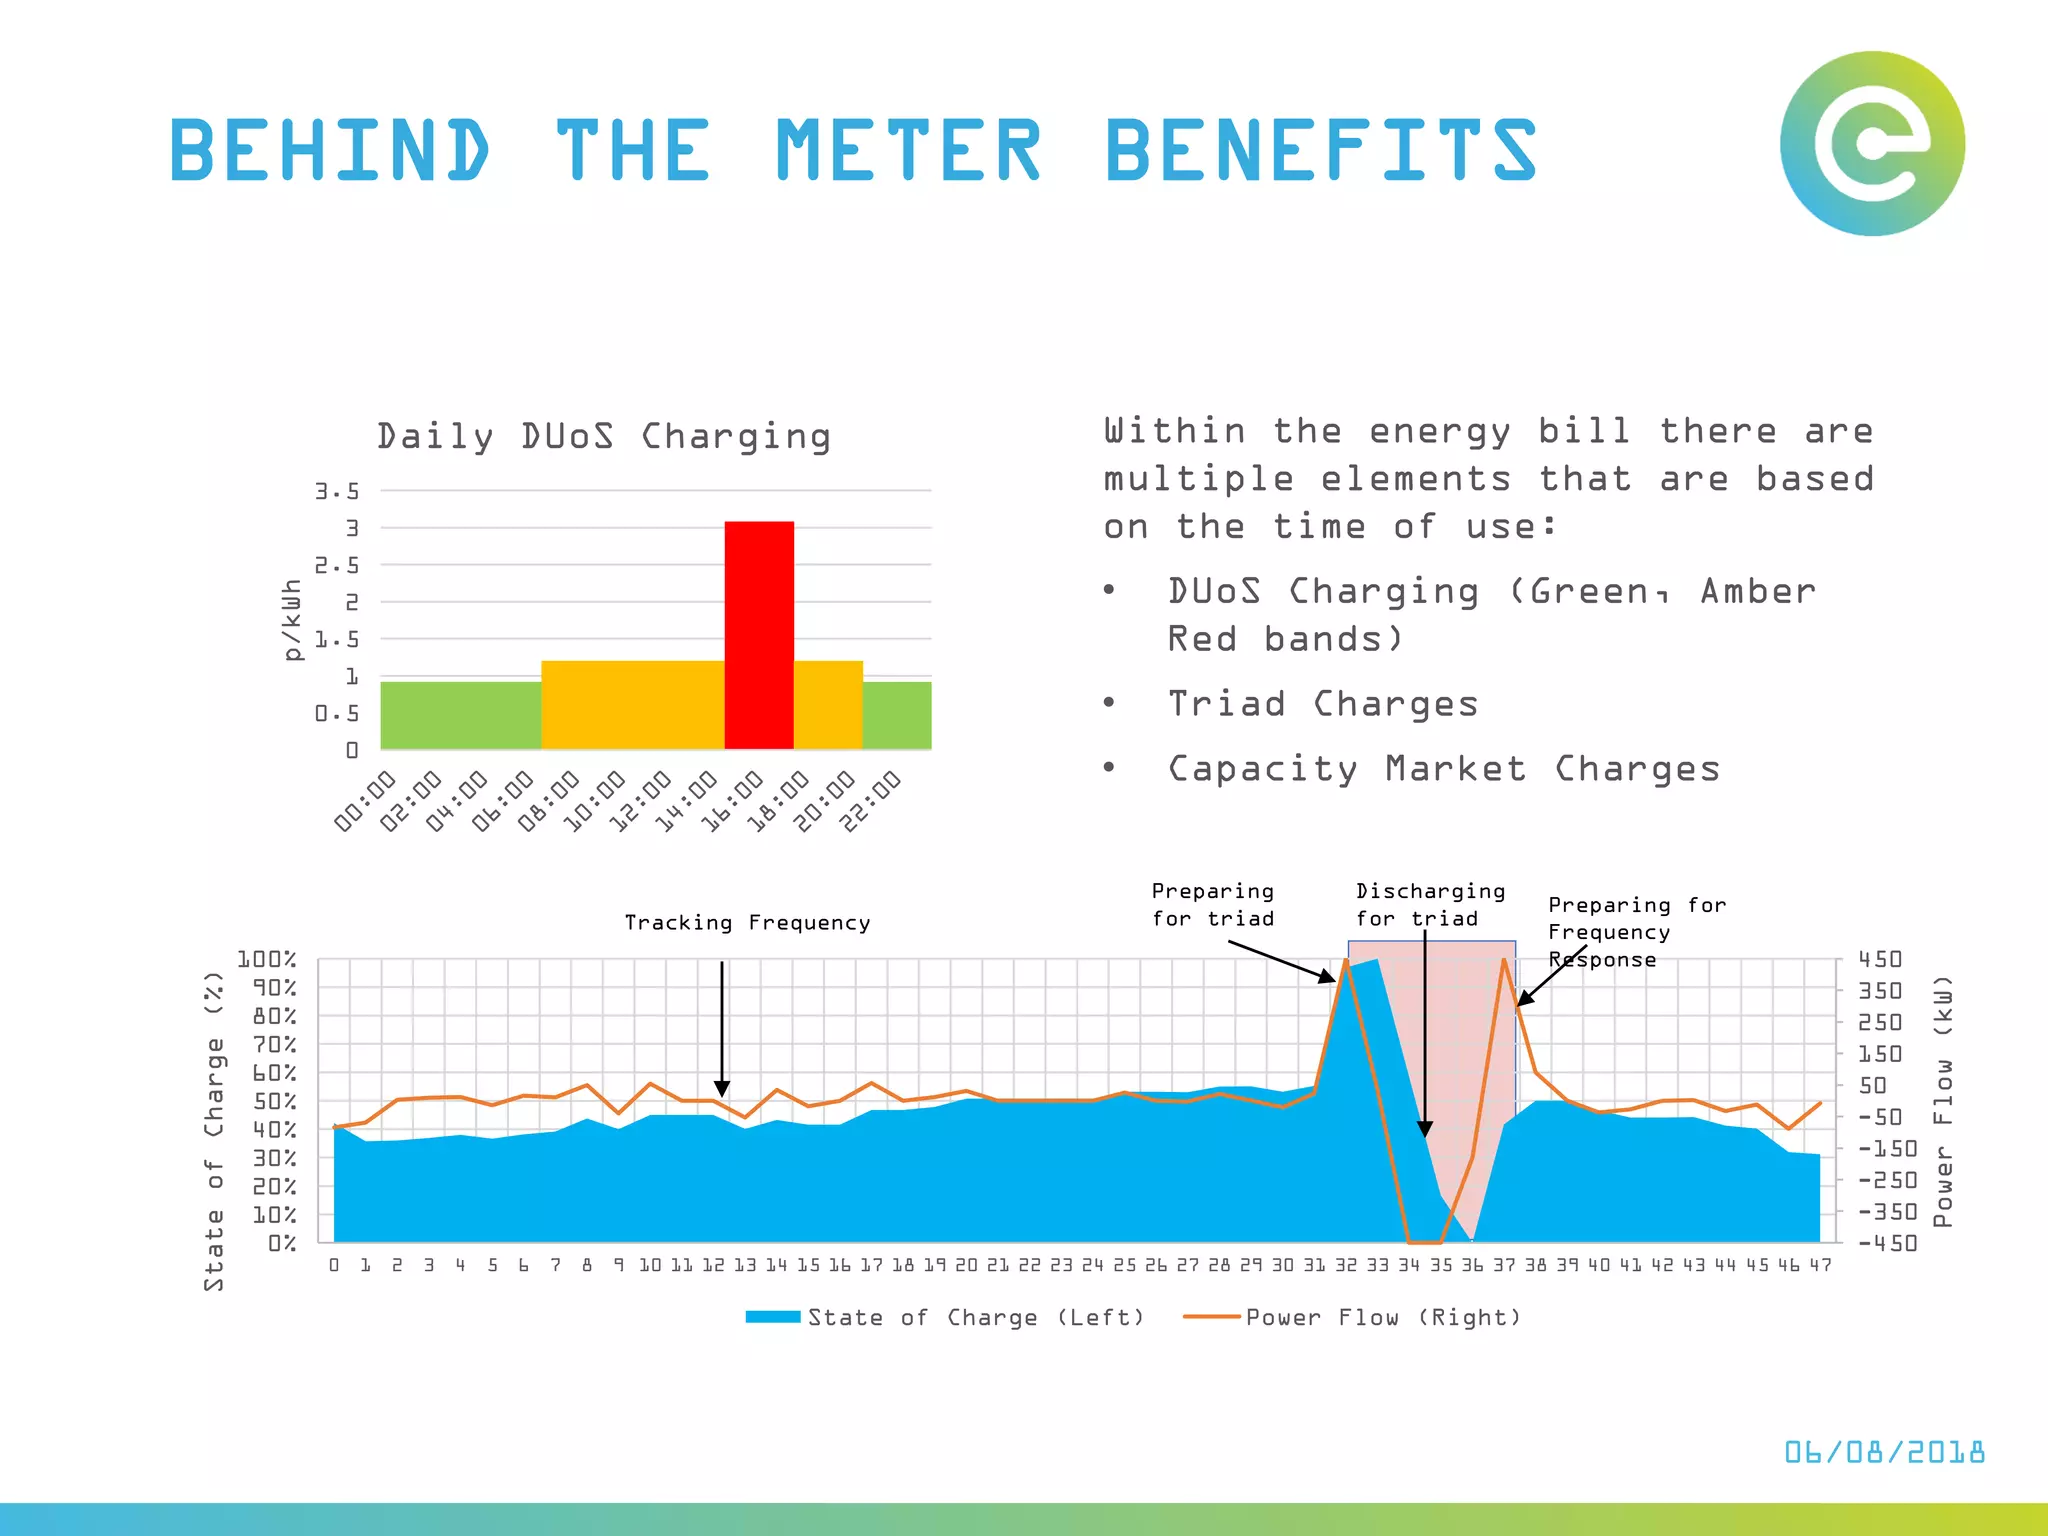


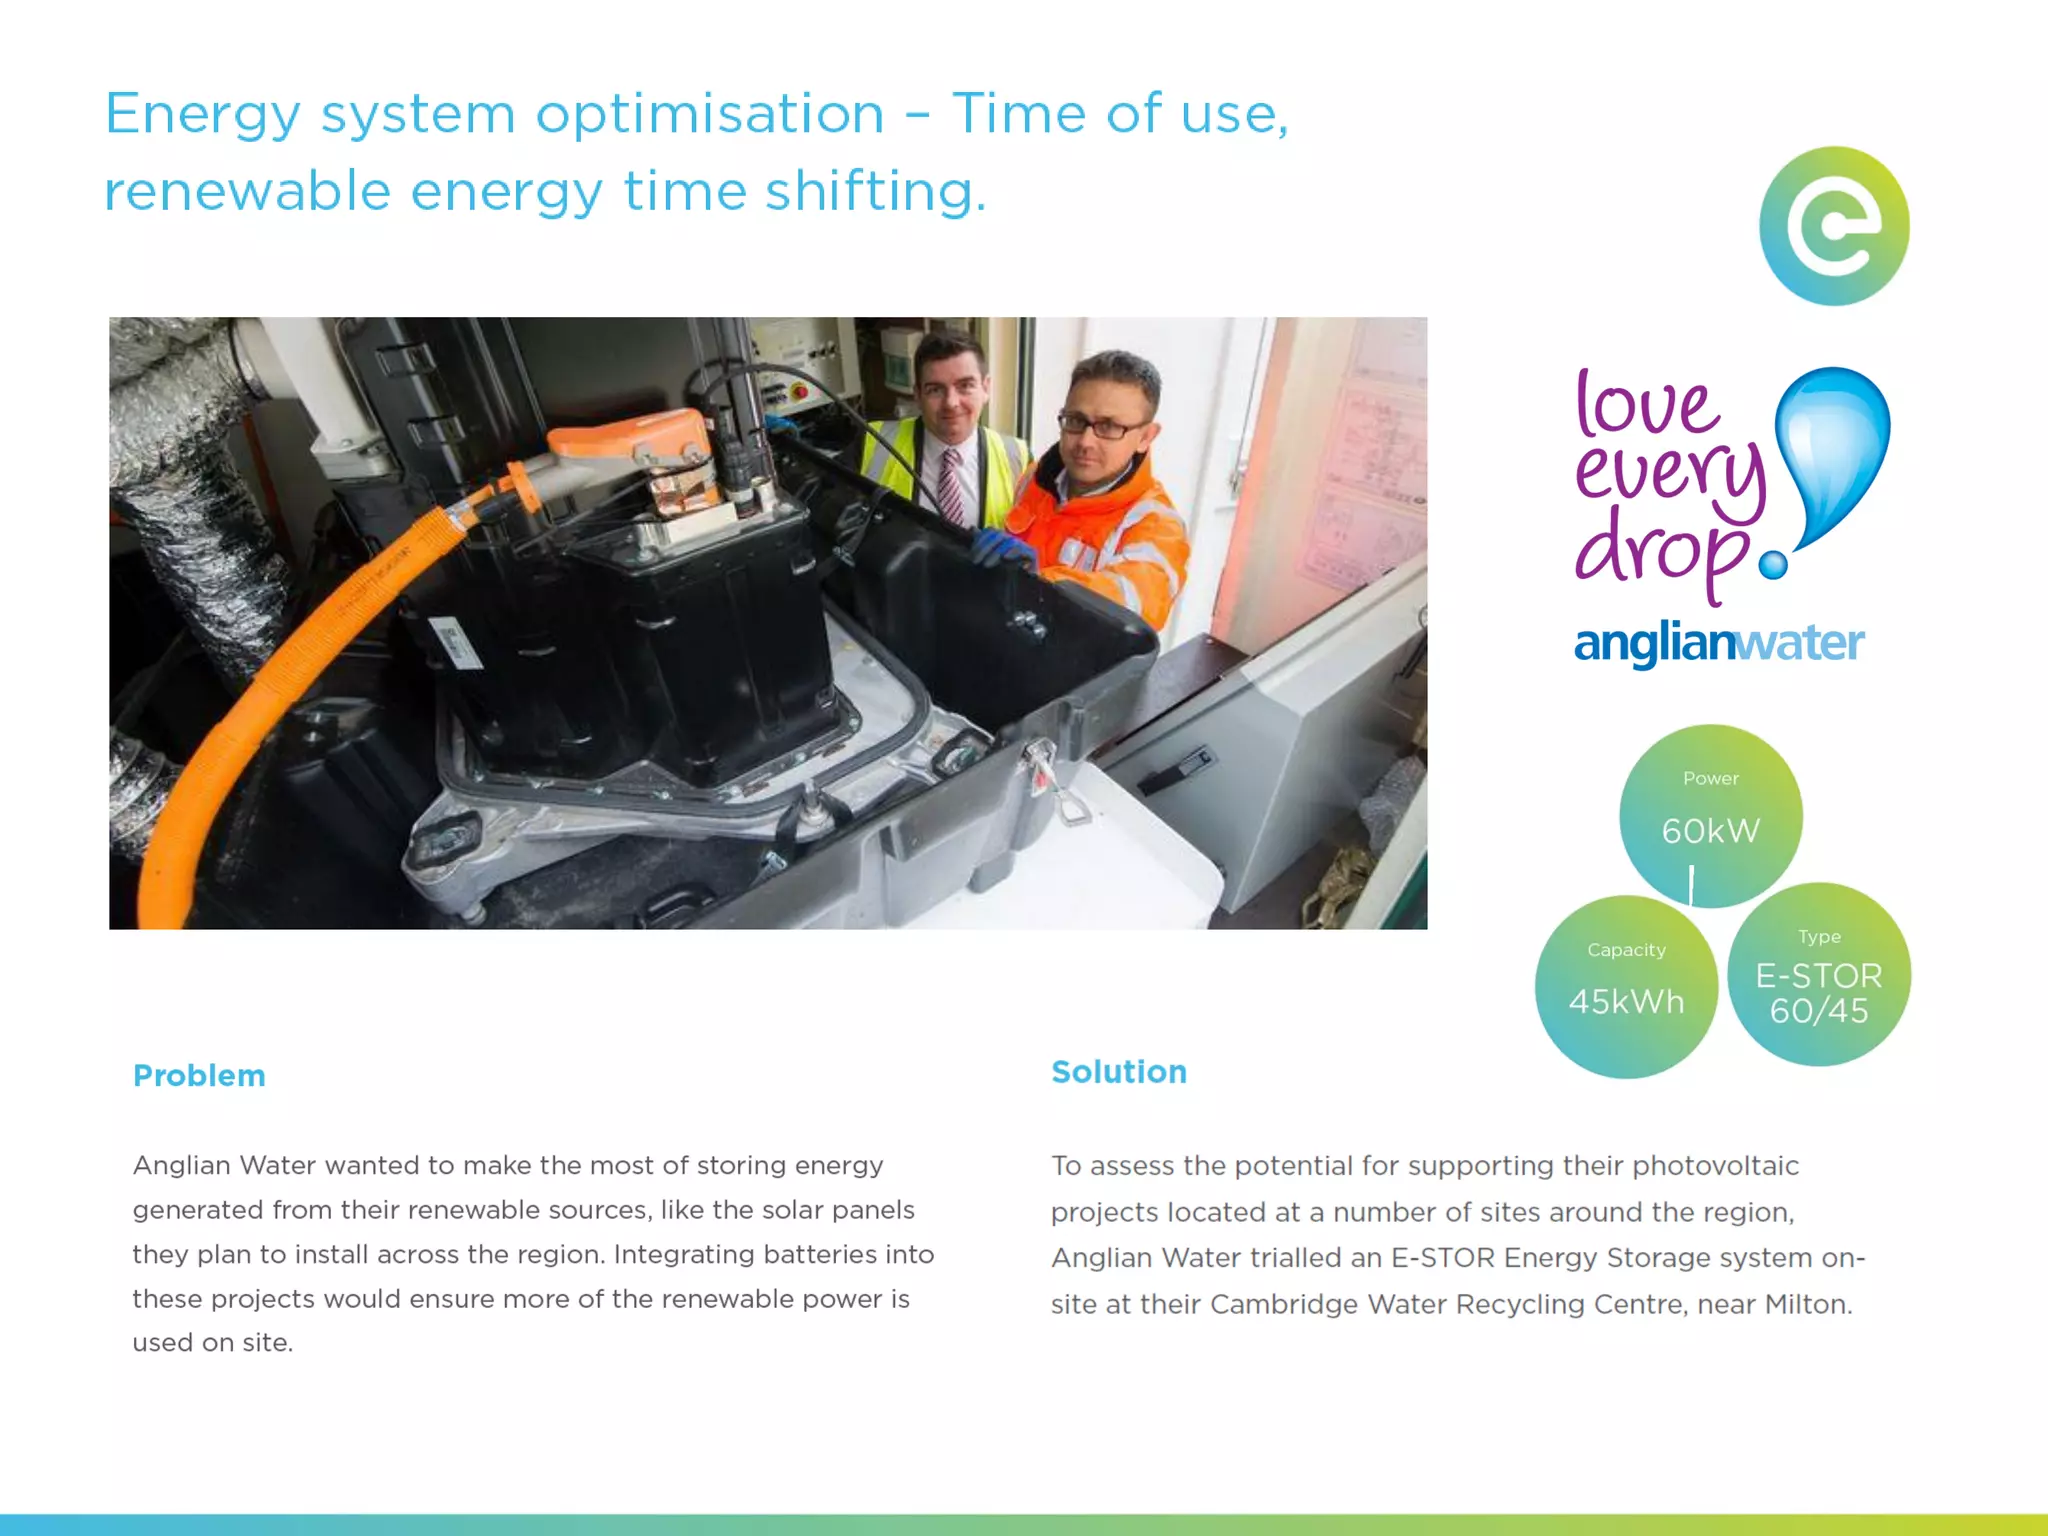
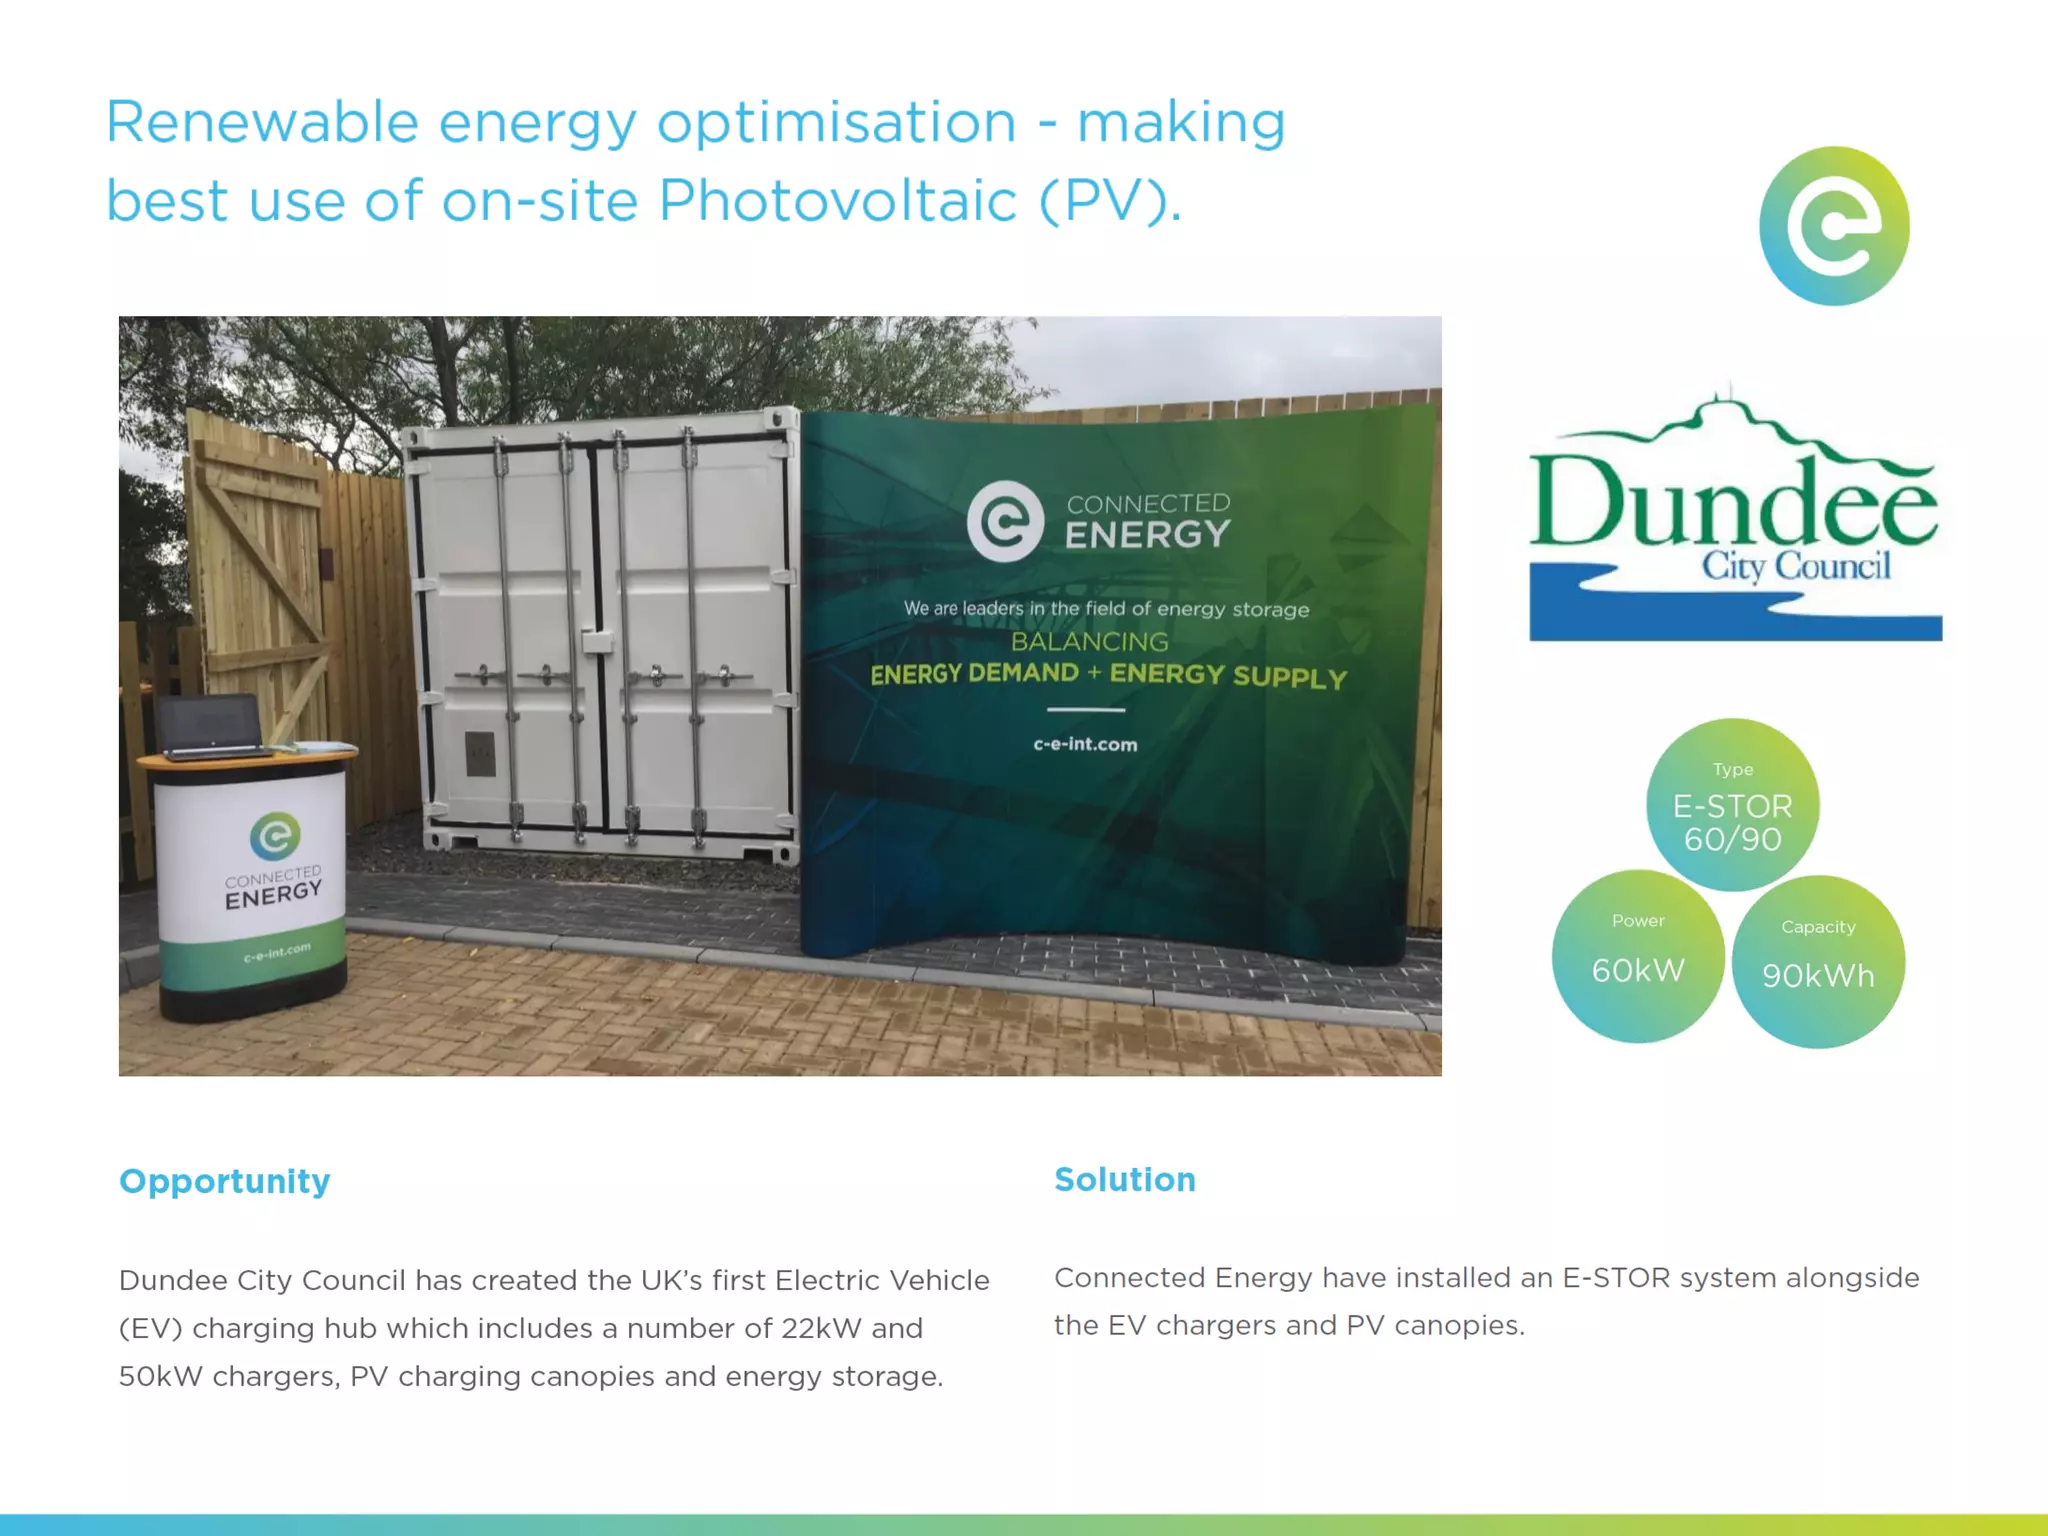

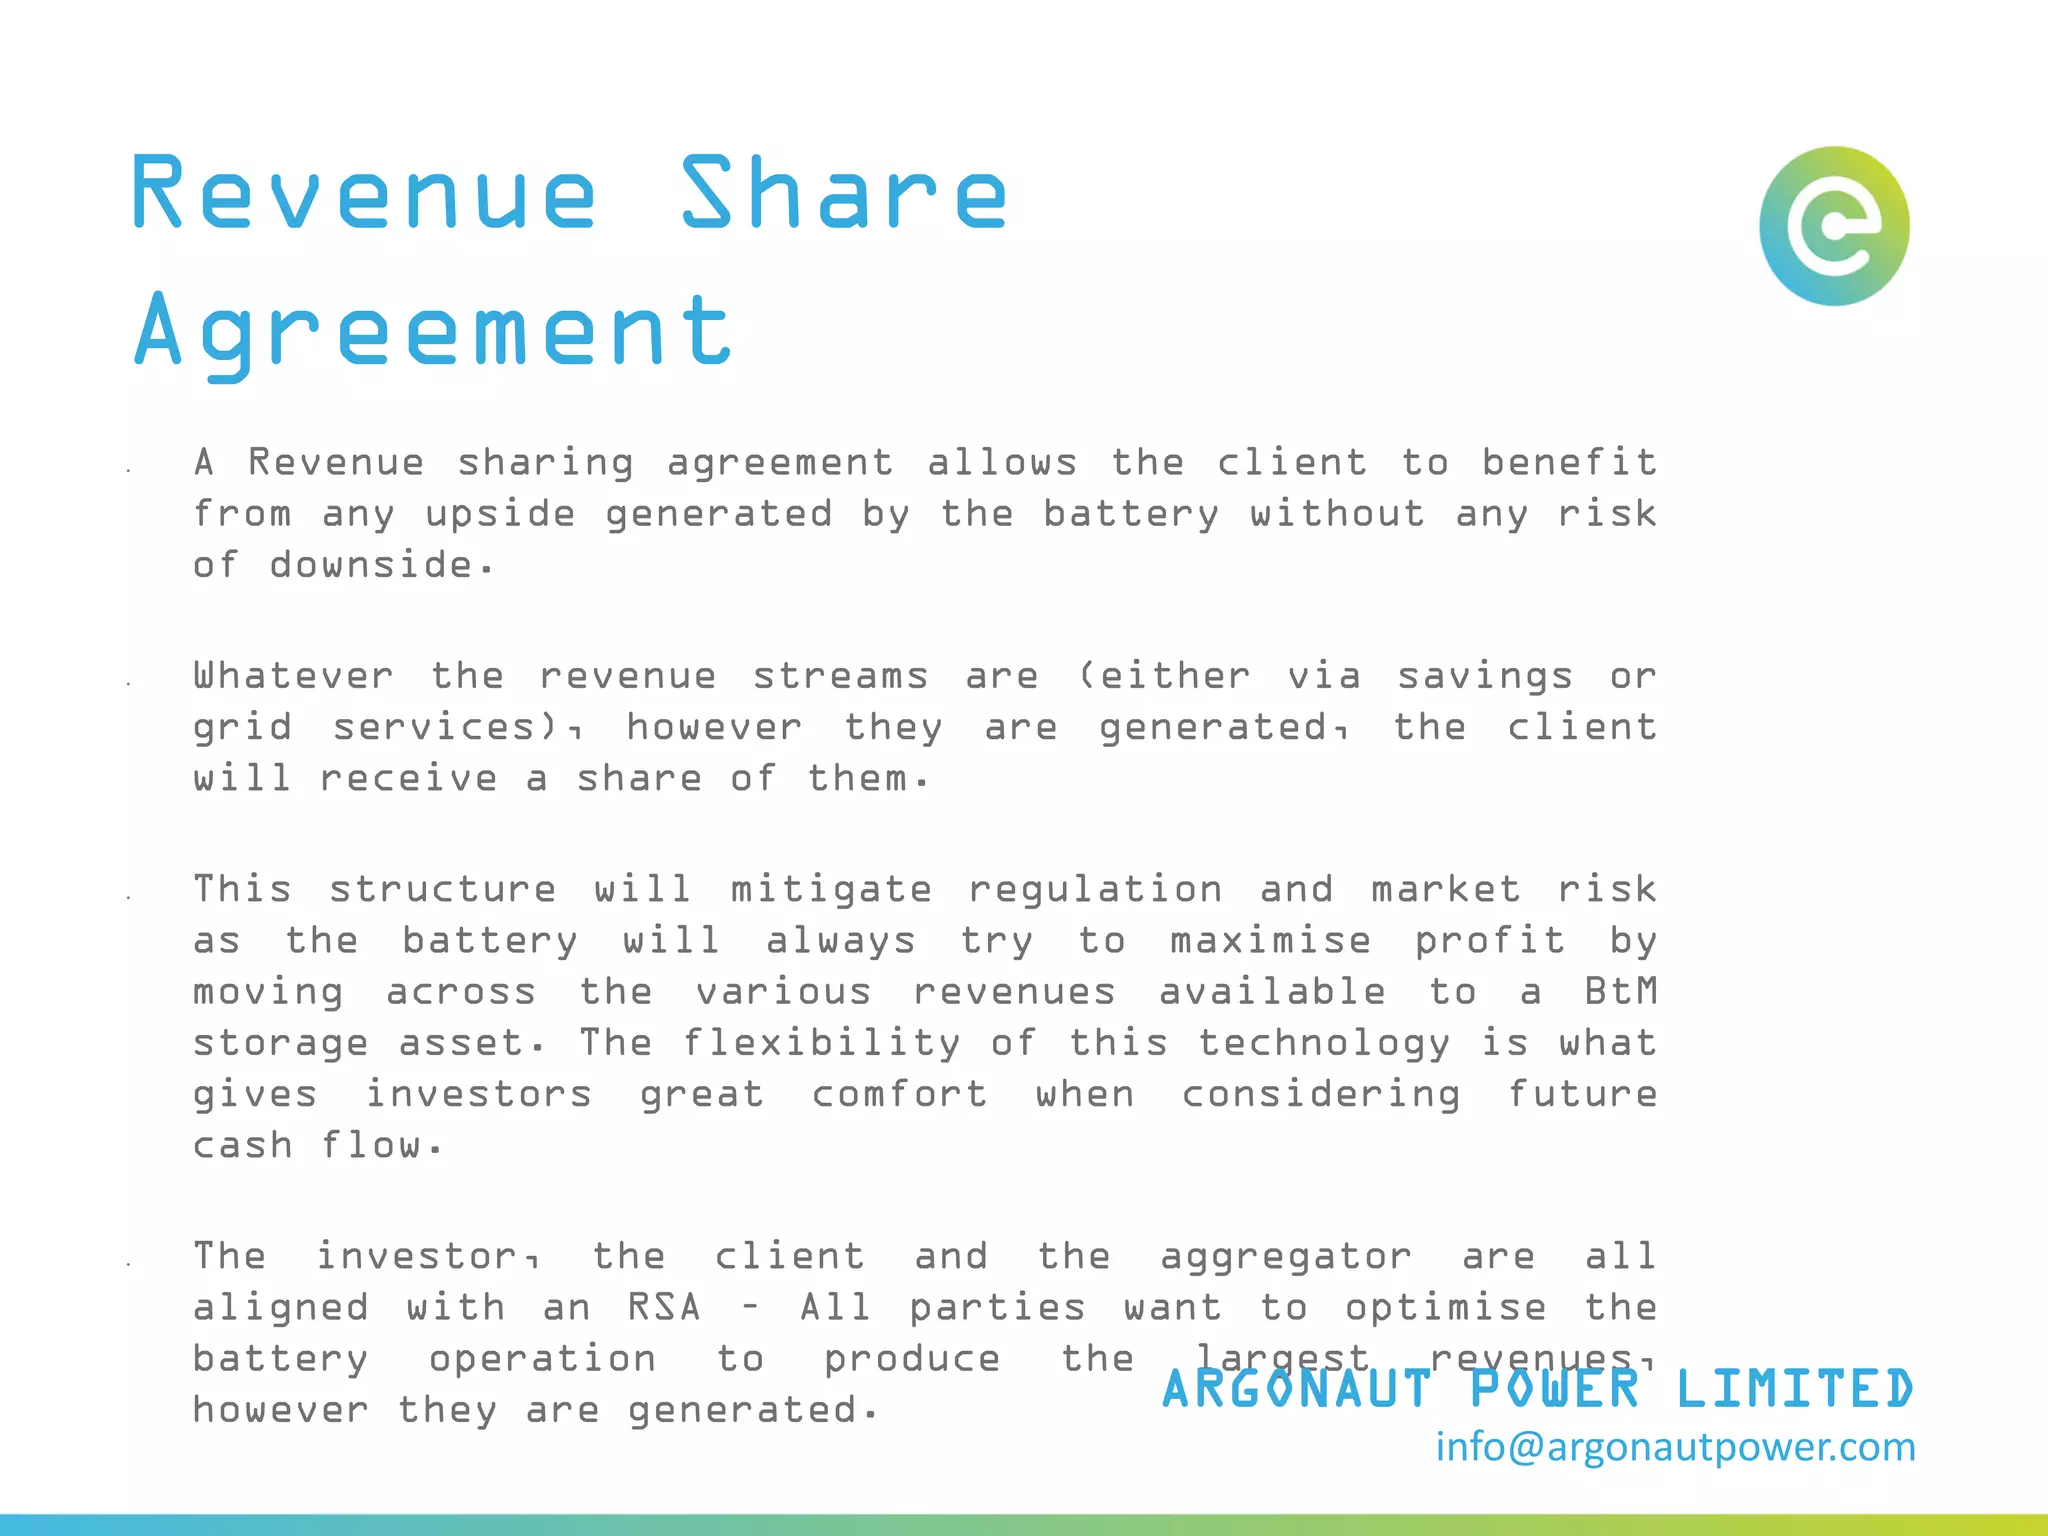


The document outlines the capabilities of a leading energy storage solutions provider specializing in e-stor systems, which have been operational since 2014 and offer scalable solutions for industrial and commercial customers. It addresses the rising energy costs impacting businesses and presents revenue-generating opportunities through various grid services. Additionally, a revenue sharing agreement is mentioned, ensuring that clients can benefit from generated revenues without the risk of downside.


