Download as PDF, PPTX


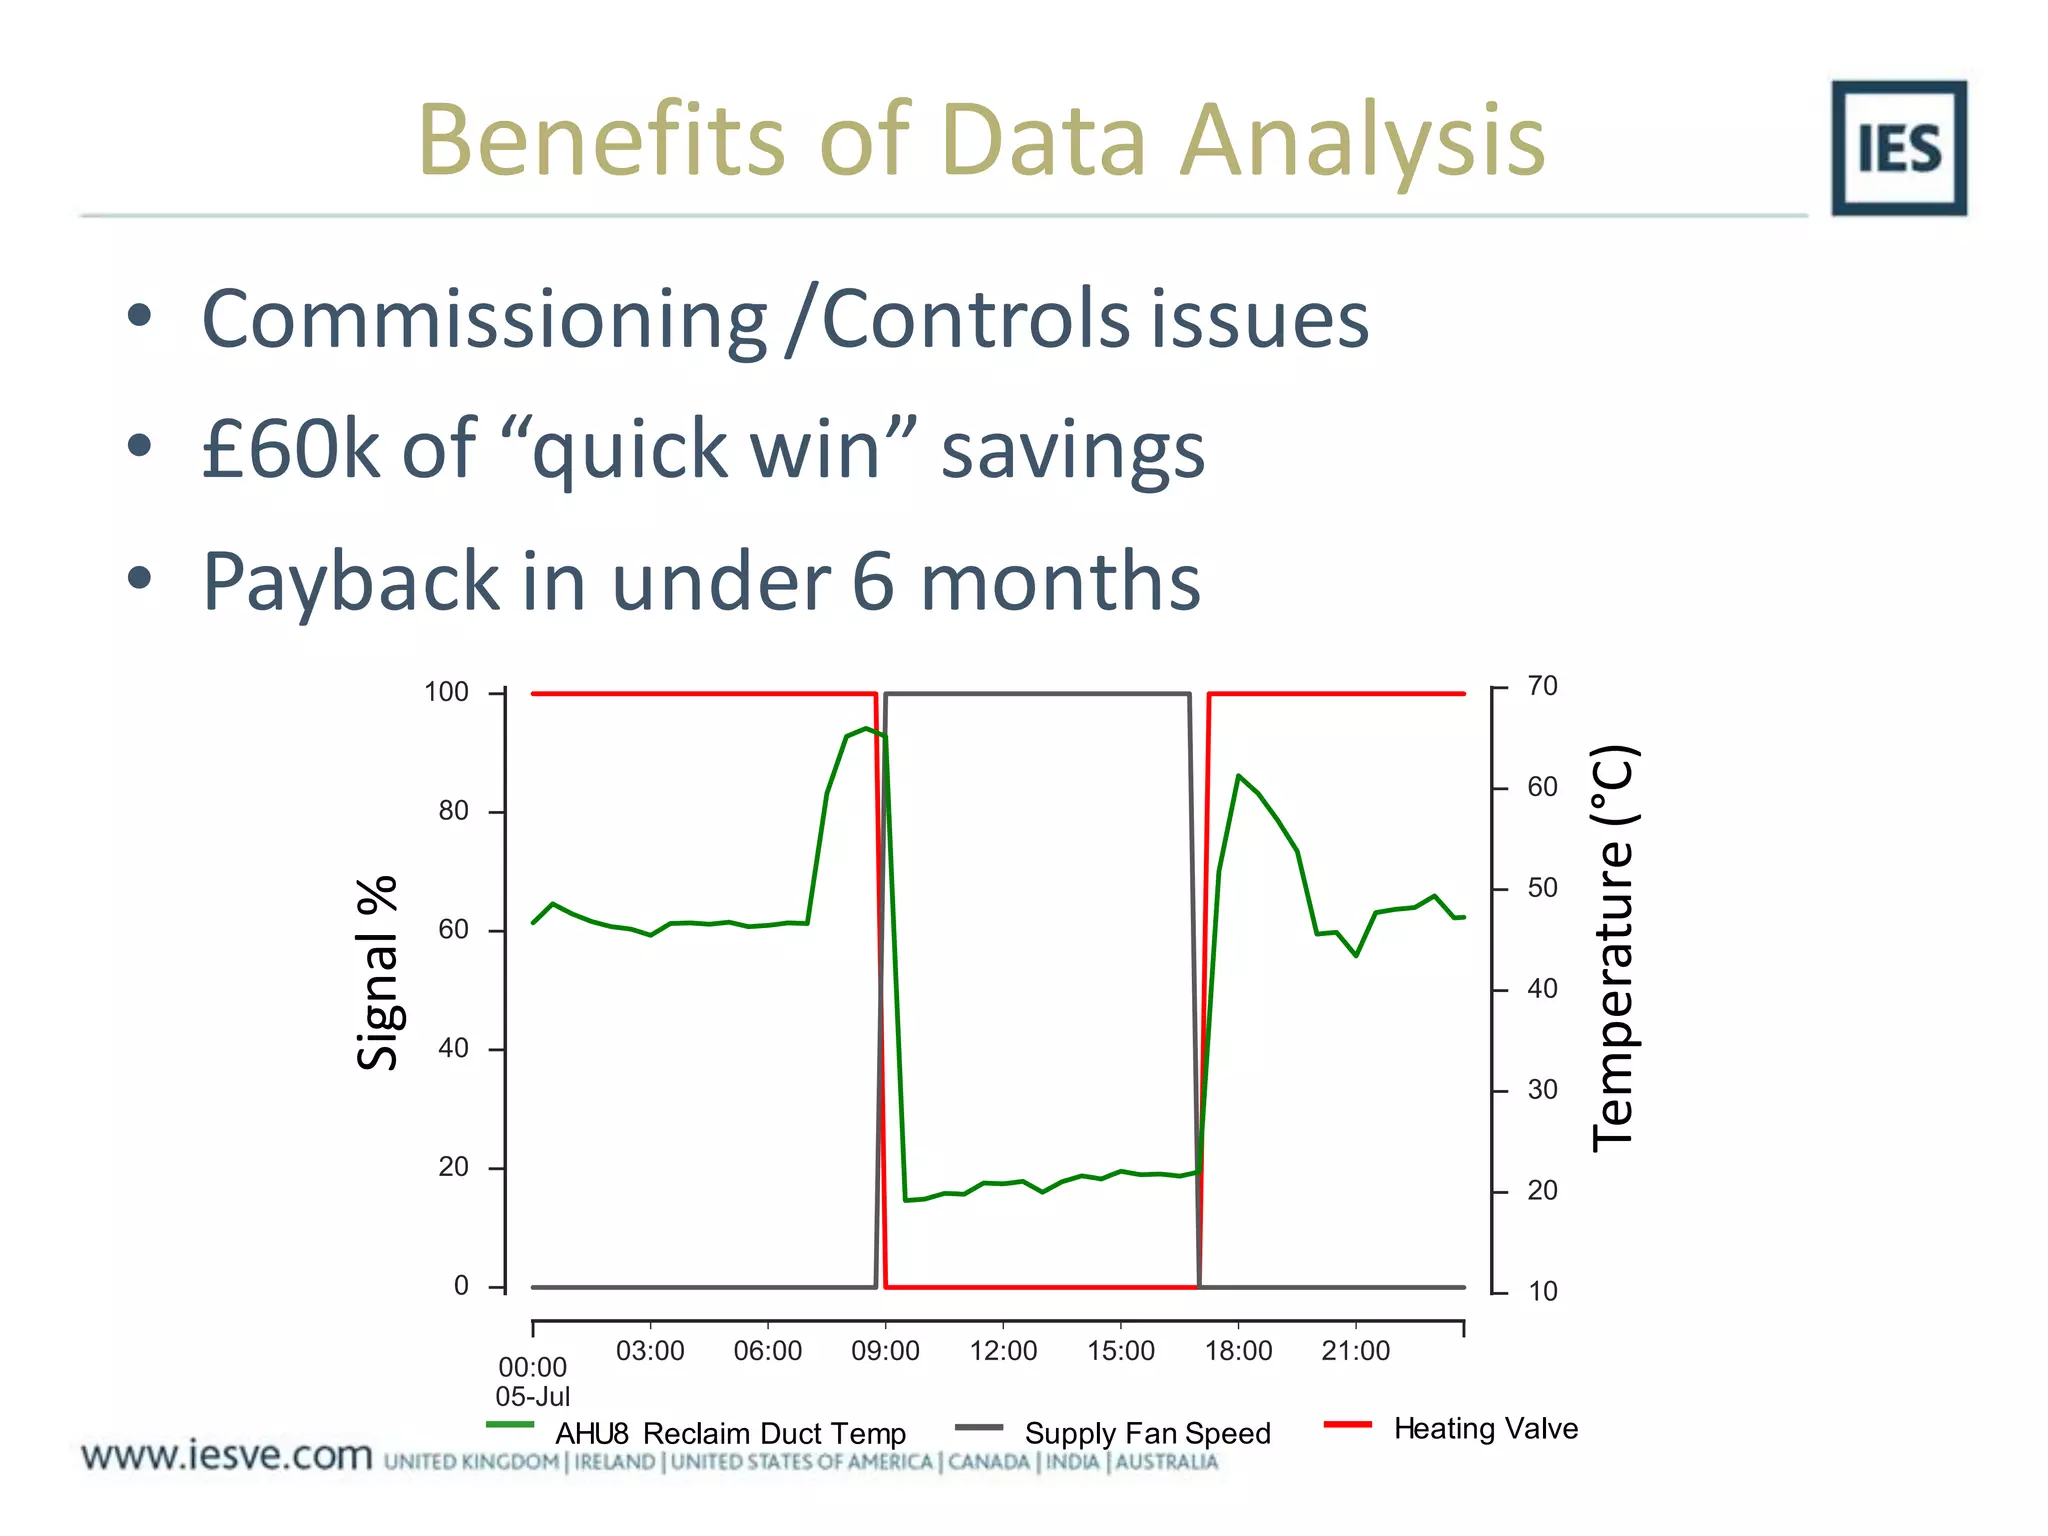
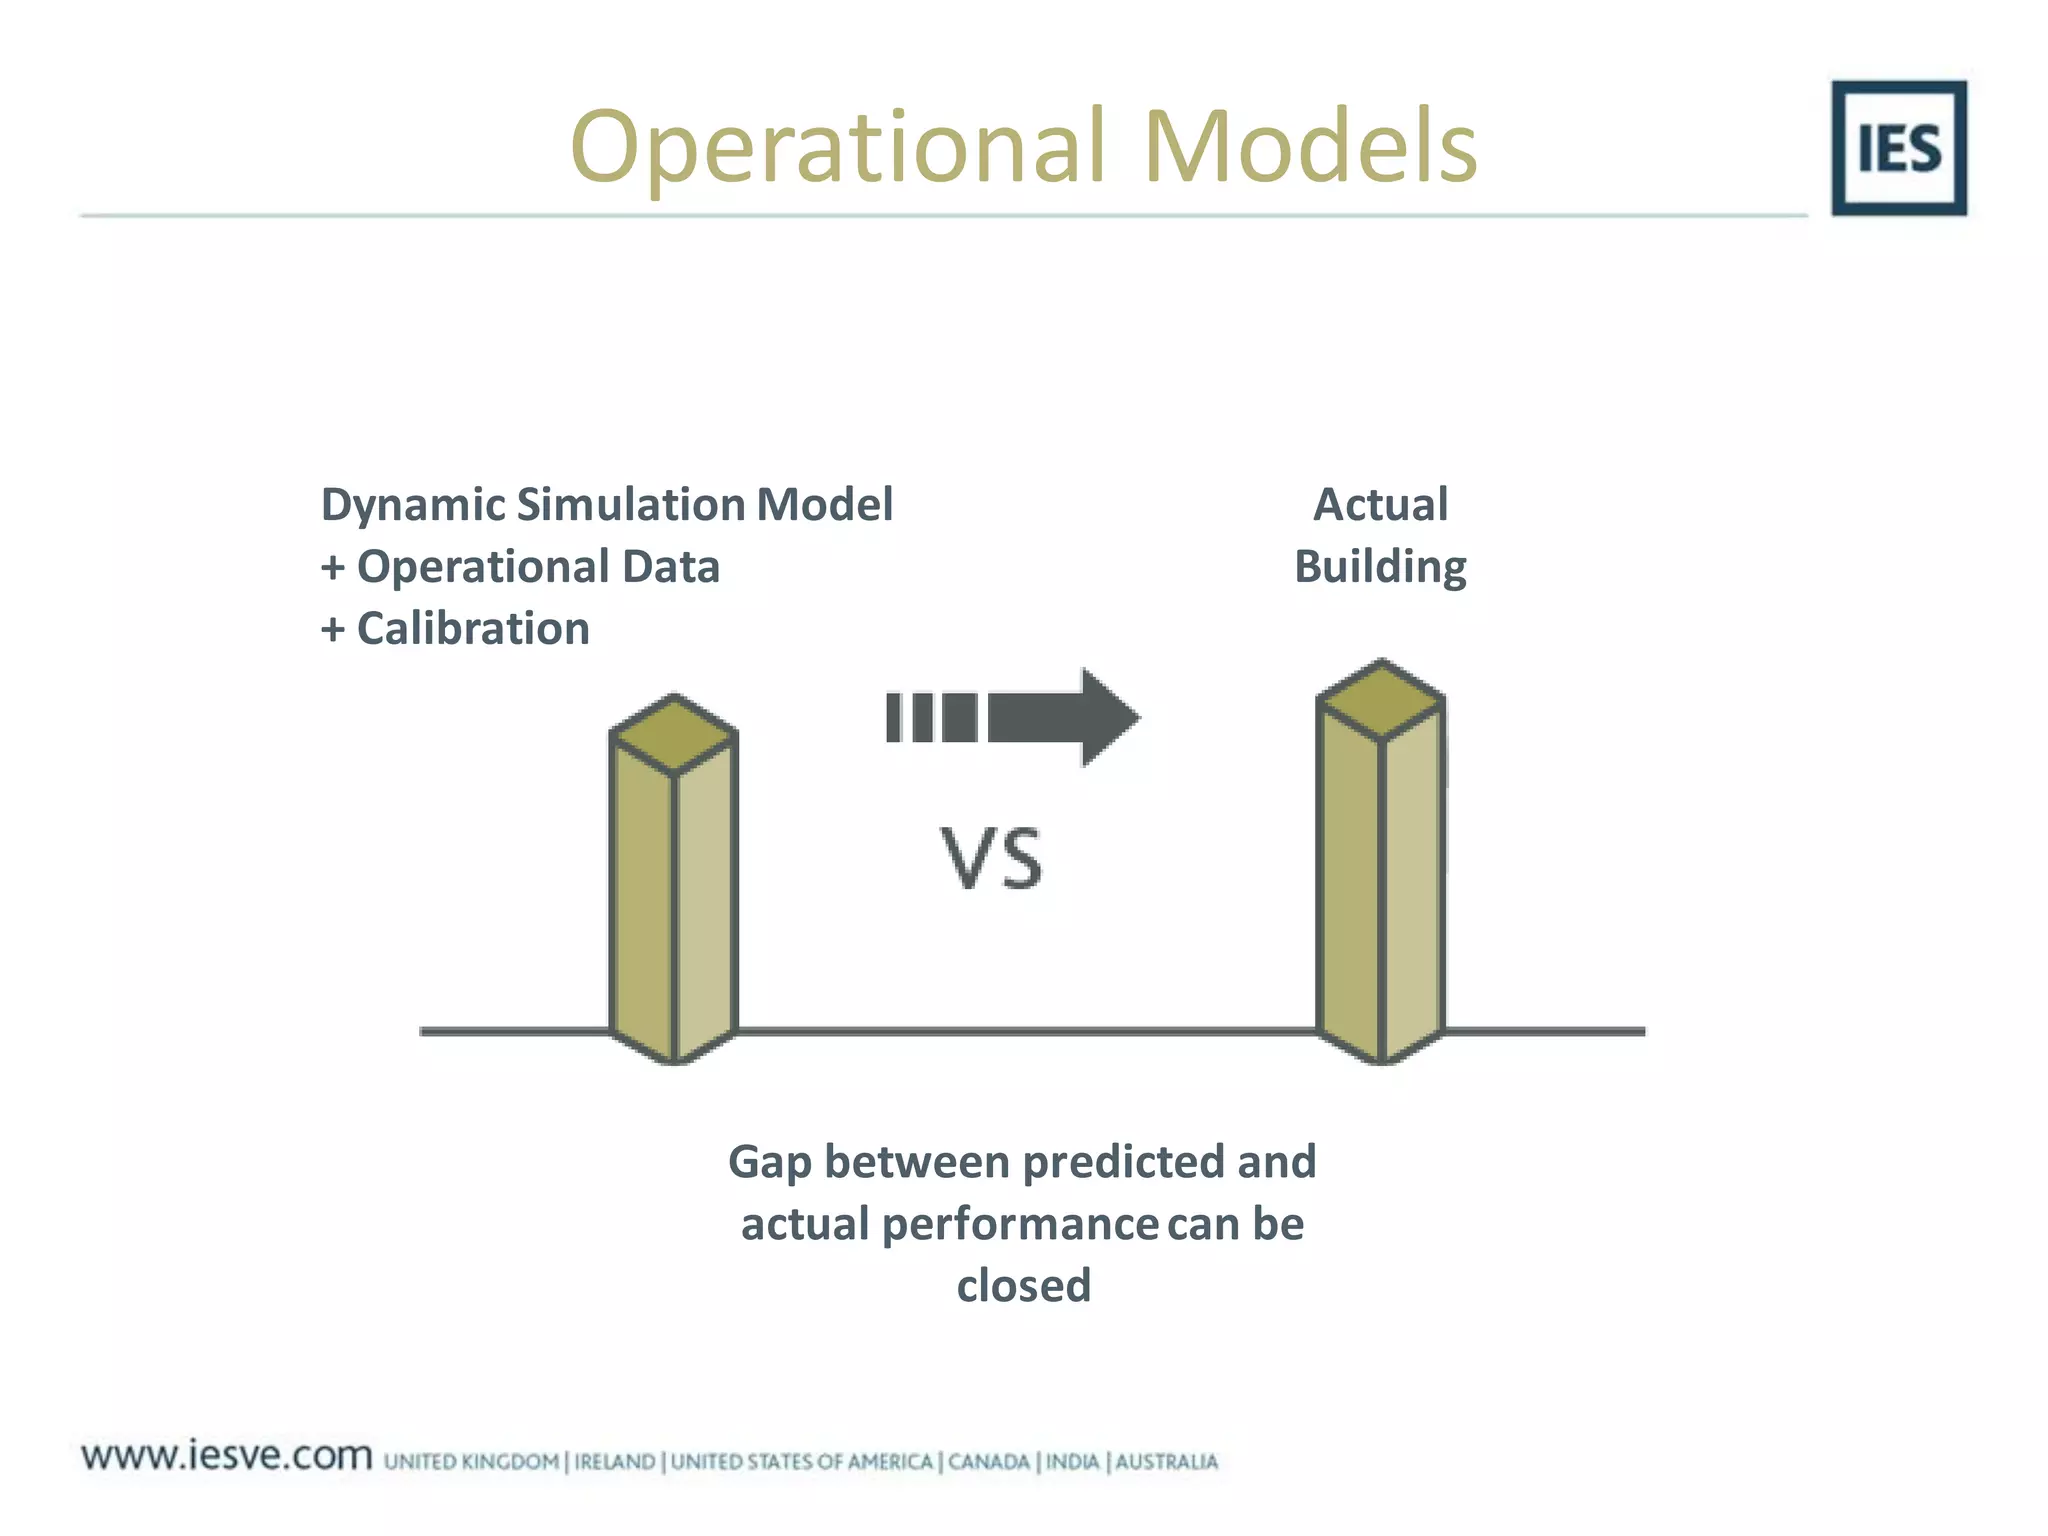

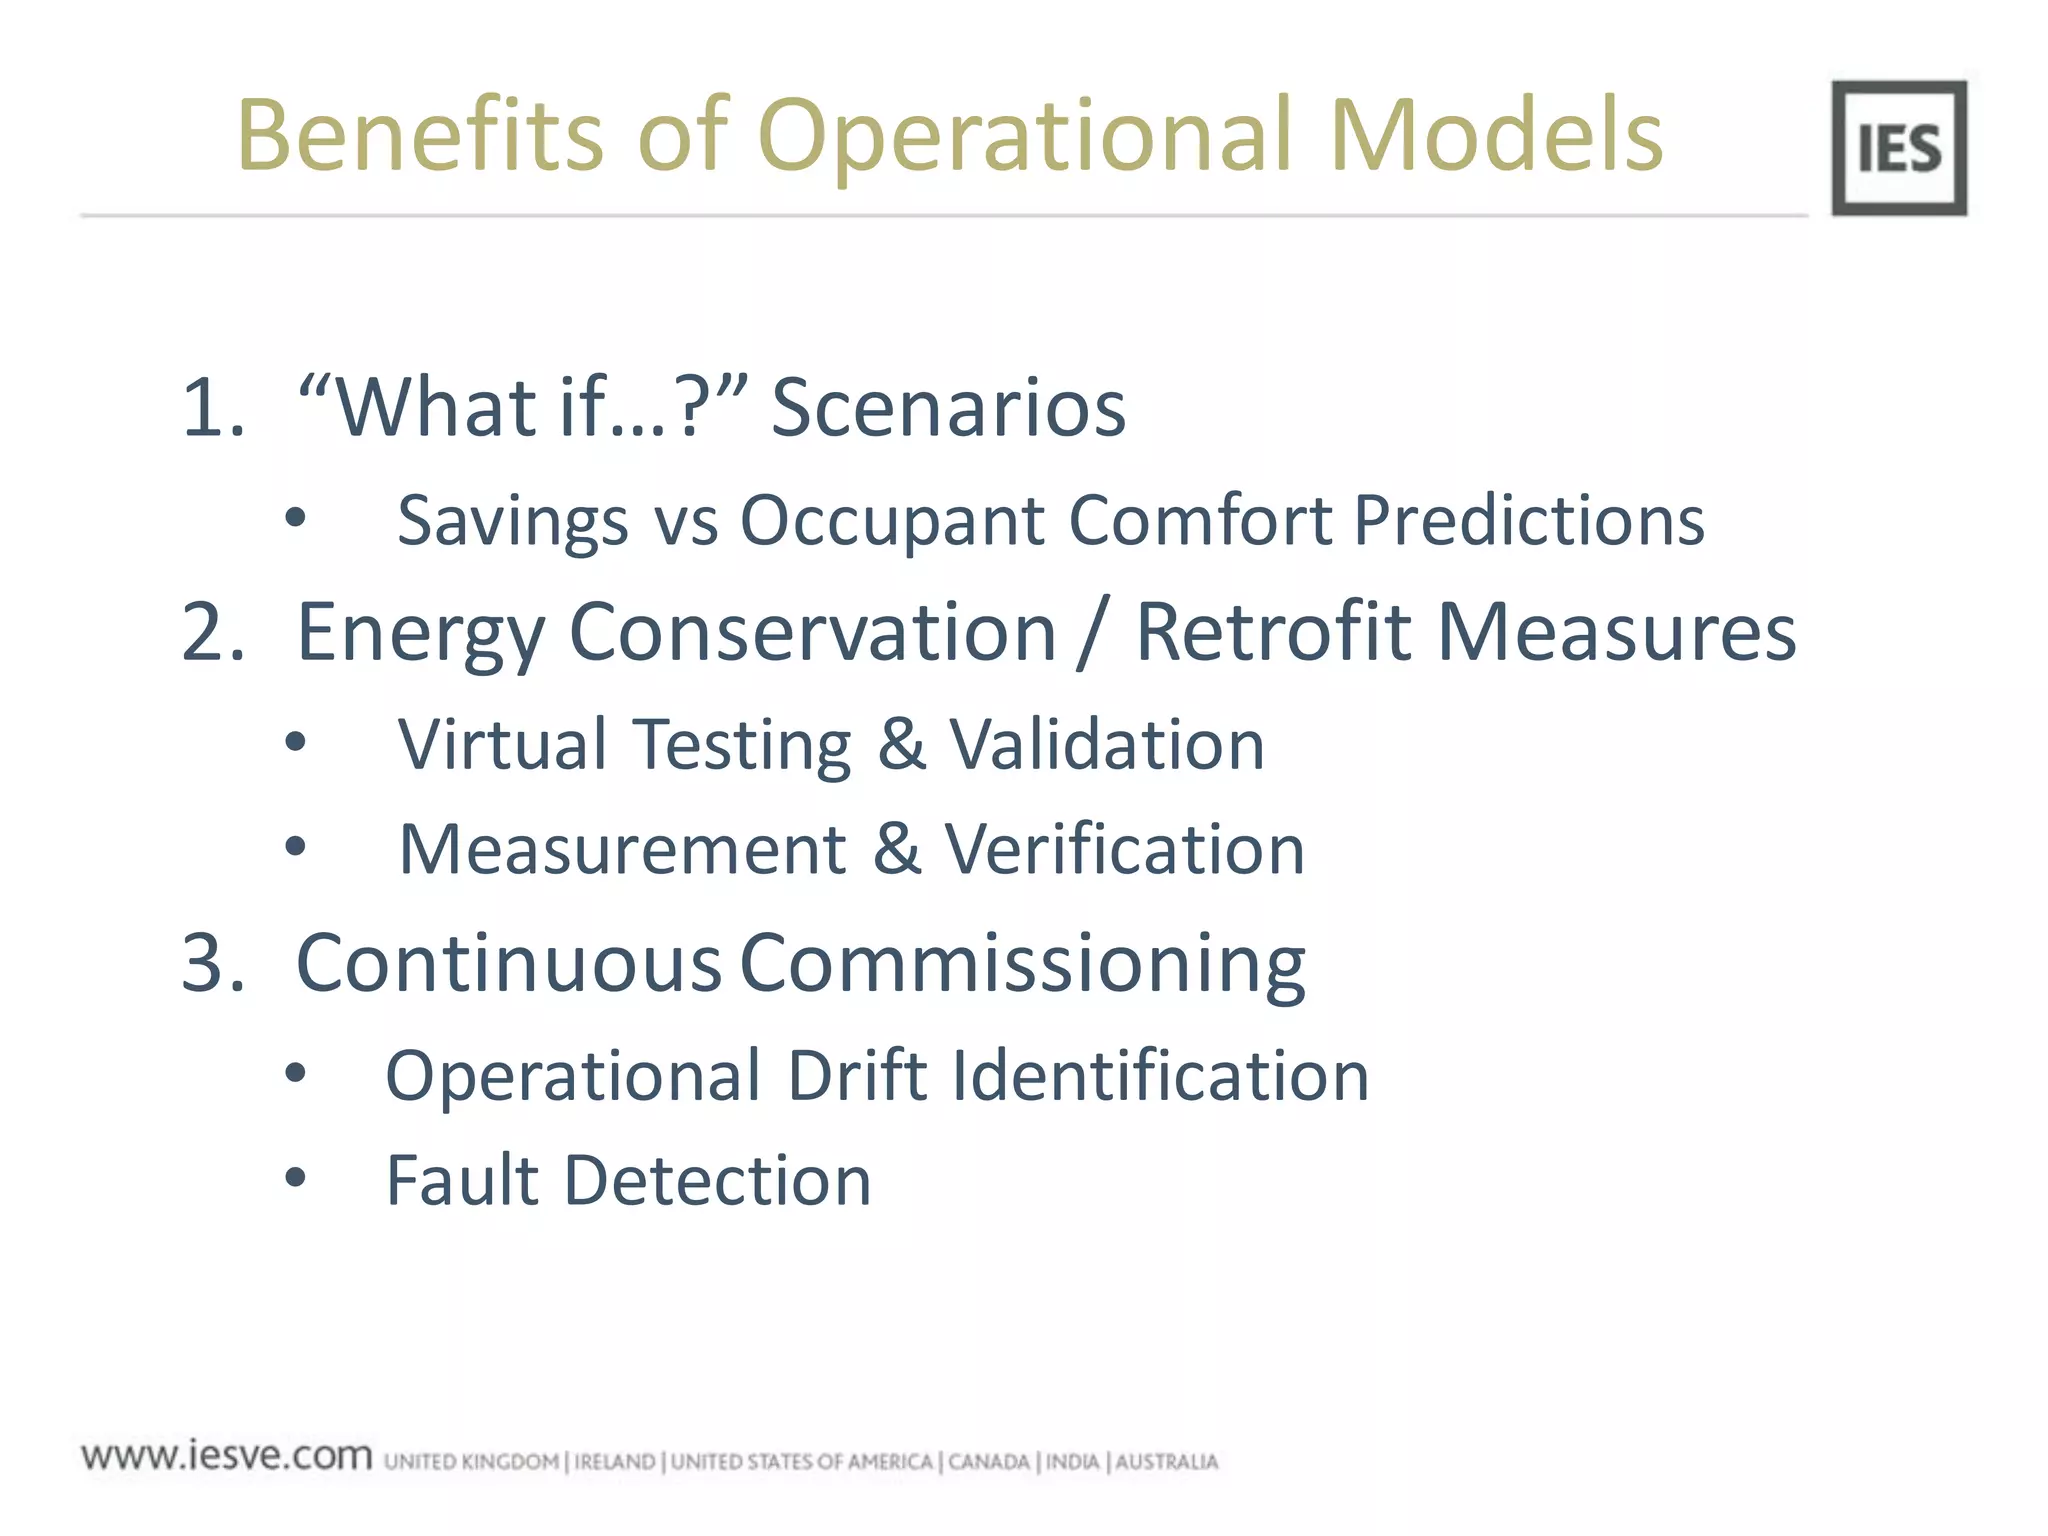

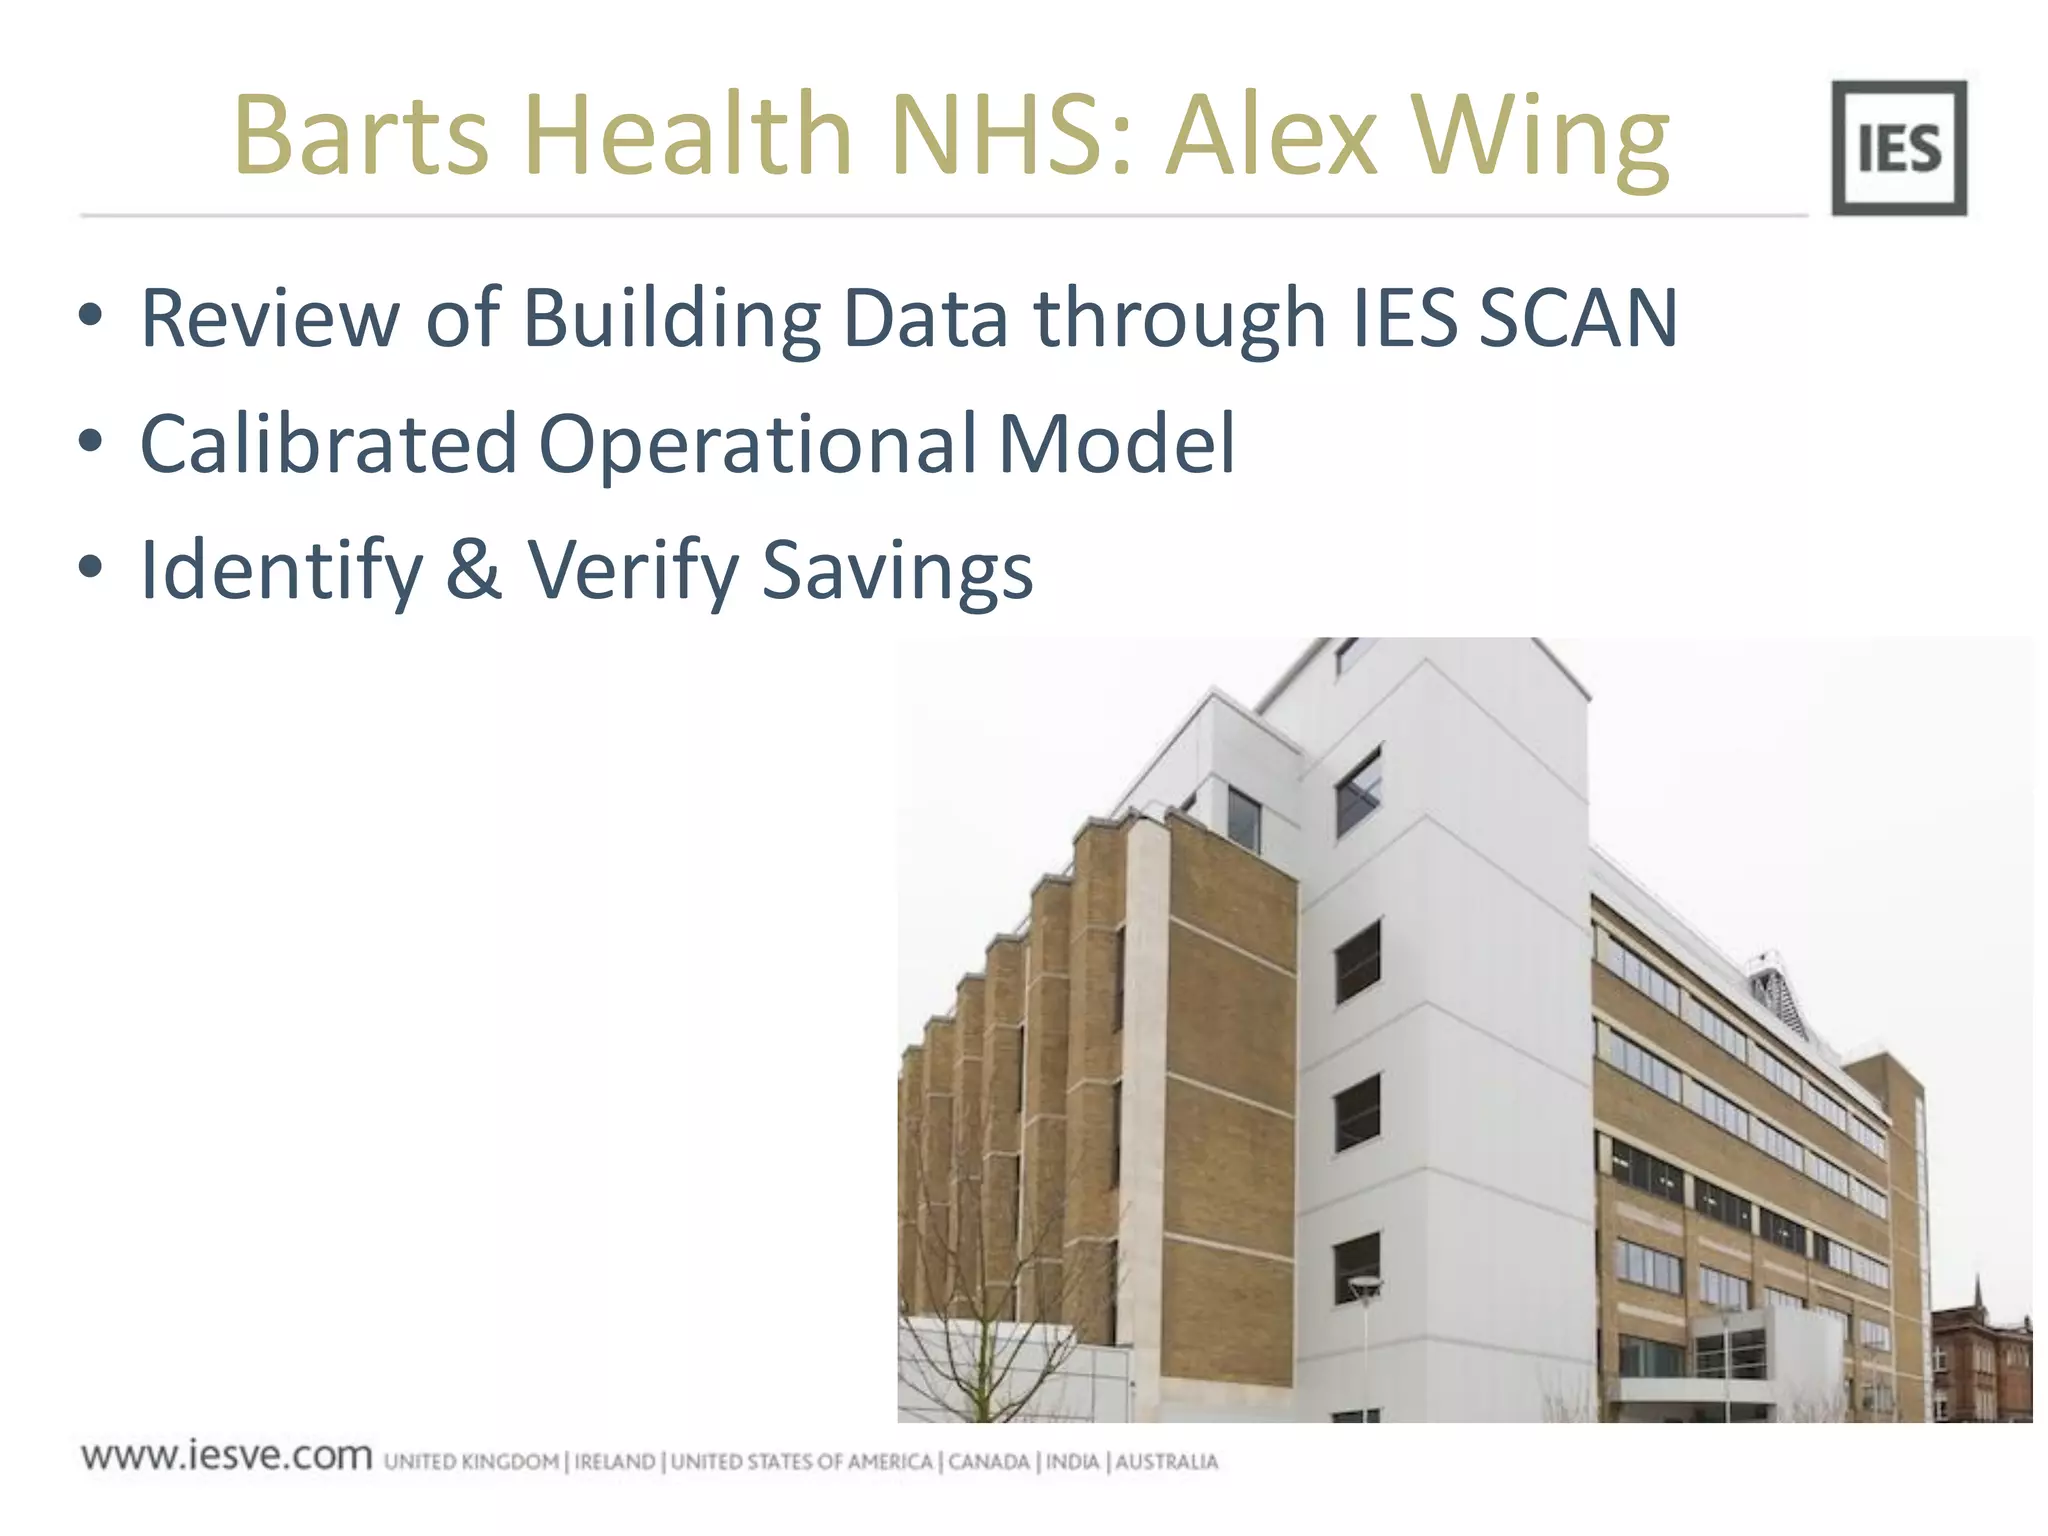
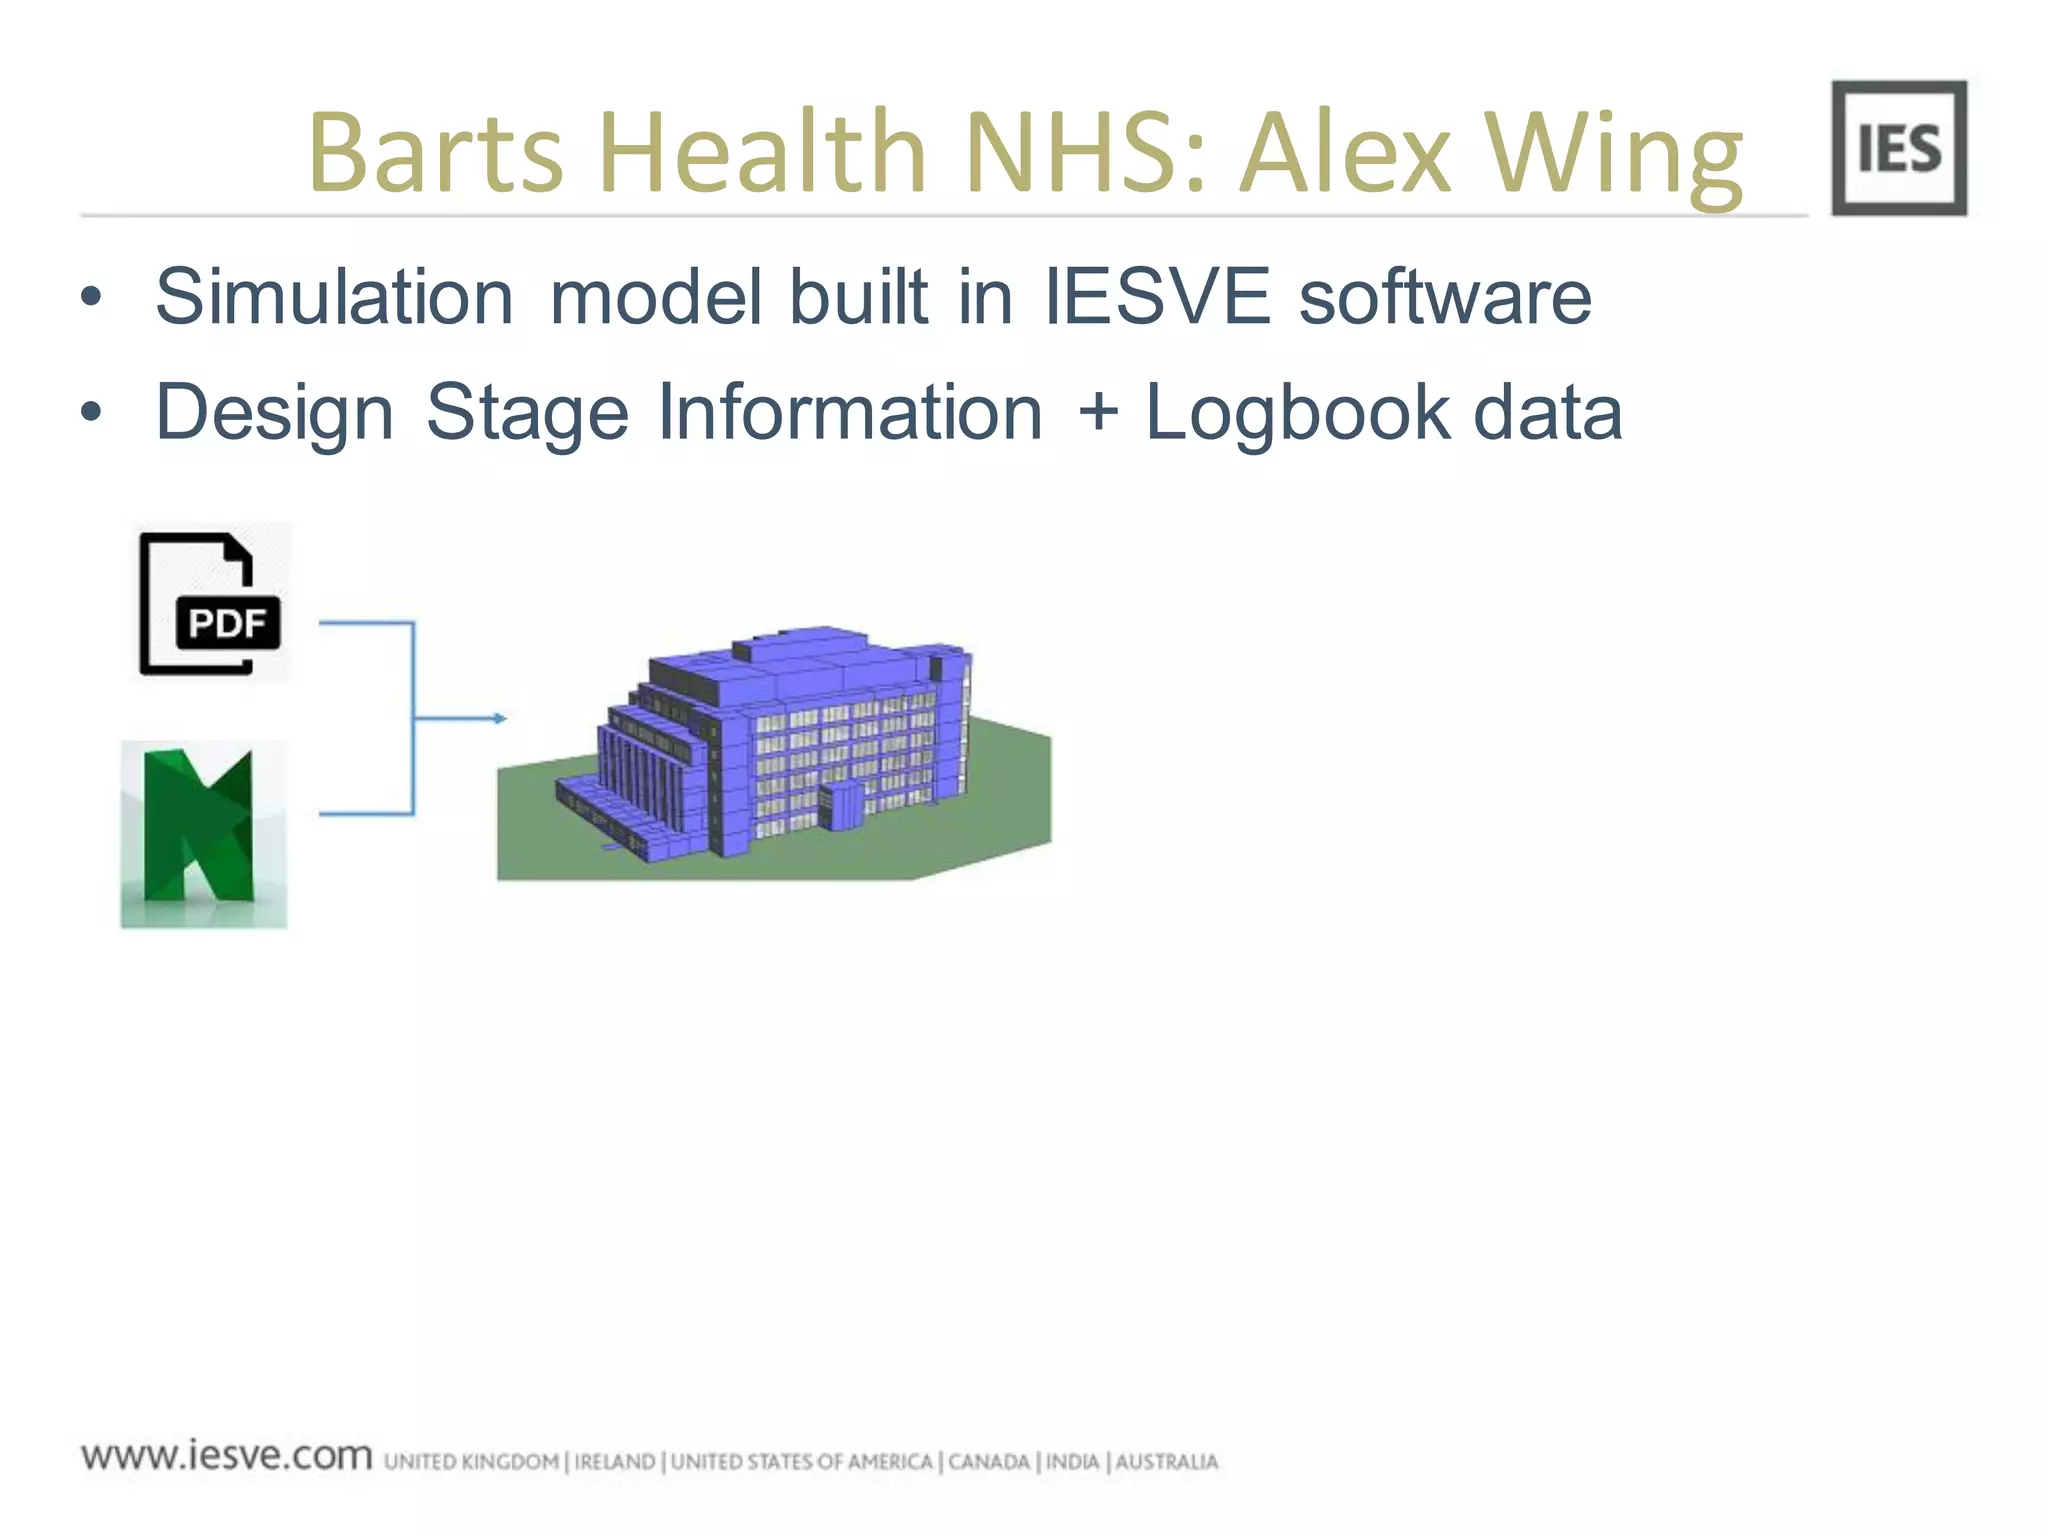
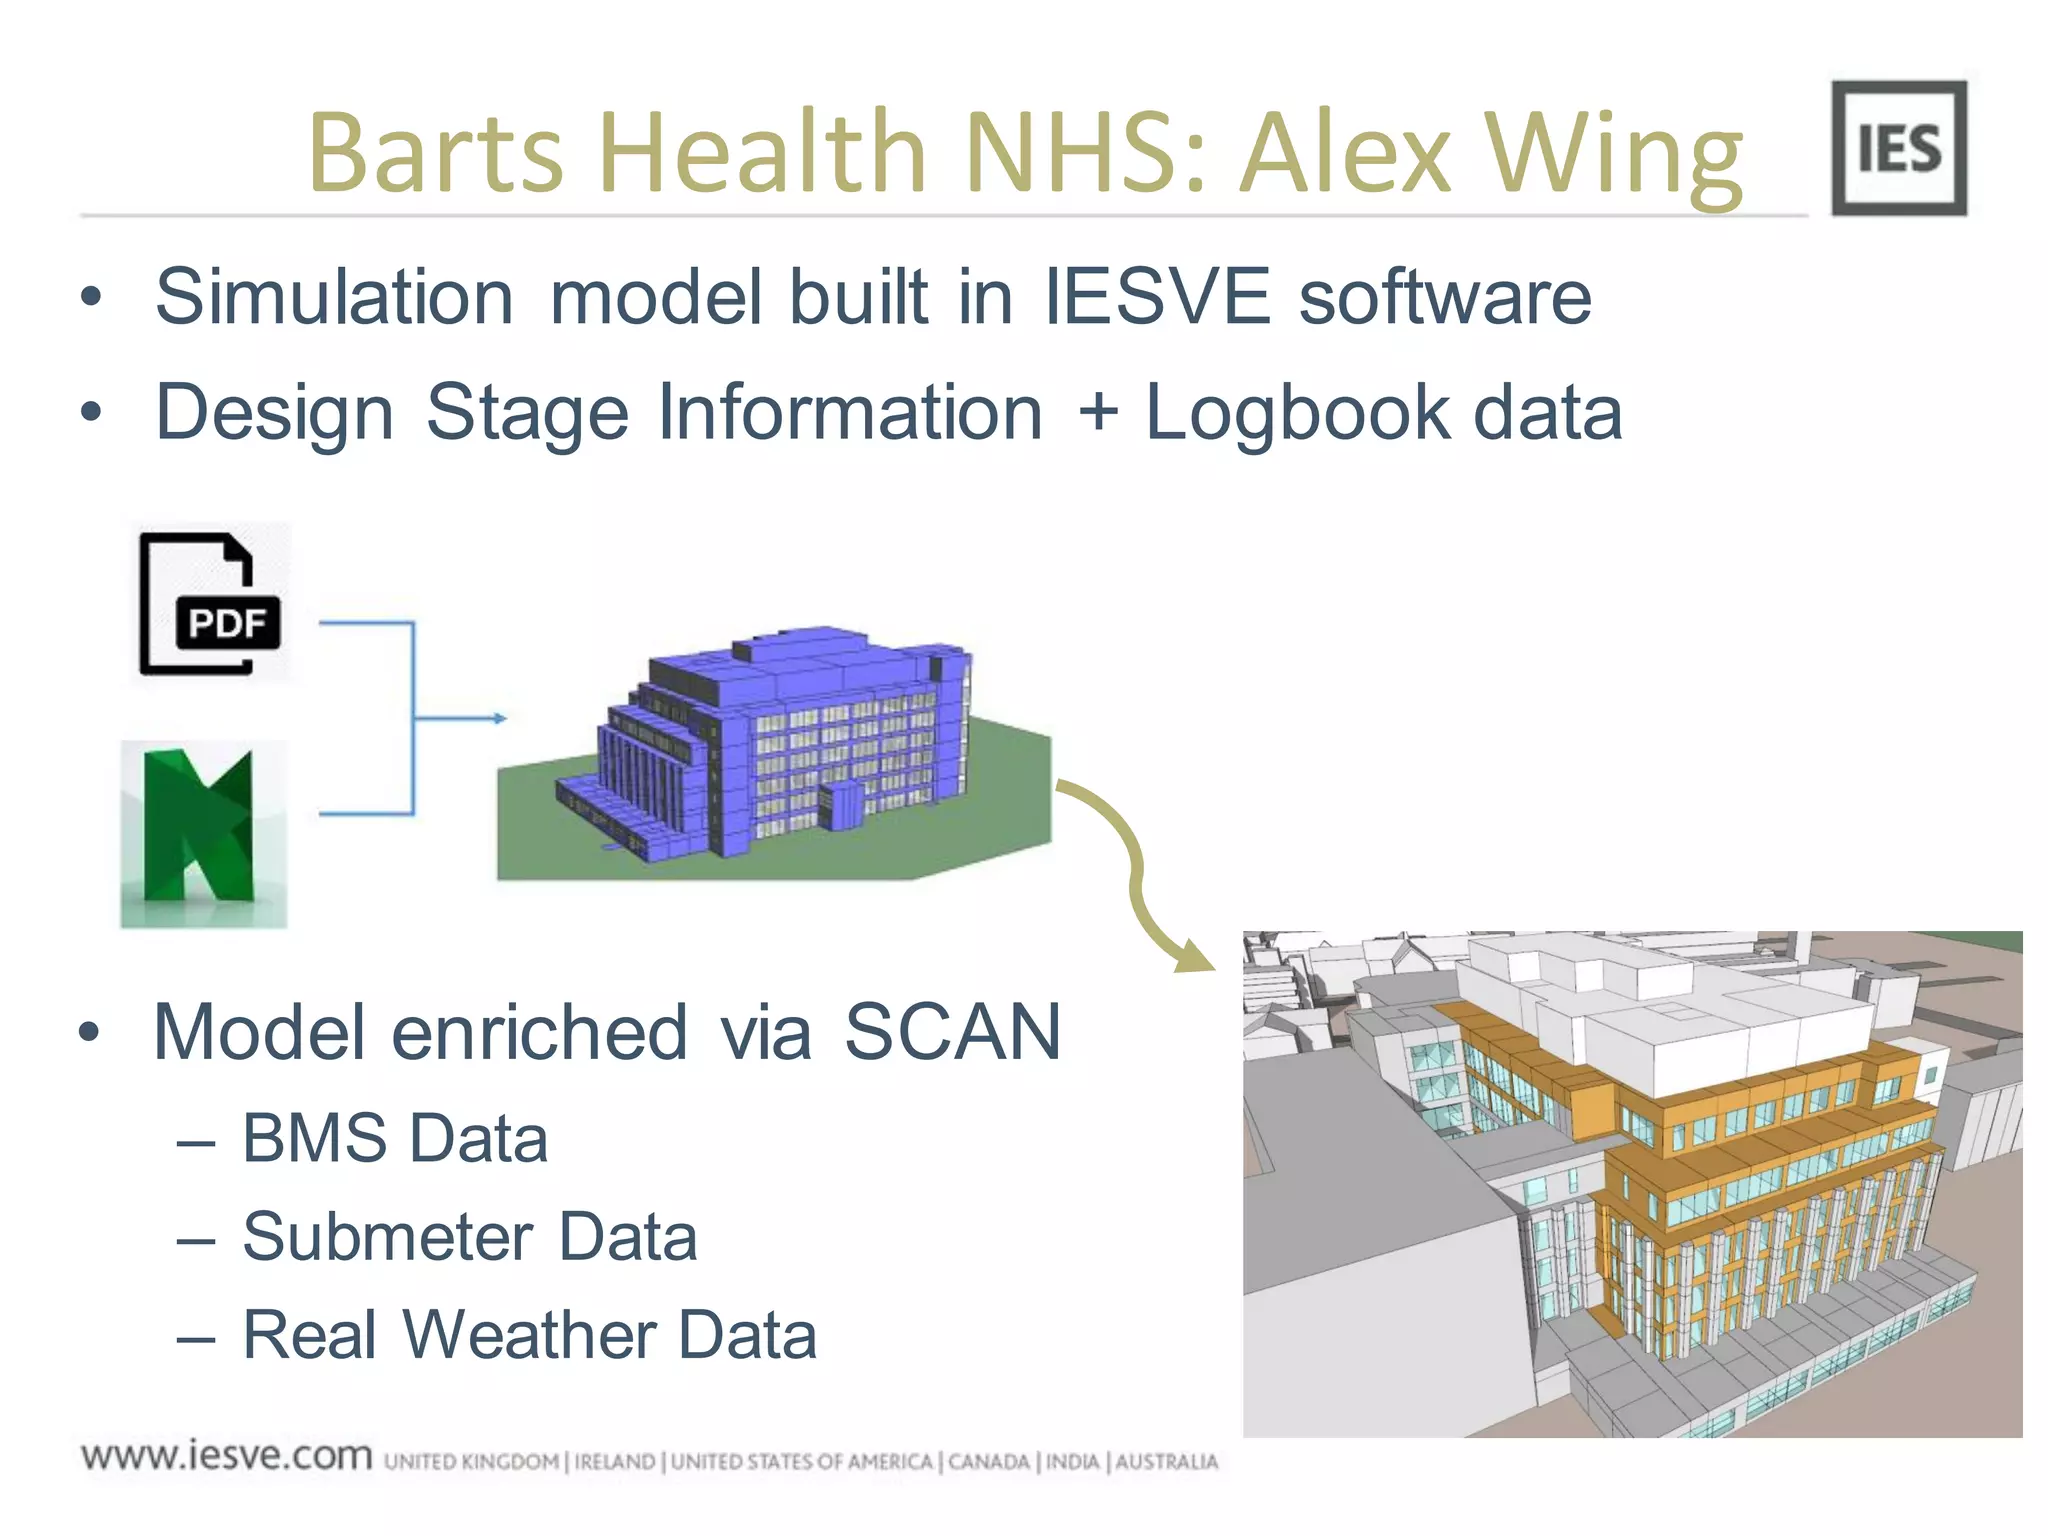
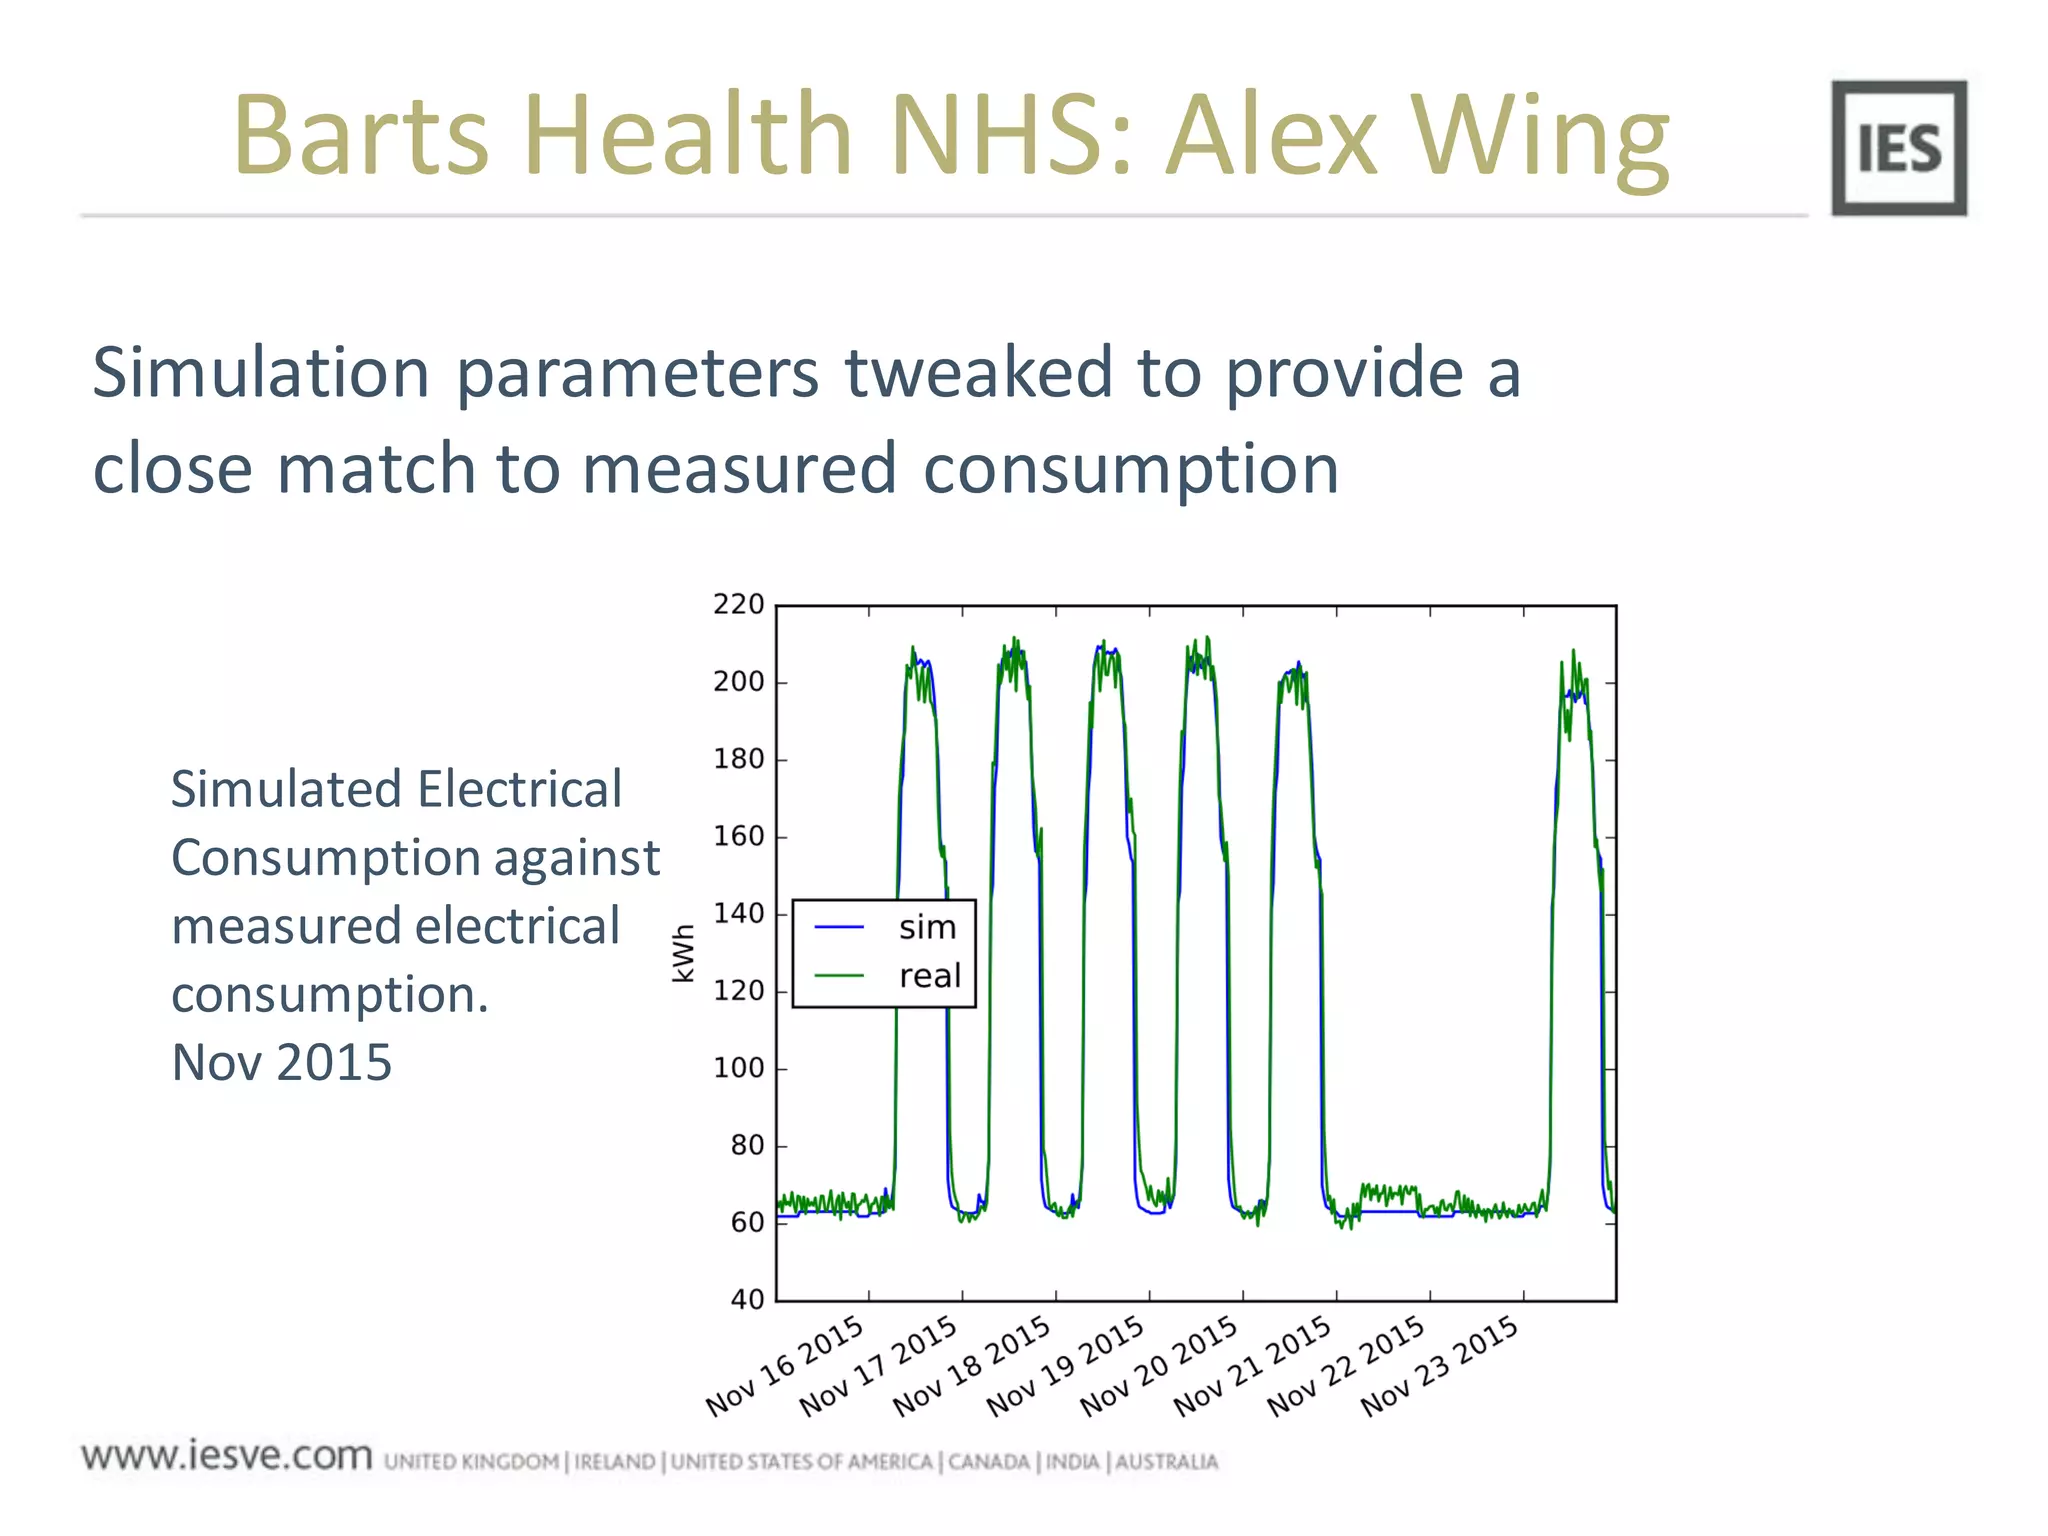
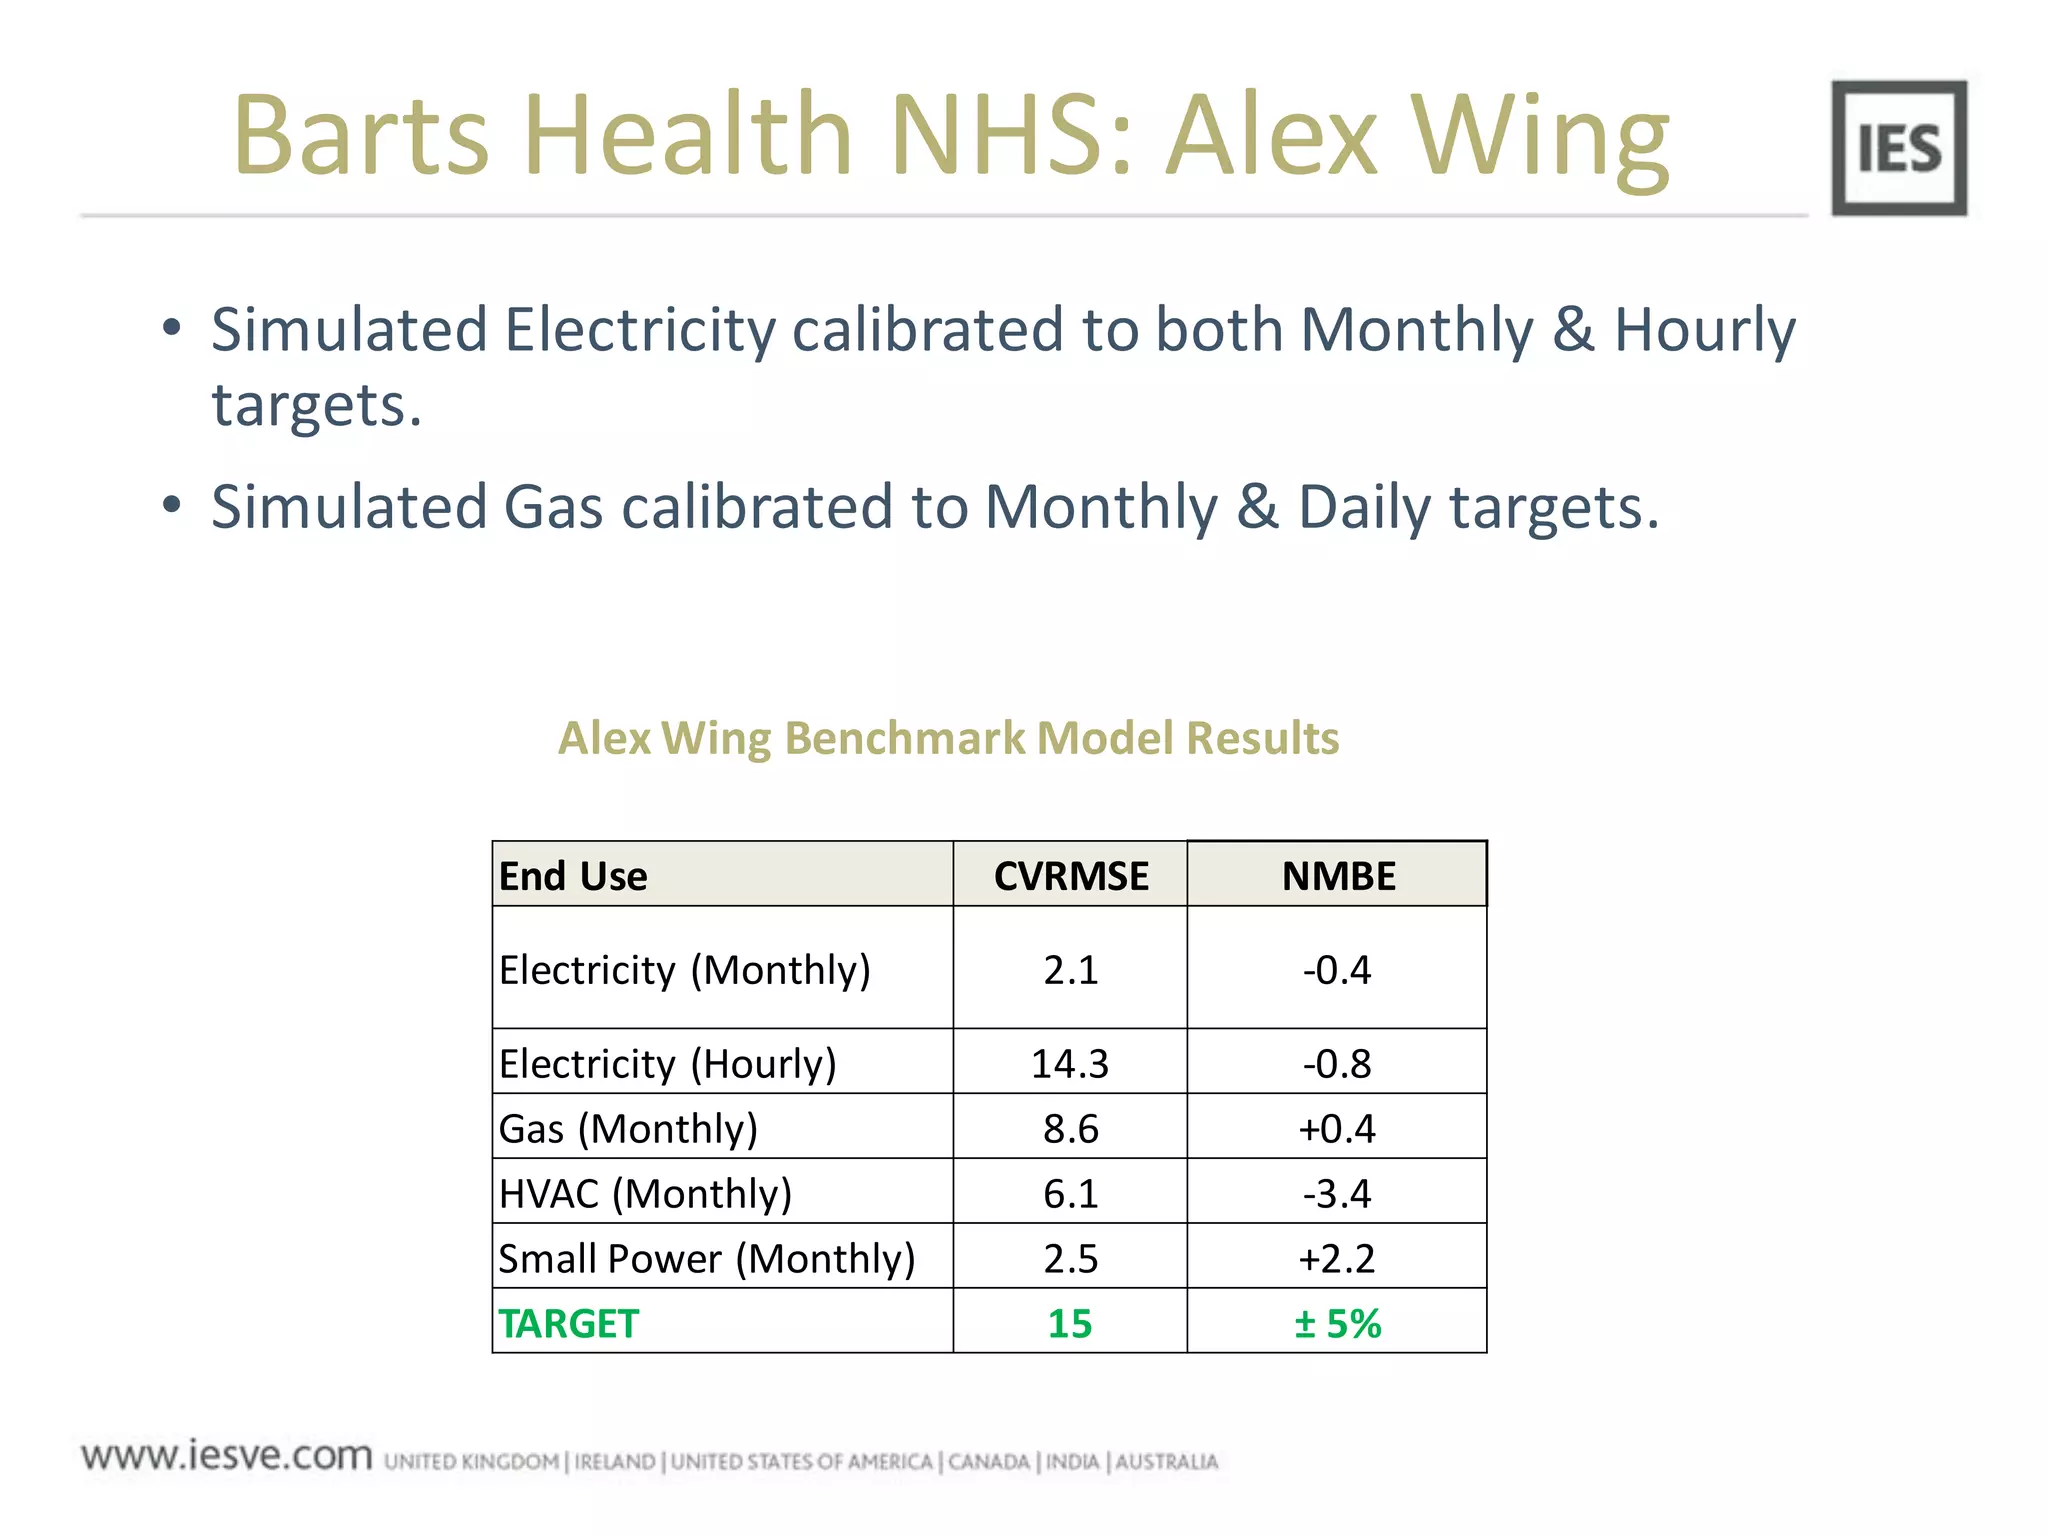
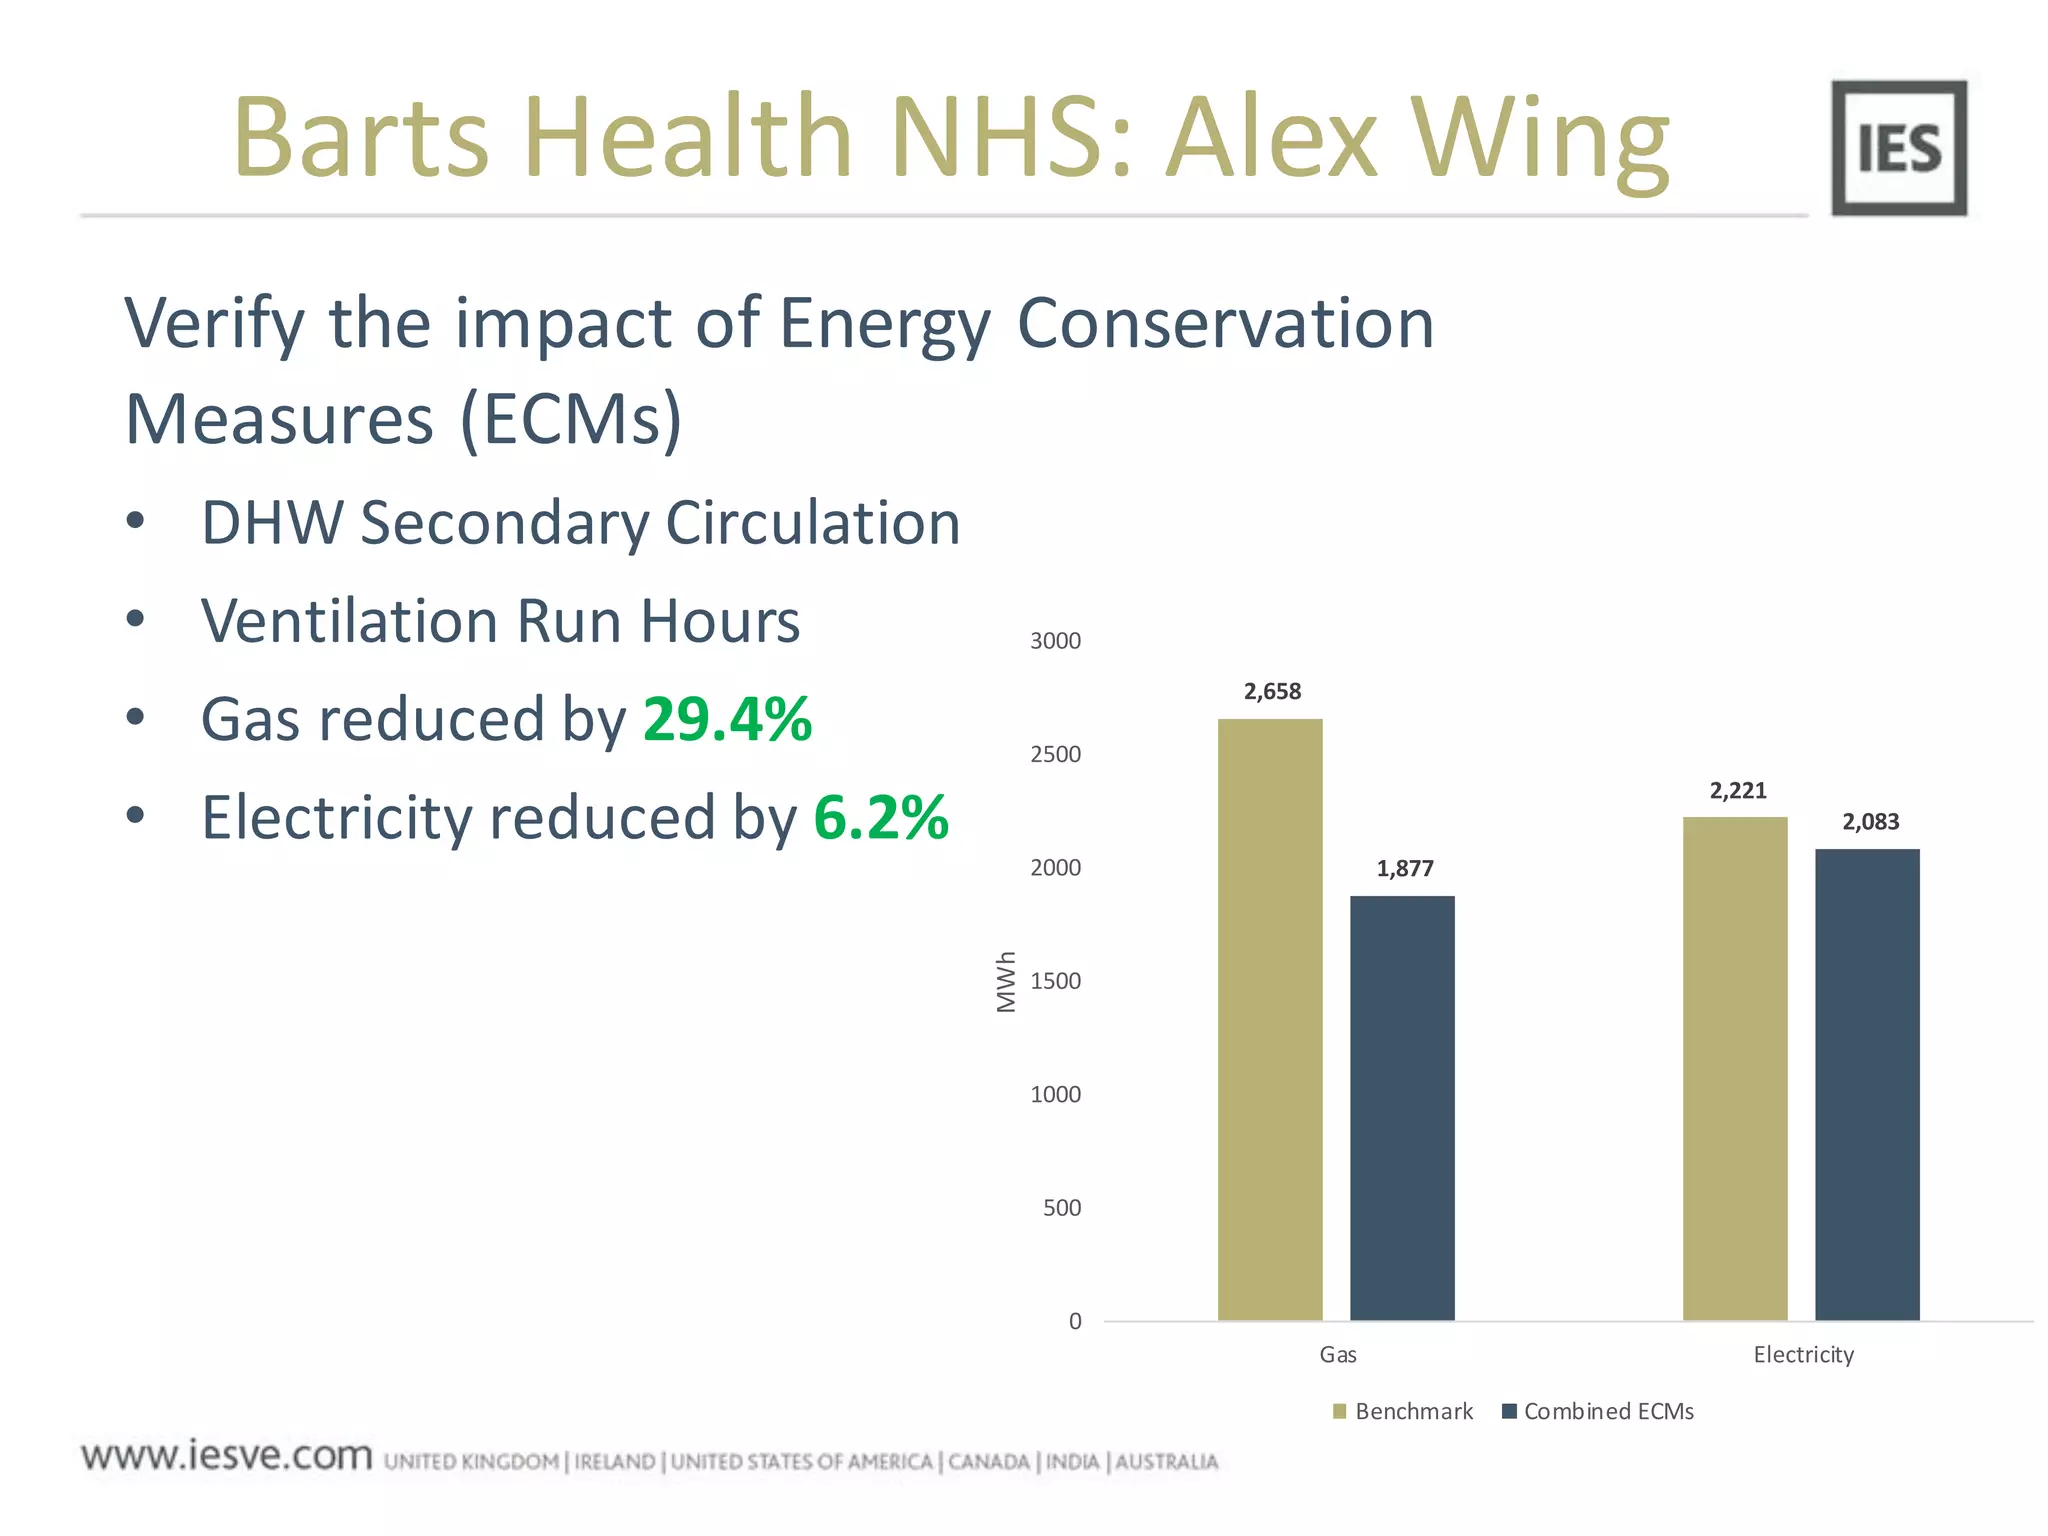
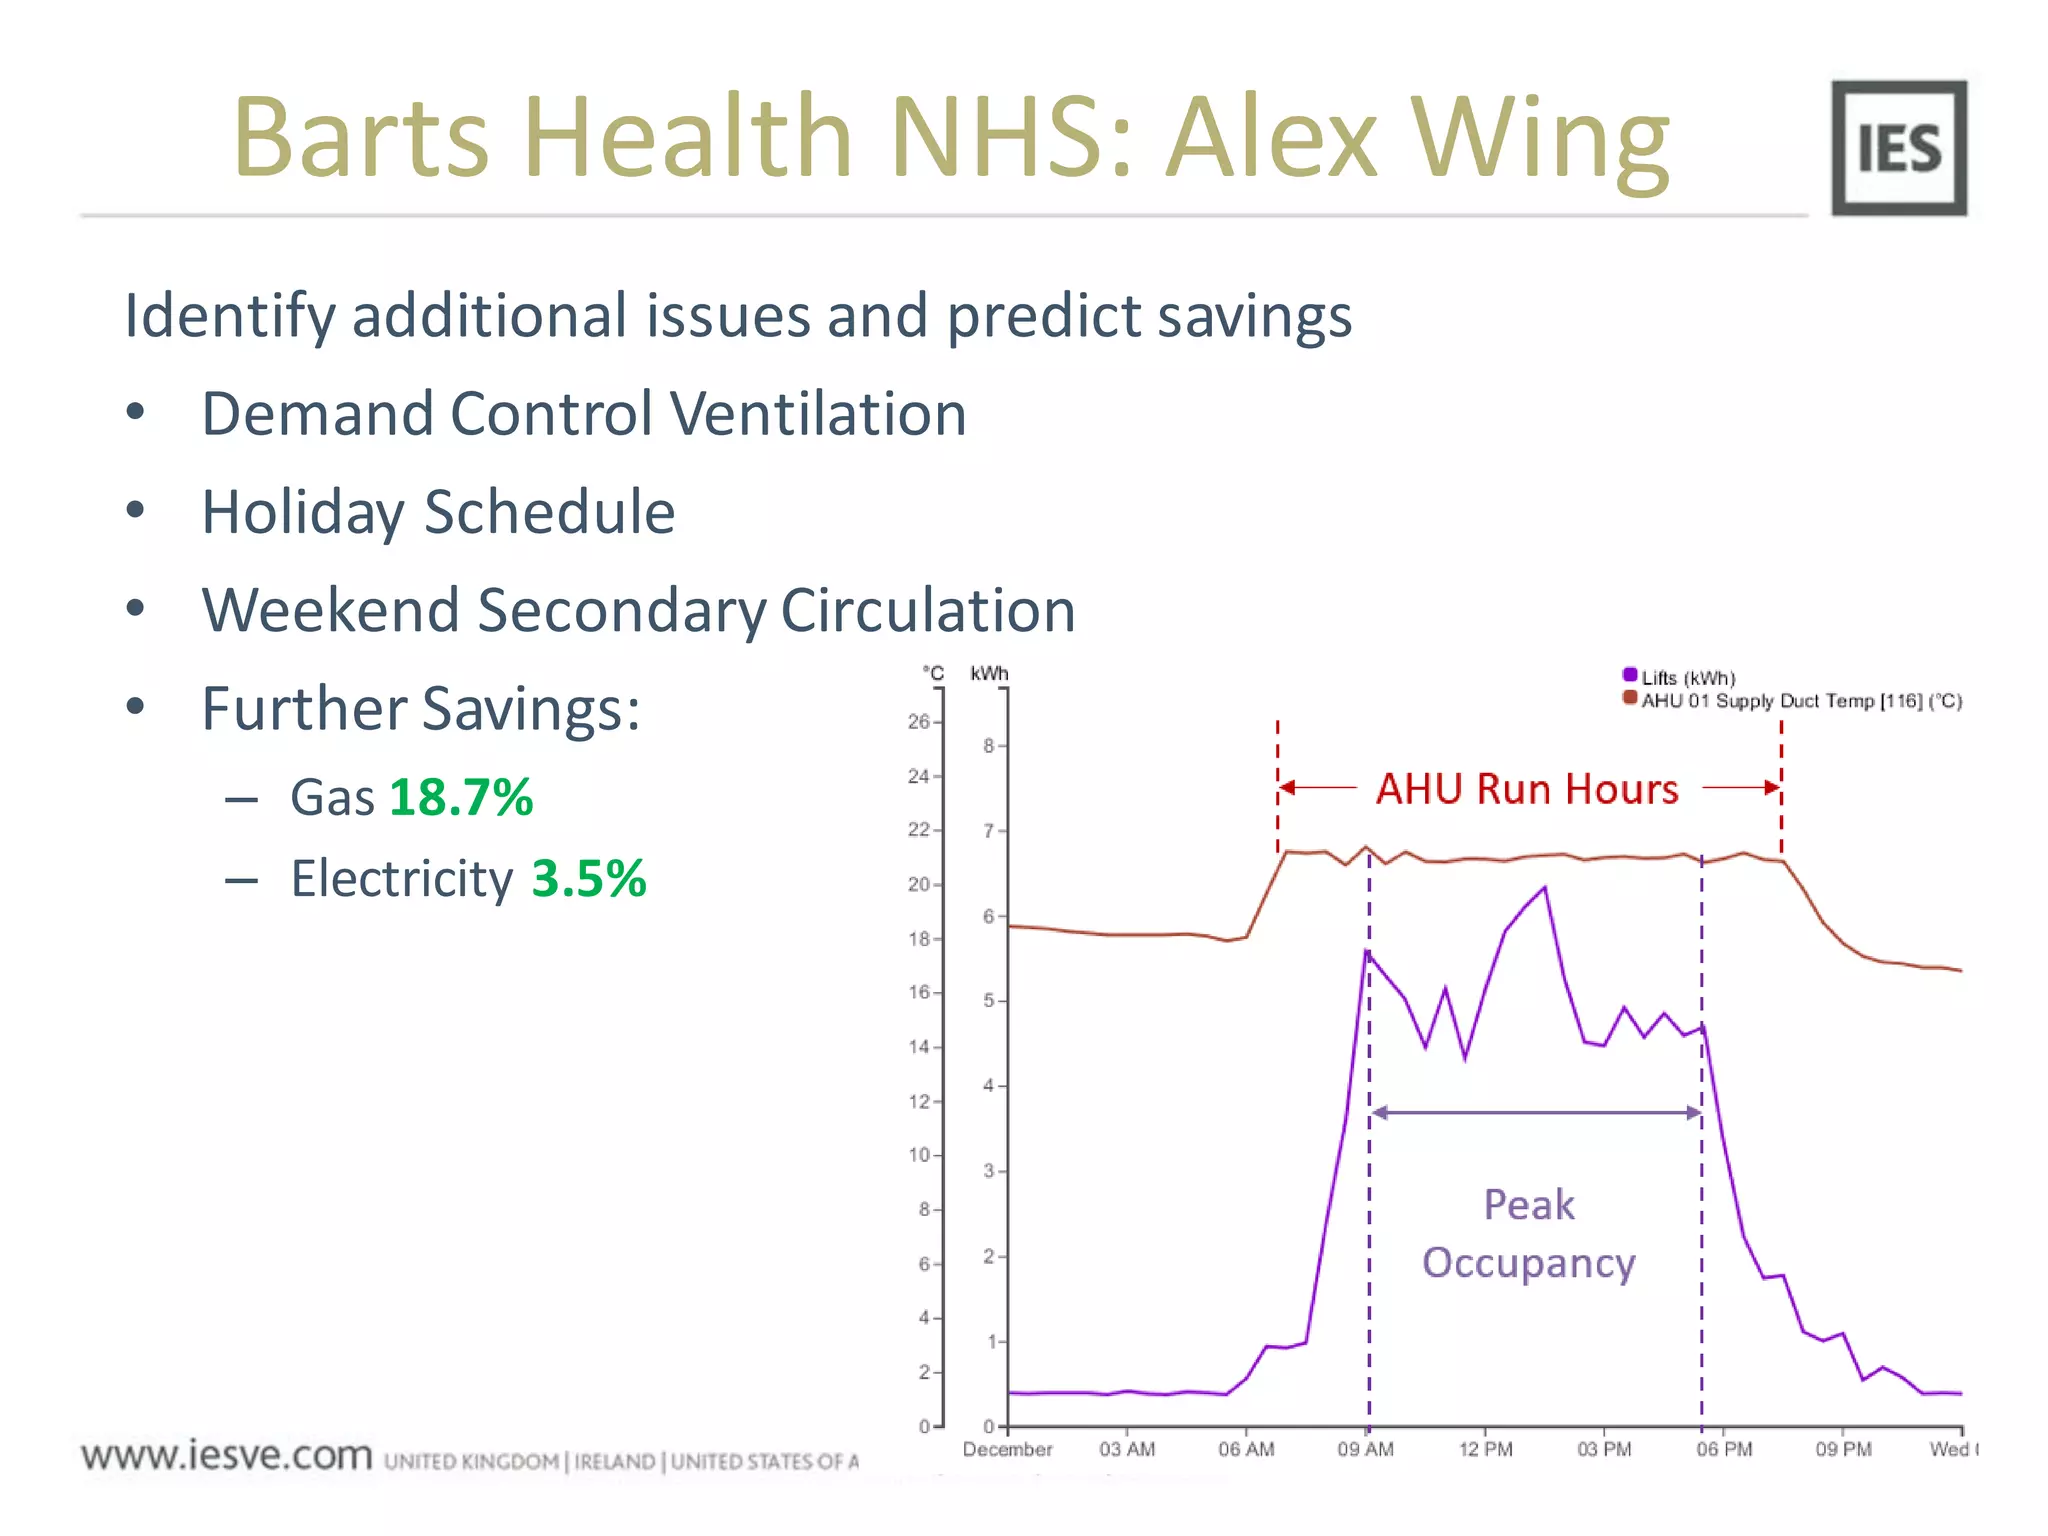
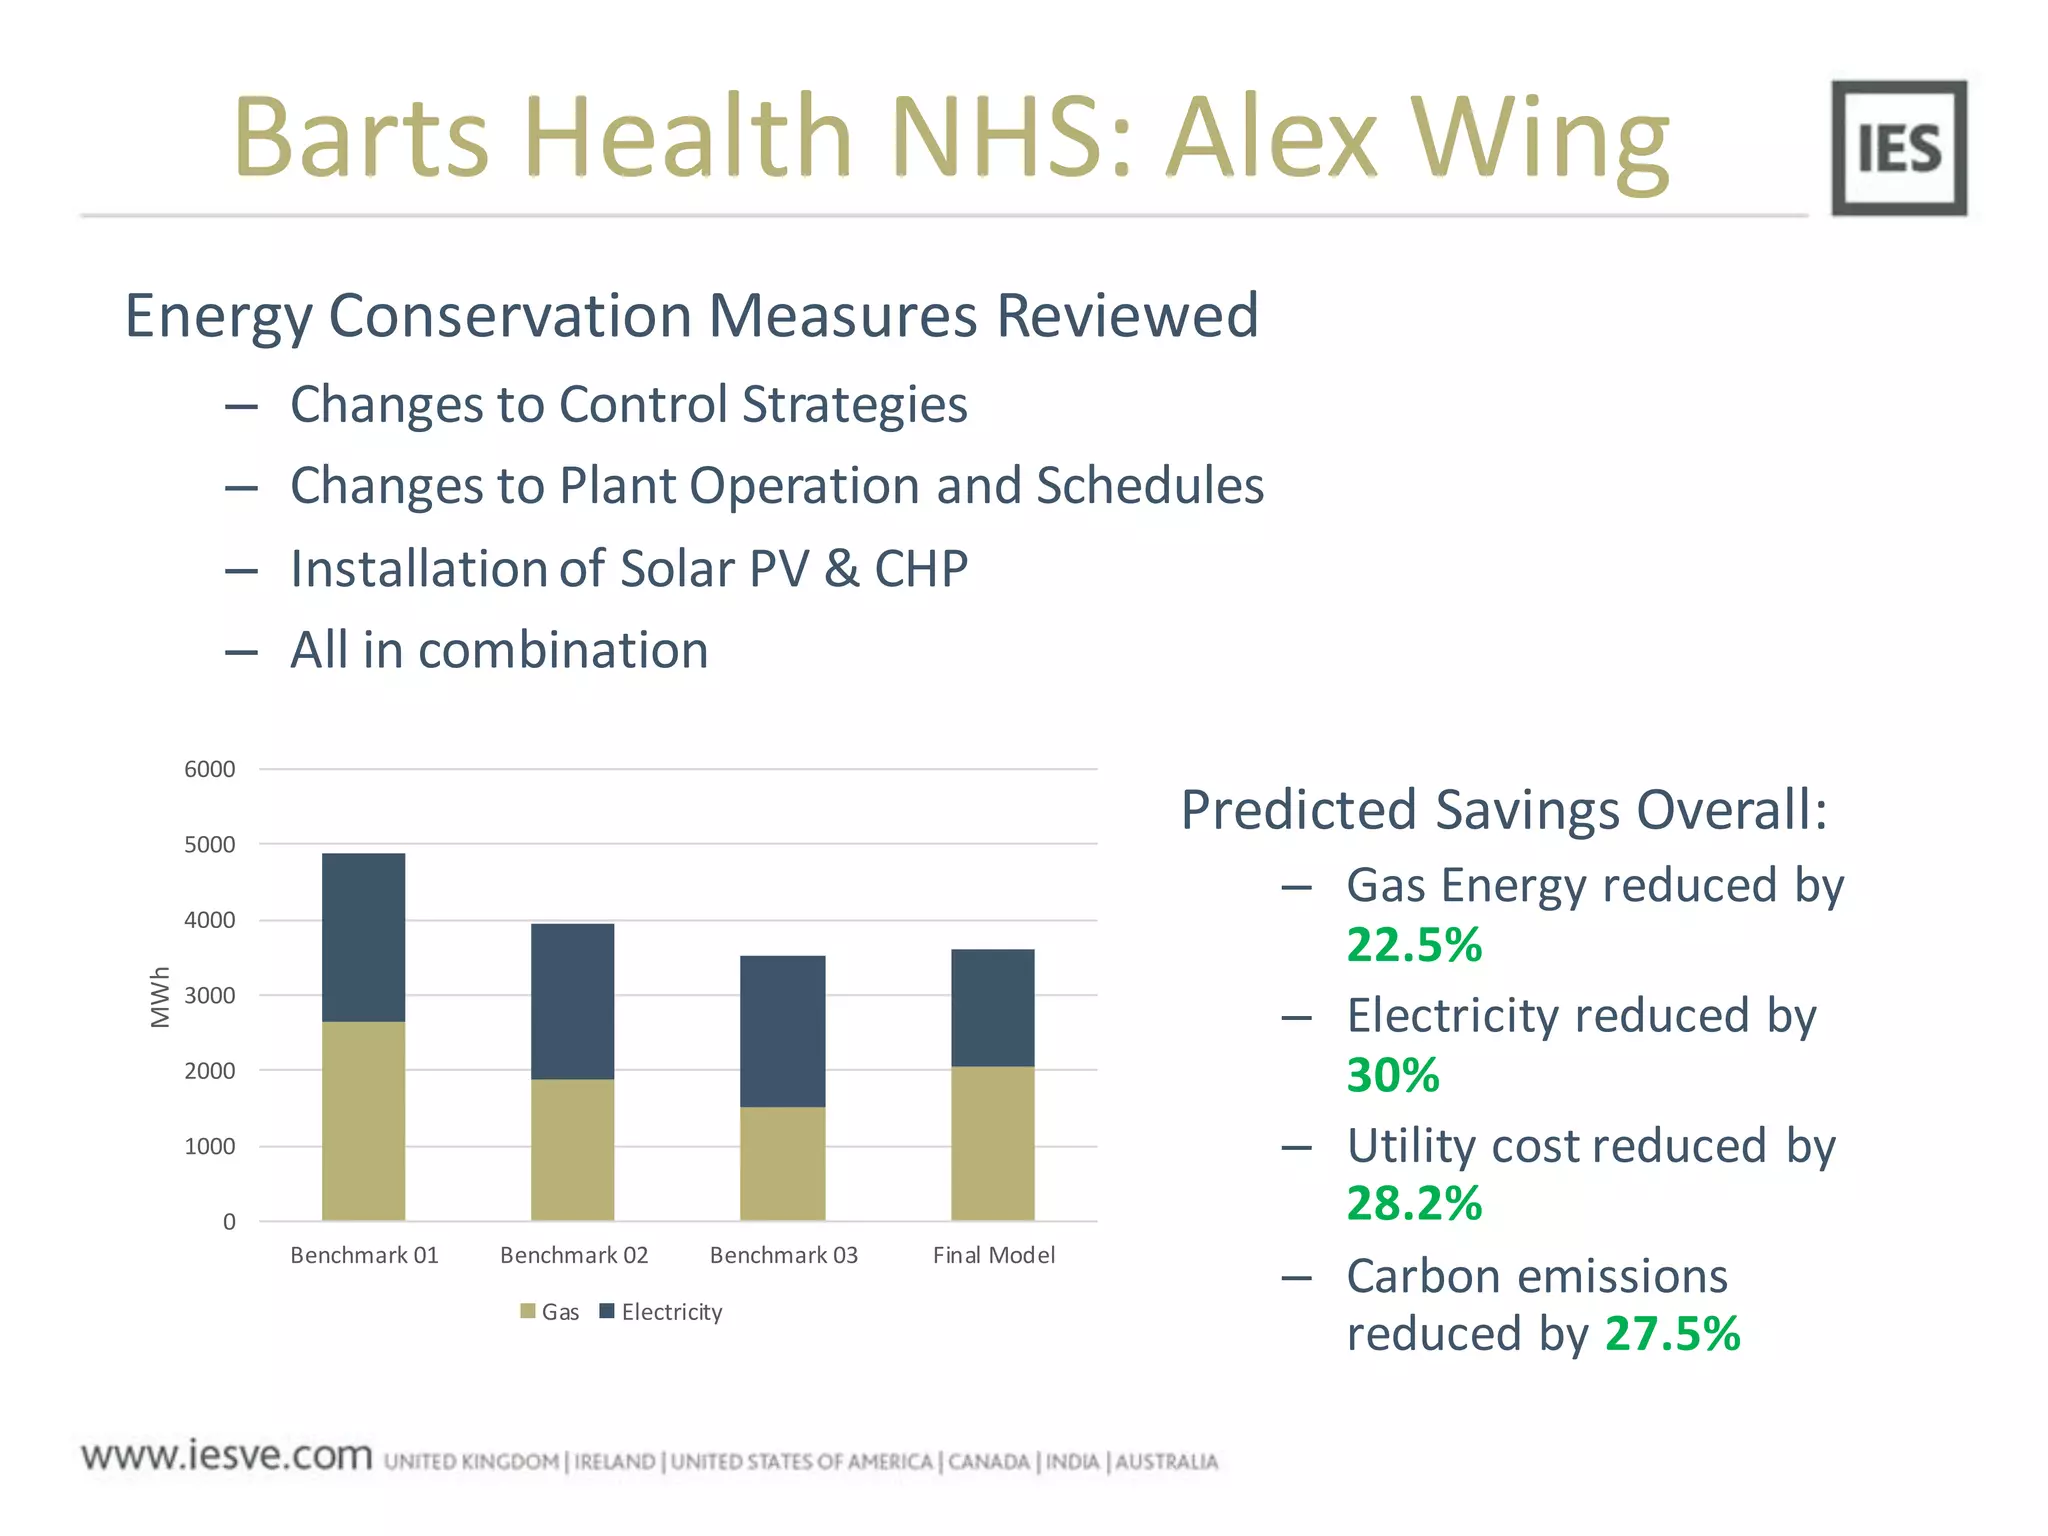


The document discusses the operational energy reduction achieved through data analysis and virtual benchmarking in a case study at Barts Health NHS, highlighting the performance gap between expected and actual building energy use. It emphasizes the importance of effective data management, calibration of operational models, and identification of energy conservation measures, resulting in significant reductions in gas and electricity consumption. Overall, the study indicates that energy cost and carbon emissions can be lowered through an integrated approach to data analysis and building performance optimization.


