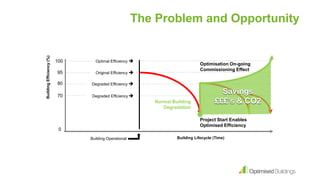
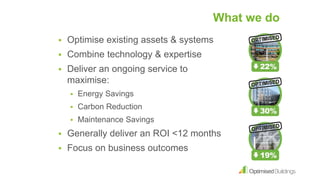
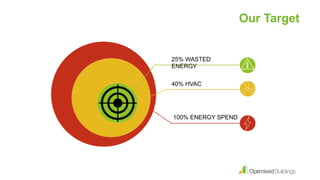
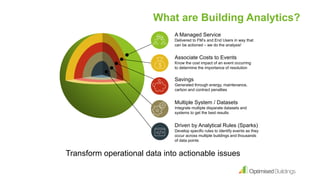
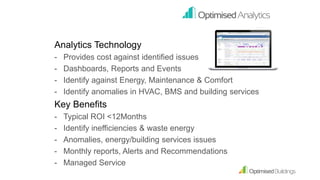
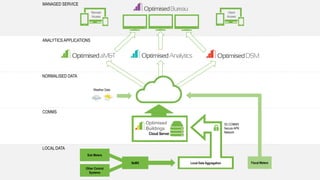
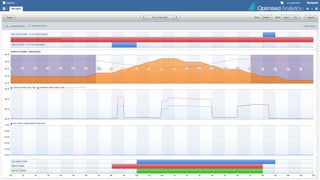
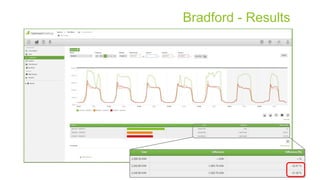
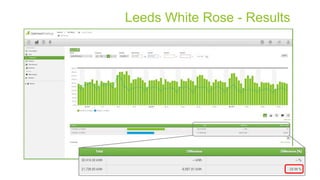
Optimising Buildings
through
BeMS Analytics
Gary Bark
Managing Director
Optimised Buildings Ltd
Paul Thomas
Energy & Environment Manager
SuperGroup Plc
BuildingEfficiency(%)
Building Operational
Normal Building
Degradation
0
70
95
80
100
Degraded Efficiency 
Optimal Efficiency 
Original Efficiency 
Optimisation On-going
Commissioning Effect
Project Start Enables
Optimised Efficiency
Building Lifecycle (Time)
Savings
£££’s & CO2
The Problem and Opportunity
What we do
 Optimise existing assets & systems
 Combine technology & expertise
 Deliver an ongoing service to
maximise:
 Energy Savings
 Carbon Reduction
 Maintenance Savings
 Generally deliver an ROI <12 months
 Focus on business outcomes
100% ENERGY SPEND
40% HVAC
25% WASTED
ENERGY
Our Target
A Managed Service
Delivered to FM’s and End Users in way that
can be actioned – we do the analysis!
Associate Costs to Events
Know the cost impact of an event occurring
to determine the importance of resolution
Savings
Generated through energy, maintenance,
carbon and contract penalties
What are Building Analytics?
Multiple System / Datasets
Integrate multiple disparate datasets and
systems to get the best results
Transform operational data into actionable issues
Driven by Analytical Rules (Sparks)
Develop specific rules to identify events as they
occur across multiple buildings and thousands
of data points
Analytics Technology
- Provides cost against identified issues
- Dashboards, Reports and Events
- Identify against Energy, Maintenance & Comfort
- Identify anomalies in HVAC, BMS and building services
Key Benefits
- Typical ROI <12Months
- Identify inefficiencies & waste energy
- Anomalies, energy/building services issues
- Monthly reports, Alerts and Recommendations
- Managed Service
Fiscal Meters
Sub Meters
BeMS
Other Control
Systems
Weather Data
Client
Access
LOCAL DATA
COMMS
NORMALISED DATA
MANAGED SERVICE
Optimised
Buildings
Cloud Server
ANALYTICS APPLICATIONS
3G COMMS
Secure APN
Network
Local Data Aggregation
Remote
Access
 515 Branded locations / 46
Countries
 139 owned stores
(UK/Europe)
 208 franchised / licensed
stores
 168 concessions
 £1.2bn in Brand Revenue
(2017)
 Every geography has
grown every year for last 5
years
 USA roll out in progress
Background
Application
 2014 - Programme to standardise and install controls
 Tridium selected - now deployed in 100 Stores
 Monitoring and Control
 Door Heaters
 Store Lighting
 Split AC Units
 HVAC Sub Metering
 Interlocked with Security System
 Tridium Niagara Hosted in the cloud
 aM&T monitoring fiscal meters from each store
Challenge
 Optimised Buildings advised that after
review of:
 Energy Data
 BeMS Graphics
 Description of Operation
that around 10% of the energy being
consumed where new controls had been
installed could be saved
 10 stores selected as a pilot for Optimised
Buildings to deliver their “Managed
Service” approach
-10%
TARGET
Process
 Defined process for issues
identified
 Remote diagnostics
 Savings on call-outs through
deployment of right trade, first time
 Integrated with:
 FM help desk
 Automated Alarms
 Contractors
 Instore staff
Bradford - Results
Leeds White Rose - Results
Overall Performance
18%
Case Study
 Increased to 26 Stores
UK stores
 Savings now at 18%
across the stores
 ROI in less than 4
Months
 Delivering responsive and
proactive controls
changes to maximise
savings!Case Study available on
Optimised Buildings Stand D5

Optimising Buildings through BeMS Analytics

  • 1.
    Optimising Buildings through BeMS Analytics GaryBark Managing Director Optimised Buildings Ltd Paul Thomas Energy & Environment Manager SuperGroup Plc
  • 3.
    BuildingEfficiency(%) Building Operational Normal Building Degradation 0 70 95 80 100 DegradedEfficiency  Degraded Efficiency  Optimal Efficiency  Original Efficiency  Optimisation On-going Commissioning Effect Project Start Enables Optimised Efficiency Building Lifecycle (Time) Savings £££’s & CO2 The Problem and Opportunity
  • 4.
    What we do Optimise existing assets & systems  Combine technology & expertise  Deliver an ongoing service to maximise:  Energy Savings  Carbon Reduction  Maintenance Savings  Generally deliver an ROI <12 months  Focus on business outcomes
  • 5.
    100% ENERGY SPEND 40%HVAC 25% WASTED ENERGY Our Target
  • 6.
    A Managed Service Deliveredto FM’s and End Users in way that can be actioned – we do the analysis! Associate Costs to Events Know the cost impact of an event occurring to determine the importance of resolution Savings Generated through energy, maintenance, carbon and contract penalties What are Building Analytics? Multiple System / Datasets Integrate multiple disparate datasets and systems to get the best results Transform operational data into actionable issues Driven by Analytical Rules (Sparks) Develop specific rules to identify events as they occur across multiple buildings and thousands of data points
  • 7.
    Analytics Technology - Providescost against identified issues - Dashboards, Reports and Events - Identify against Energy, Maintenance & Comfort - Identify anomalies in HVAC, BMS and building services Key Benefits - Typical ROI <12Months - Identify inefficiencies & waste energy - Anomalies, energy/building services issues - Monthly reports, Alerts and Recommendations - Managed Service
  • 8.
    Fiscal Meters Sub Meters BeMS OtherControl Systems Weather Data Client Access LOCAL DATA COMMS NORMALISED DATA MANAGED SERVICE Optimised Buildings Cloud Server ANALYTICS APPLICATIONS 3G COMMS Secure APN Network Local Data Aggregation Remote Access
  • 15.
     515 Brandedlocations / 46 Countries  139 owned stores (UK/Europe)  208 franchised / licensed stores  168 concessions  £1.2bn in Brand Revenue (2017)  Every geography has grown every year for last 5 years  USA roll out in progress Background
  • 16.
    Application  2014 -Programme to standardise and install controls  Tridium selected - now deployed in 100 Stores  Monitoring and Control  Door Heaters  Store Lighting  Split AC Units  HVAC Sub Metering  Interlocked with Security System  Tridium Niagara Hosted in the cloud  aM&T monitoring fiscal meters from each store
  • 17.
    Challenge  Optimised Buildingsadvised that after review of:  Energy Data  BeMS Graphics  Description of Operation that around 10% of the energy being consumed where new controls had been installed could be saved  10 stores selected as a pilot for Optimised Buildings to deliver their “Managed Service” approach -10% TARGET
  • 18.
    Process  Defined processfor issues identified  Remote diagnostics  Savings on call-outs through deployment of right trade, first time  Integrated with:  FM help desk  Automated Alarms  Contractors  Instore staff
  • 21.
  • 22.
  • 23.
  • 24.
    18% Case Study  Increasedto 26 Stores UK stores  Savings now at 18% across the stores  ROI in less than 4 Months  Delivering responsive and proactive controls changes to maximise savings!Case Study available on Optimised Buildings Stand D5