Download as PDF, PPTX


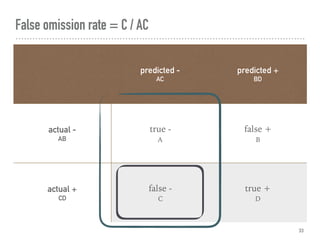
![Confusion matrix, where A = 002 = C[0, 0]
26
predicted -
AC
predicted +
BD
actual -
AB
true -
A
false +
B
actual +
CD
false -
C
true +
D](https://image.slidesharecdn.com/hypothesistestingwithpython-180710010048/85/Hypothesis-Testing-With-Python-26-320.jpg)
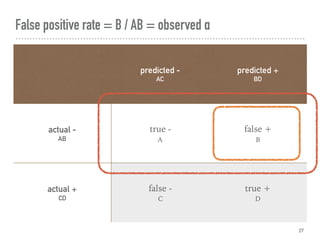
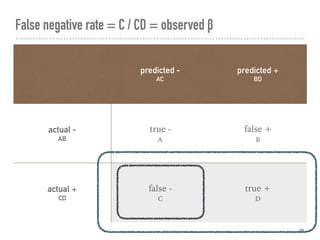
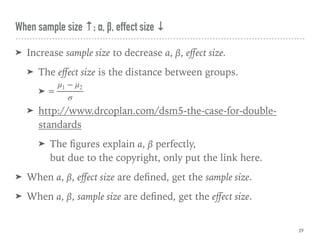
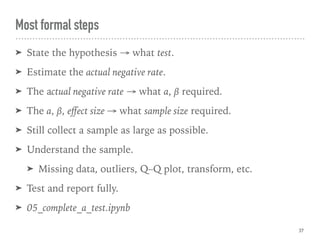

This document discusses hypothesis testing in Python. It covers simulating and analyzing test datasets, how hypothesis tests work, common statistical tests like t-tests and chi-squared tests, and steps for completing a hypothesis test. Key points include defining the null and alternative hypotheses, estimating error rates from a confusion matrix, determining necessary sample sizes based on desired alpha and beta levels, and fully reporting test results. Other statistical analyses like correlation and regression are also briefly mentioned. Overall the document provides an introduction to performing and interpreting hypothesis tests in Python.


![[2020 CVPR Efficient DET paper review]](https://cdn.slidesharecdn.com/ss_thumbnails/efficientdetleechanhyuk-210615060443-thumbnail.jpg?width=640&height=640&fit=bounds)


![Hacking-Uncovered-How-People-Get-Hacked-and-How-to-Stay-Safe[1].pptx](https://cdn.slidesharecdn.com/ss_thumbnails/hacking-uncovered-how-people-get-hacked-and-how-to-stay-safe1-260130170011-4883a9c7-thumbnail.jpg?width=640&height=640&fit=bounds)


![제 23회 보아즈(BOAZ) 빅데이터 컨퍼런스 - [MBOAX] : ABSA를 활용한 소비자 반응 분석 기반 운영 효율화 대시보드 설계](https://cdn.slidesharecdn.com/ss_thumbnails/3-1boaz23rdconferencemboax-260203102709-9d519923-thumbnail.jpg?width=640&height=640&fit=bounds)

