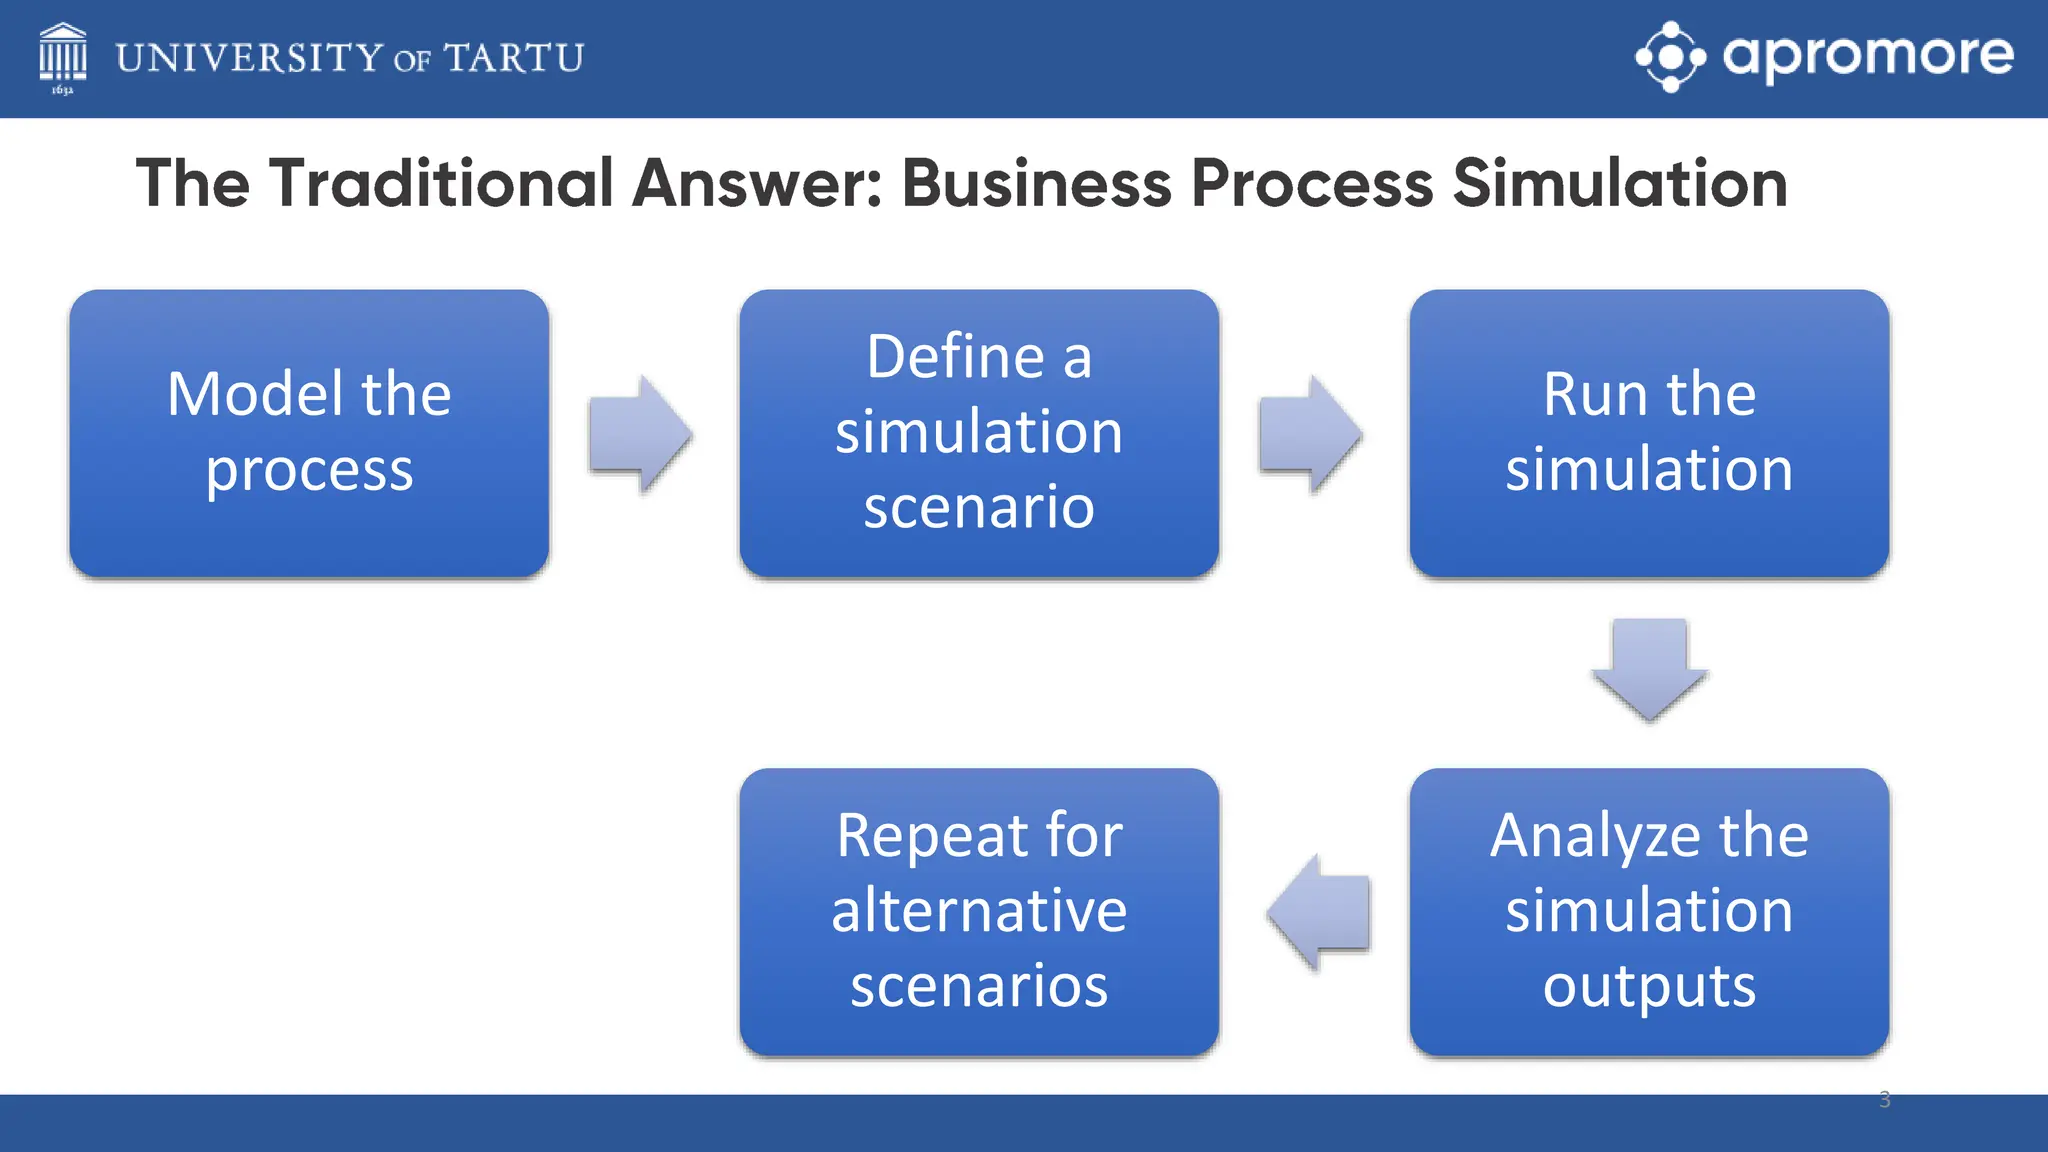
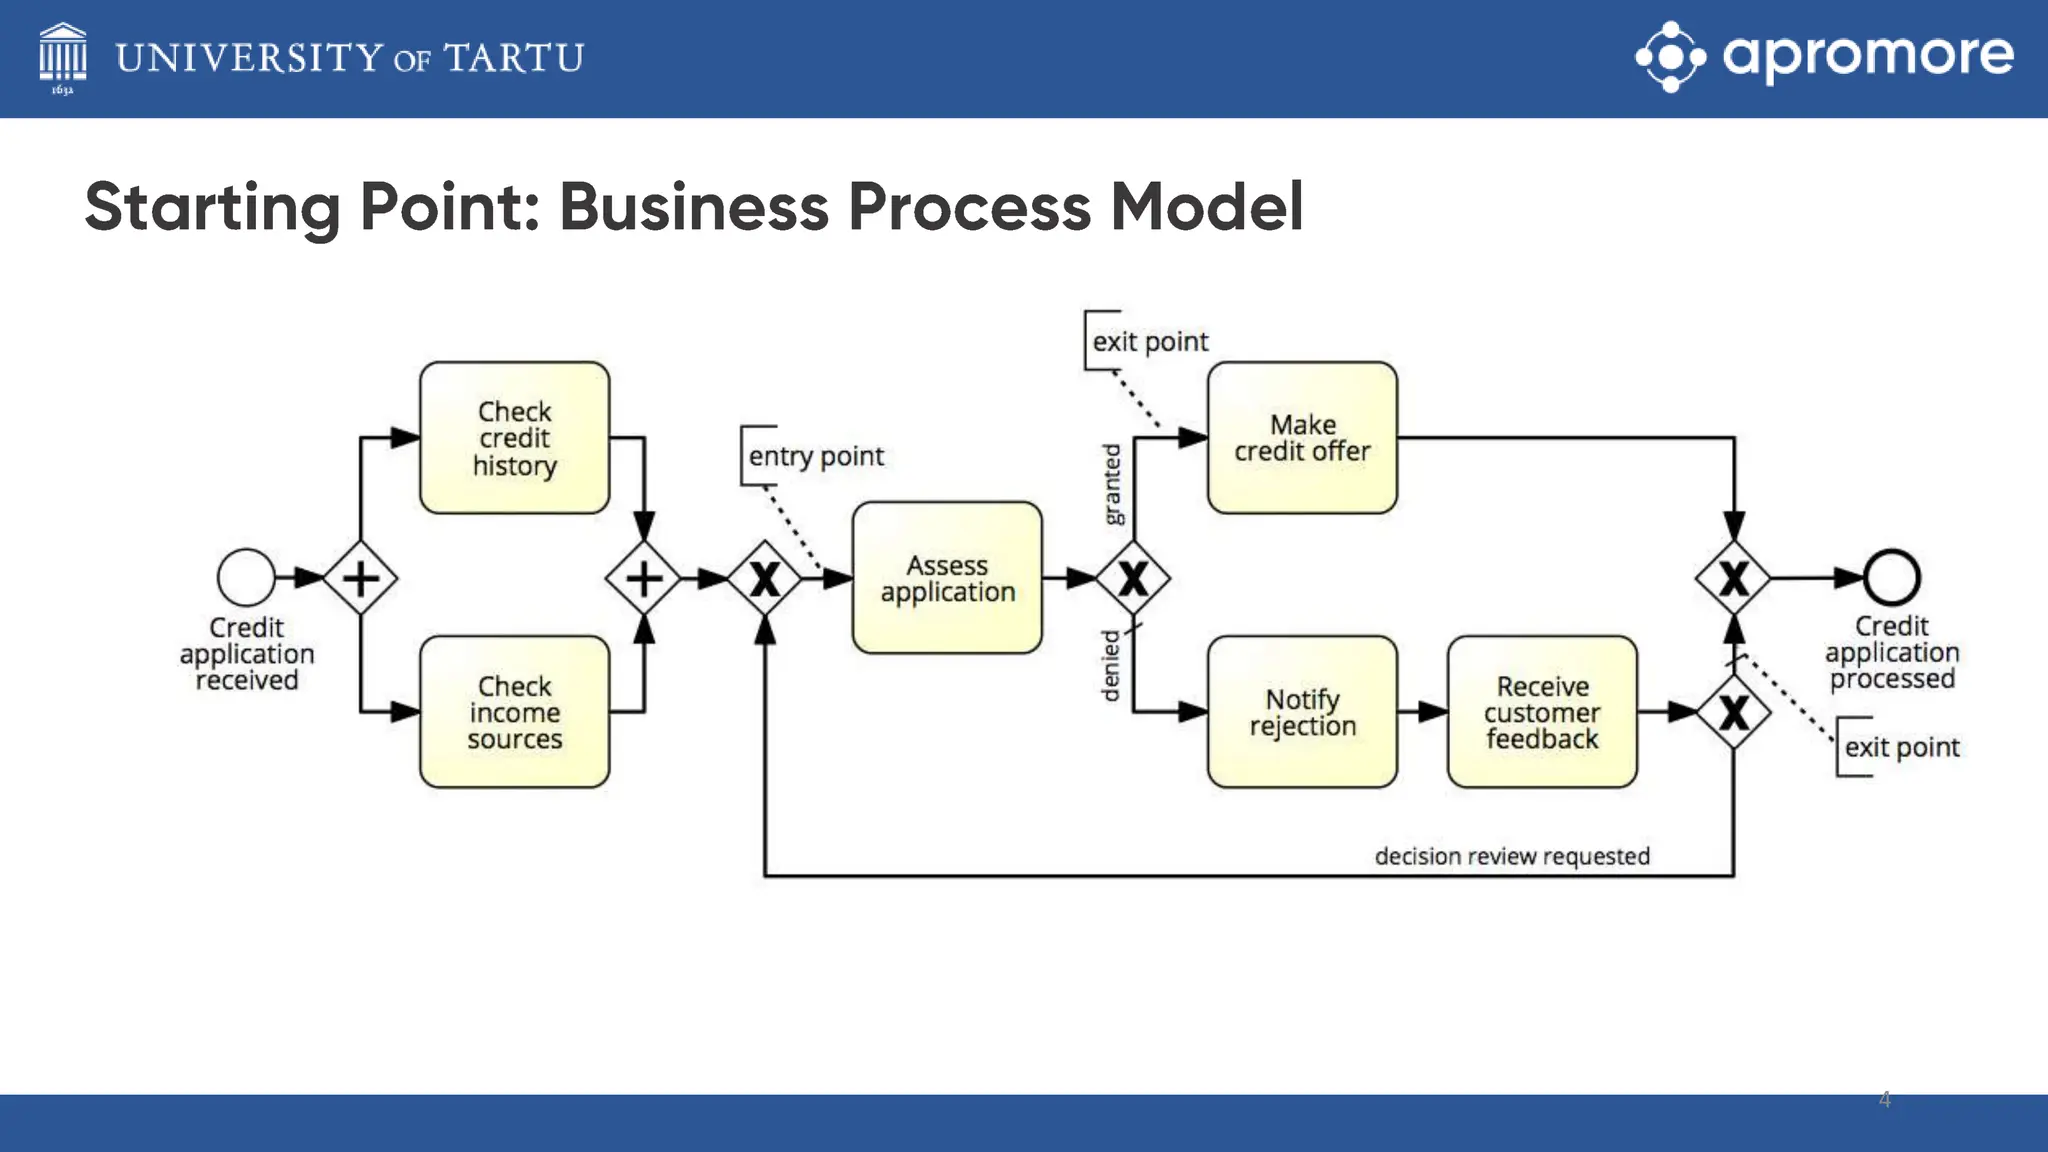
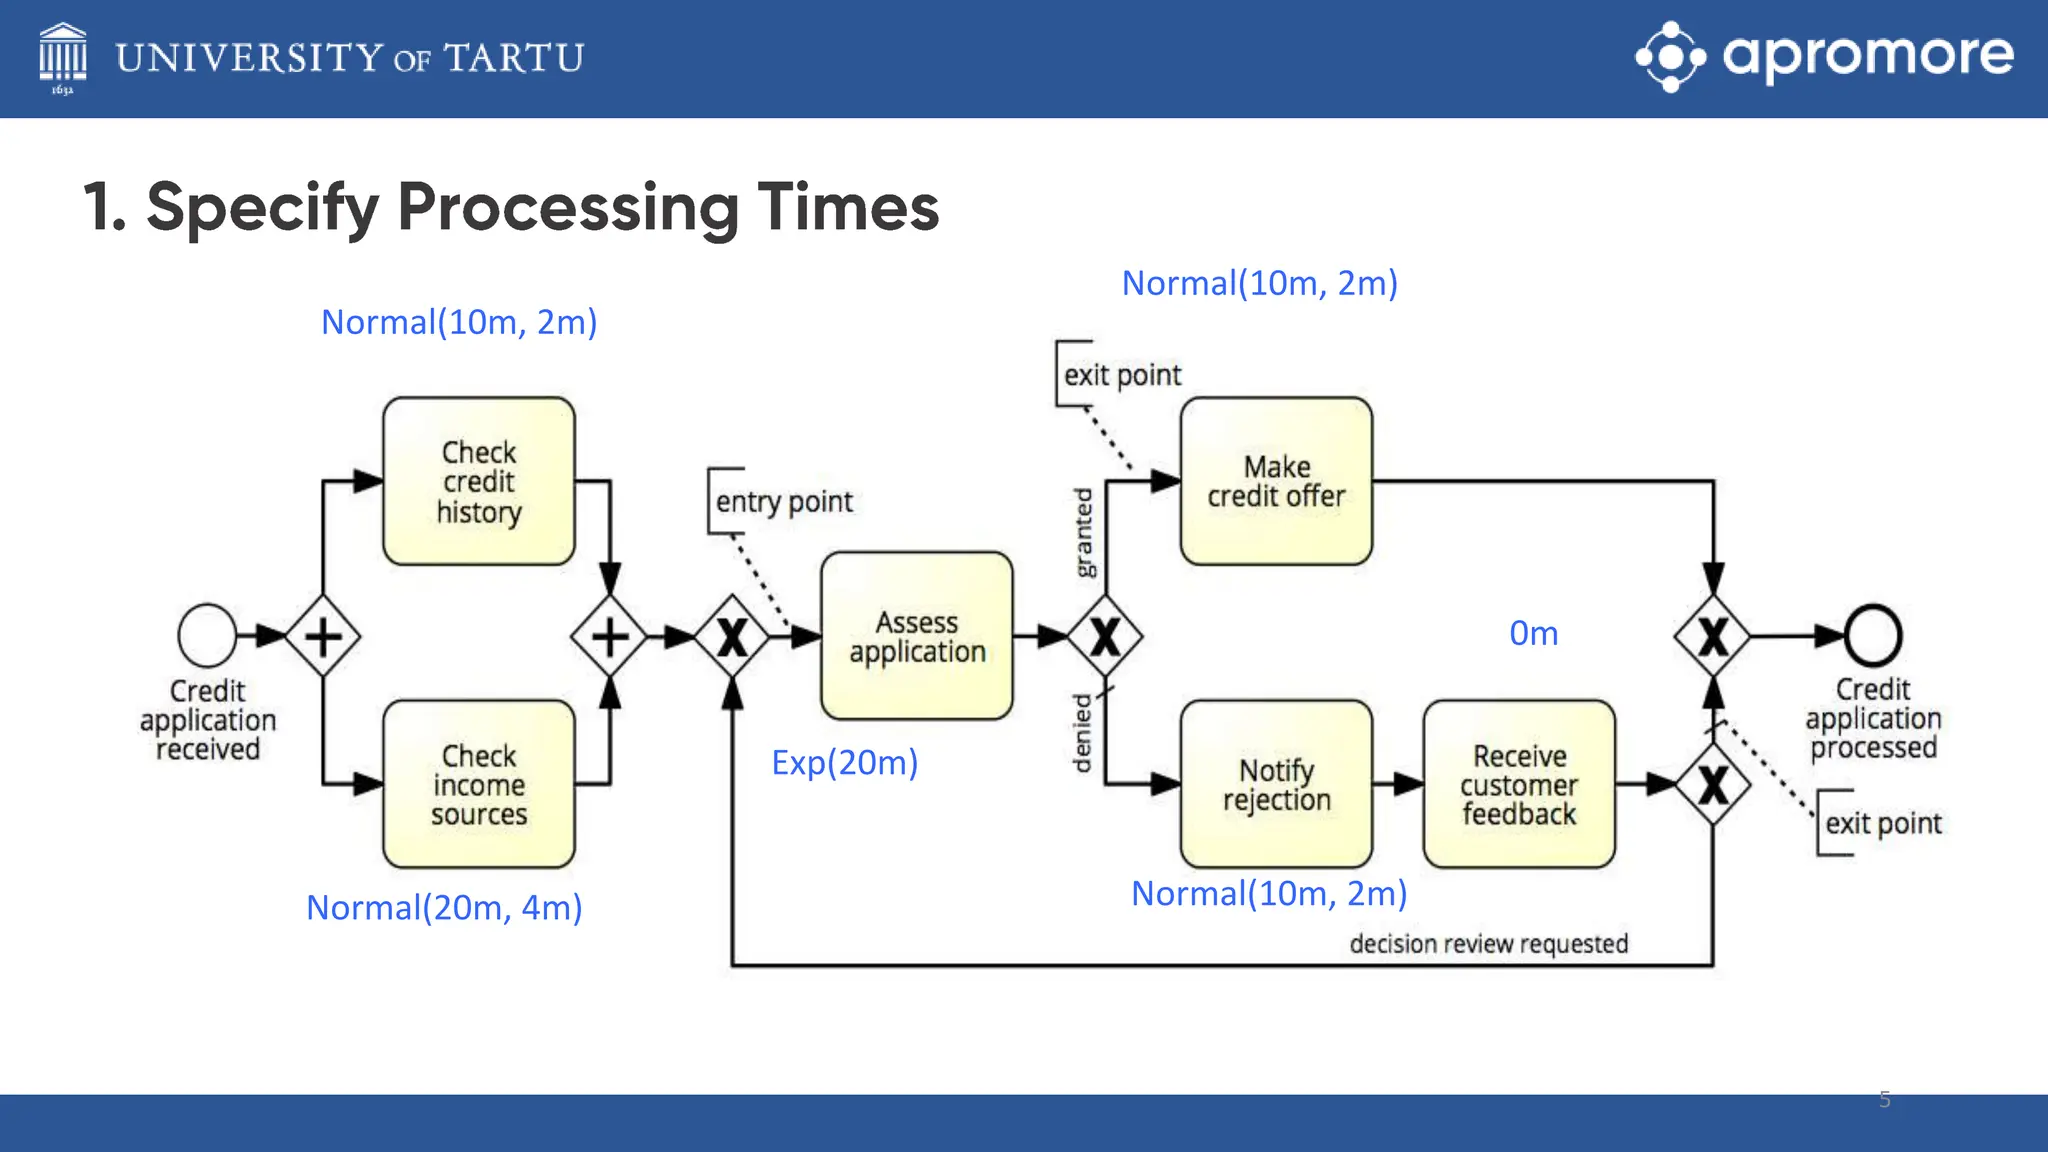
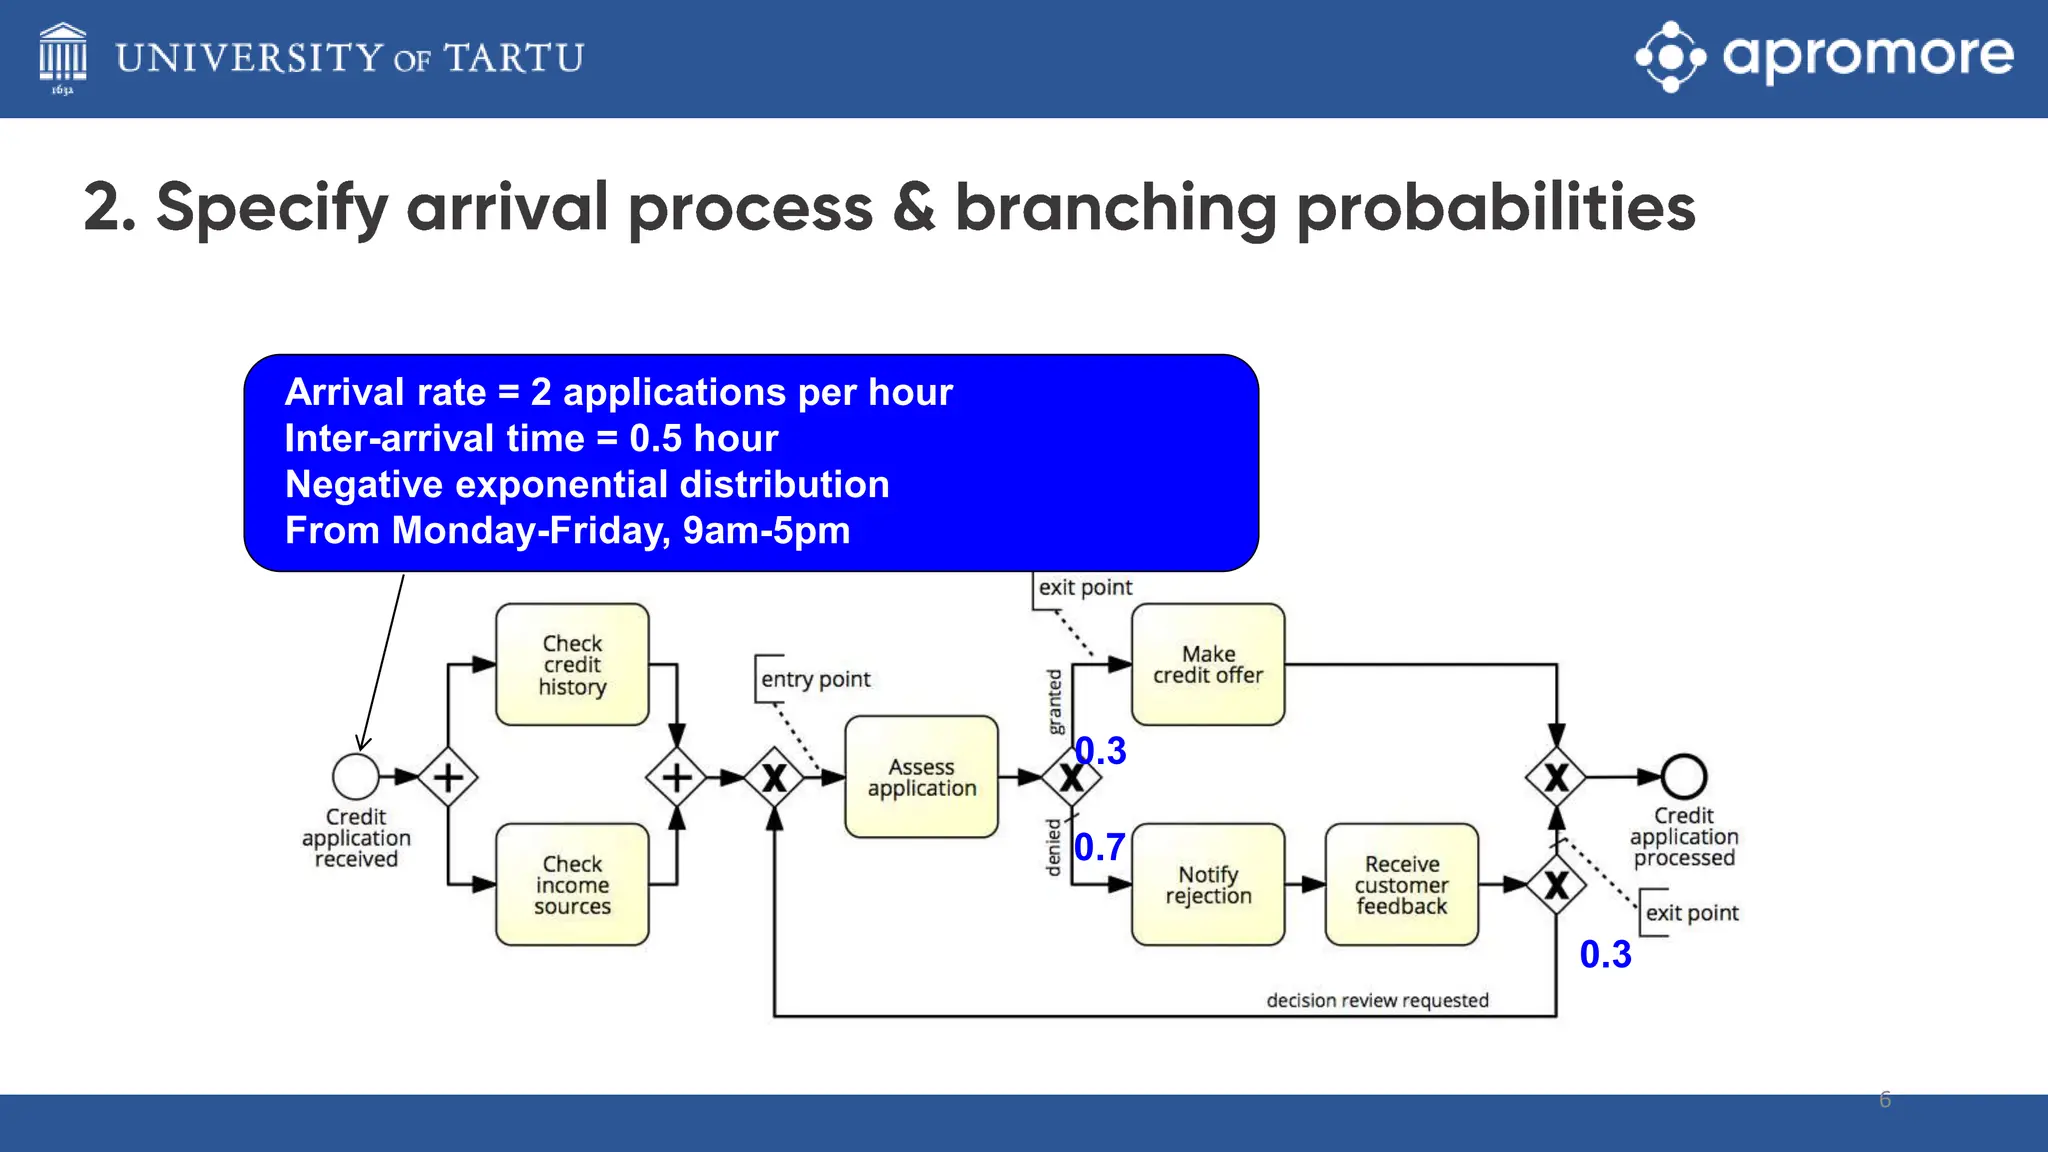
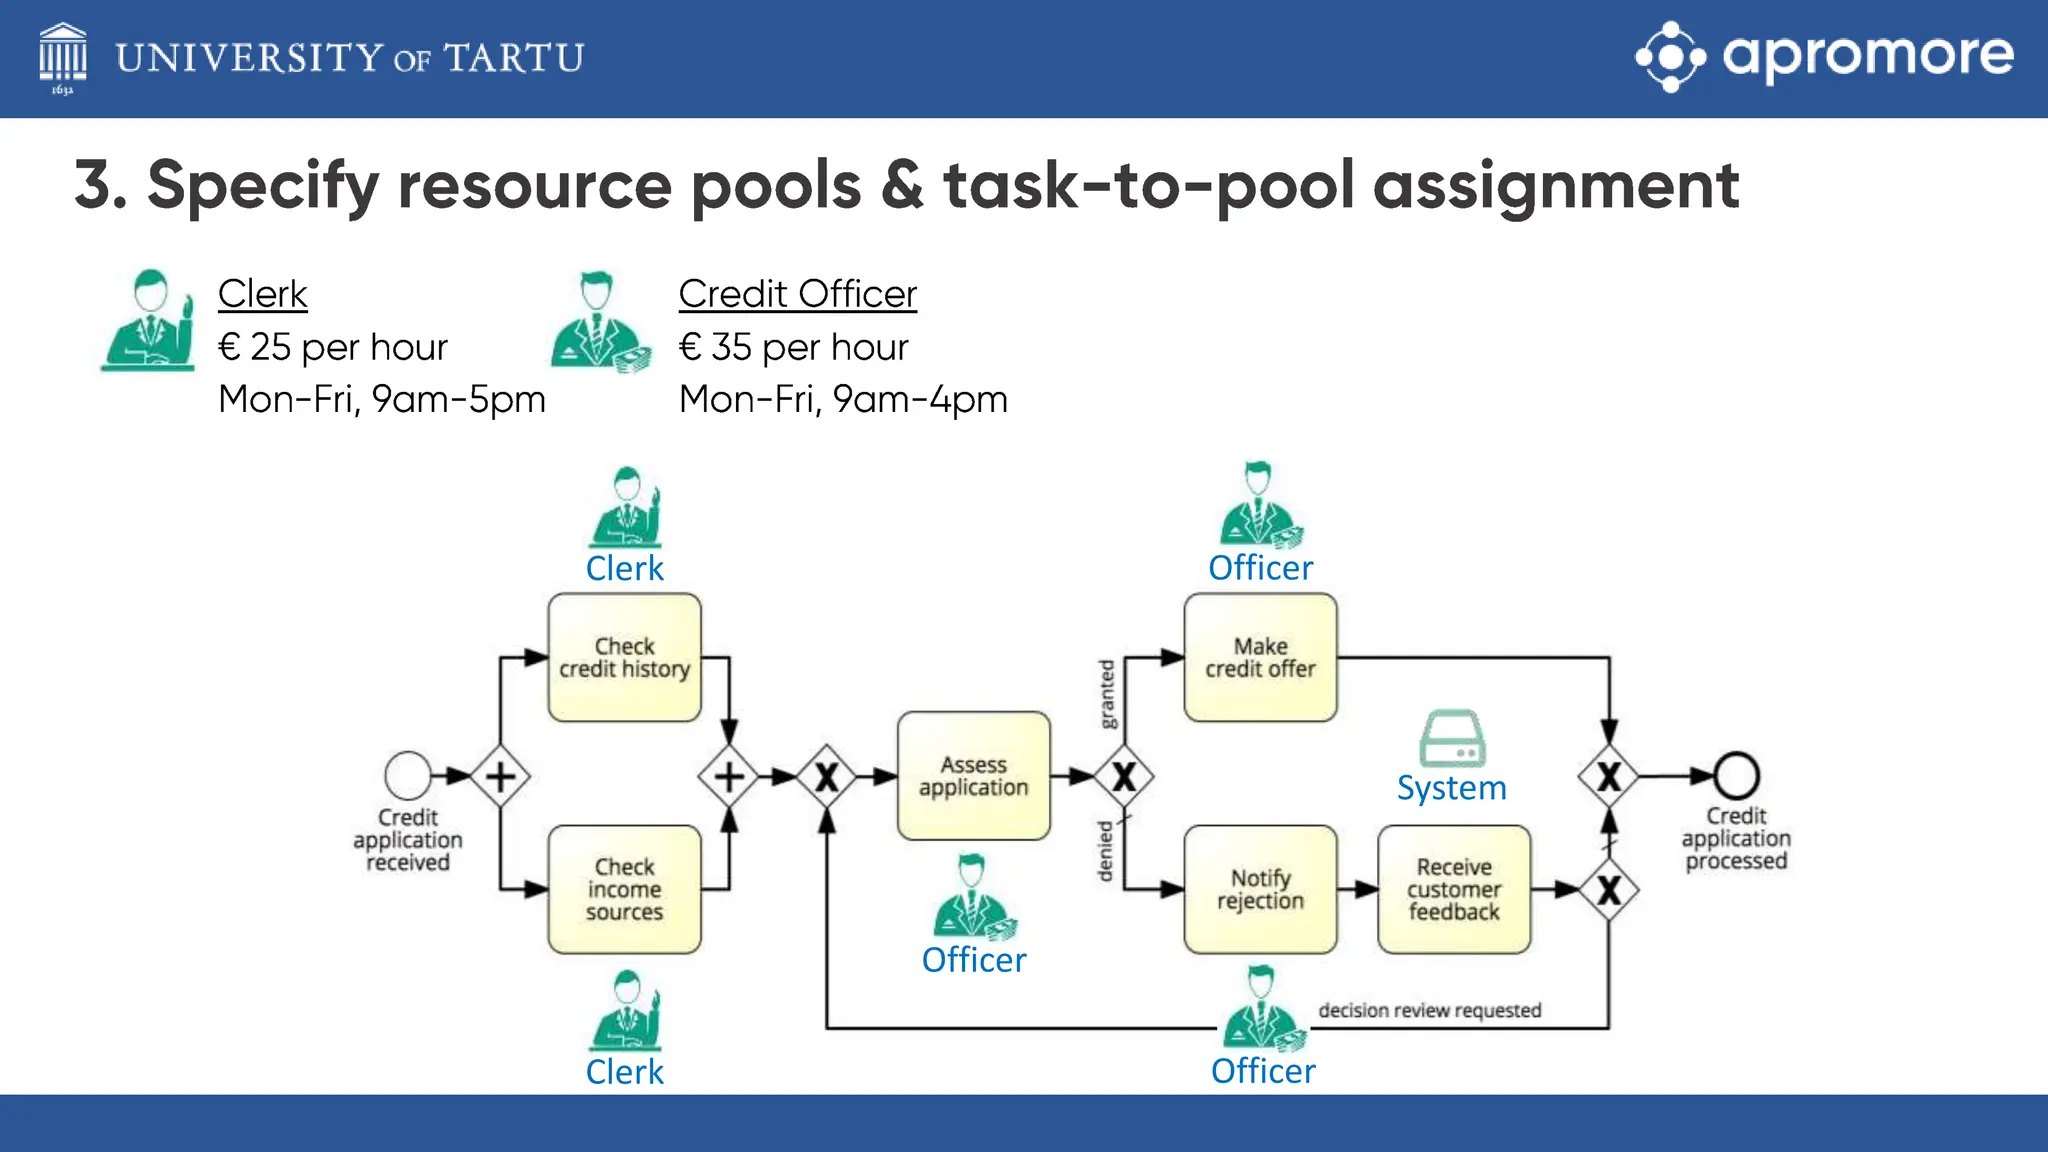
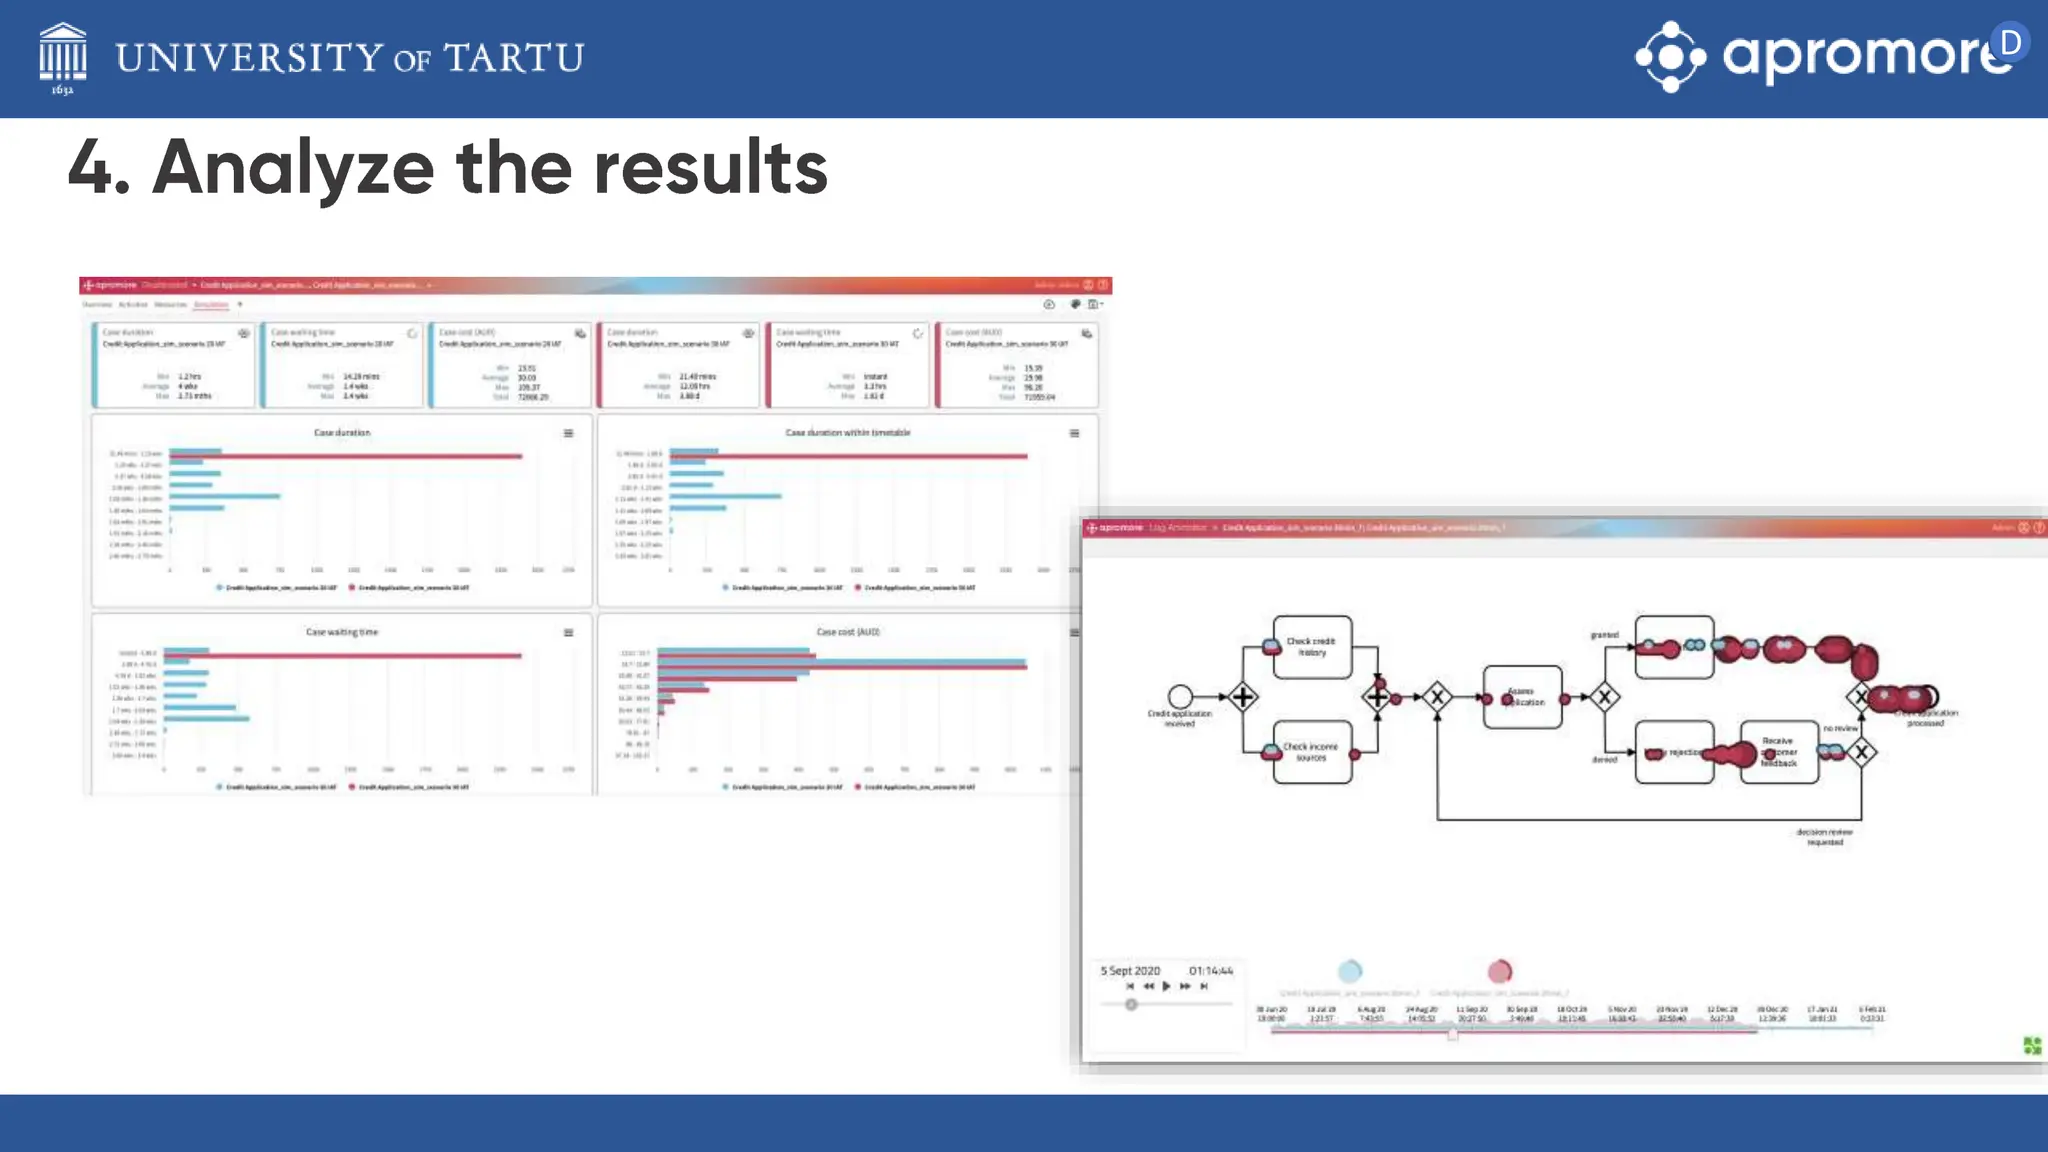
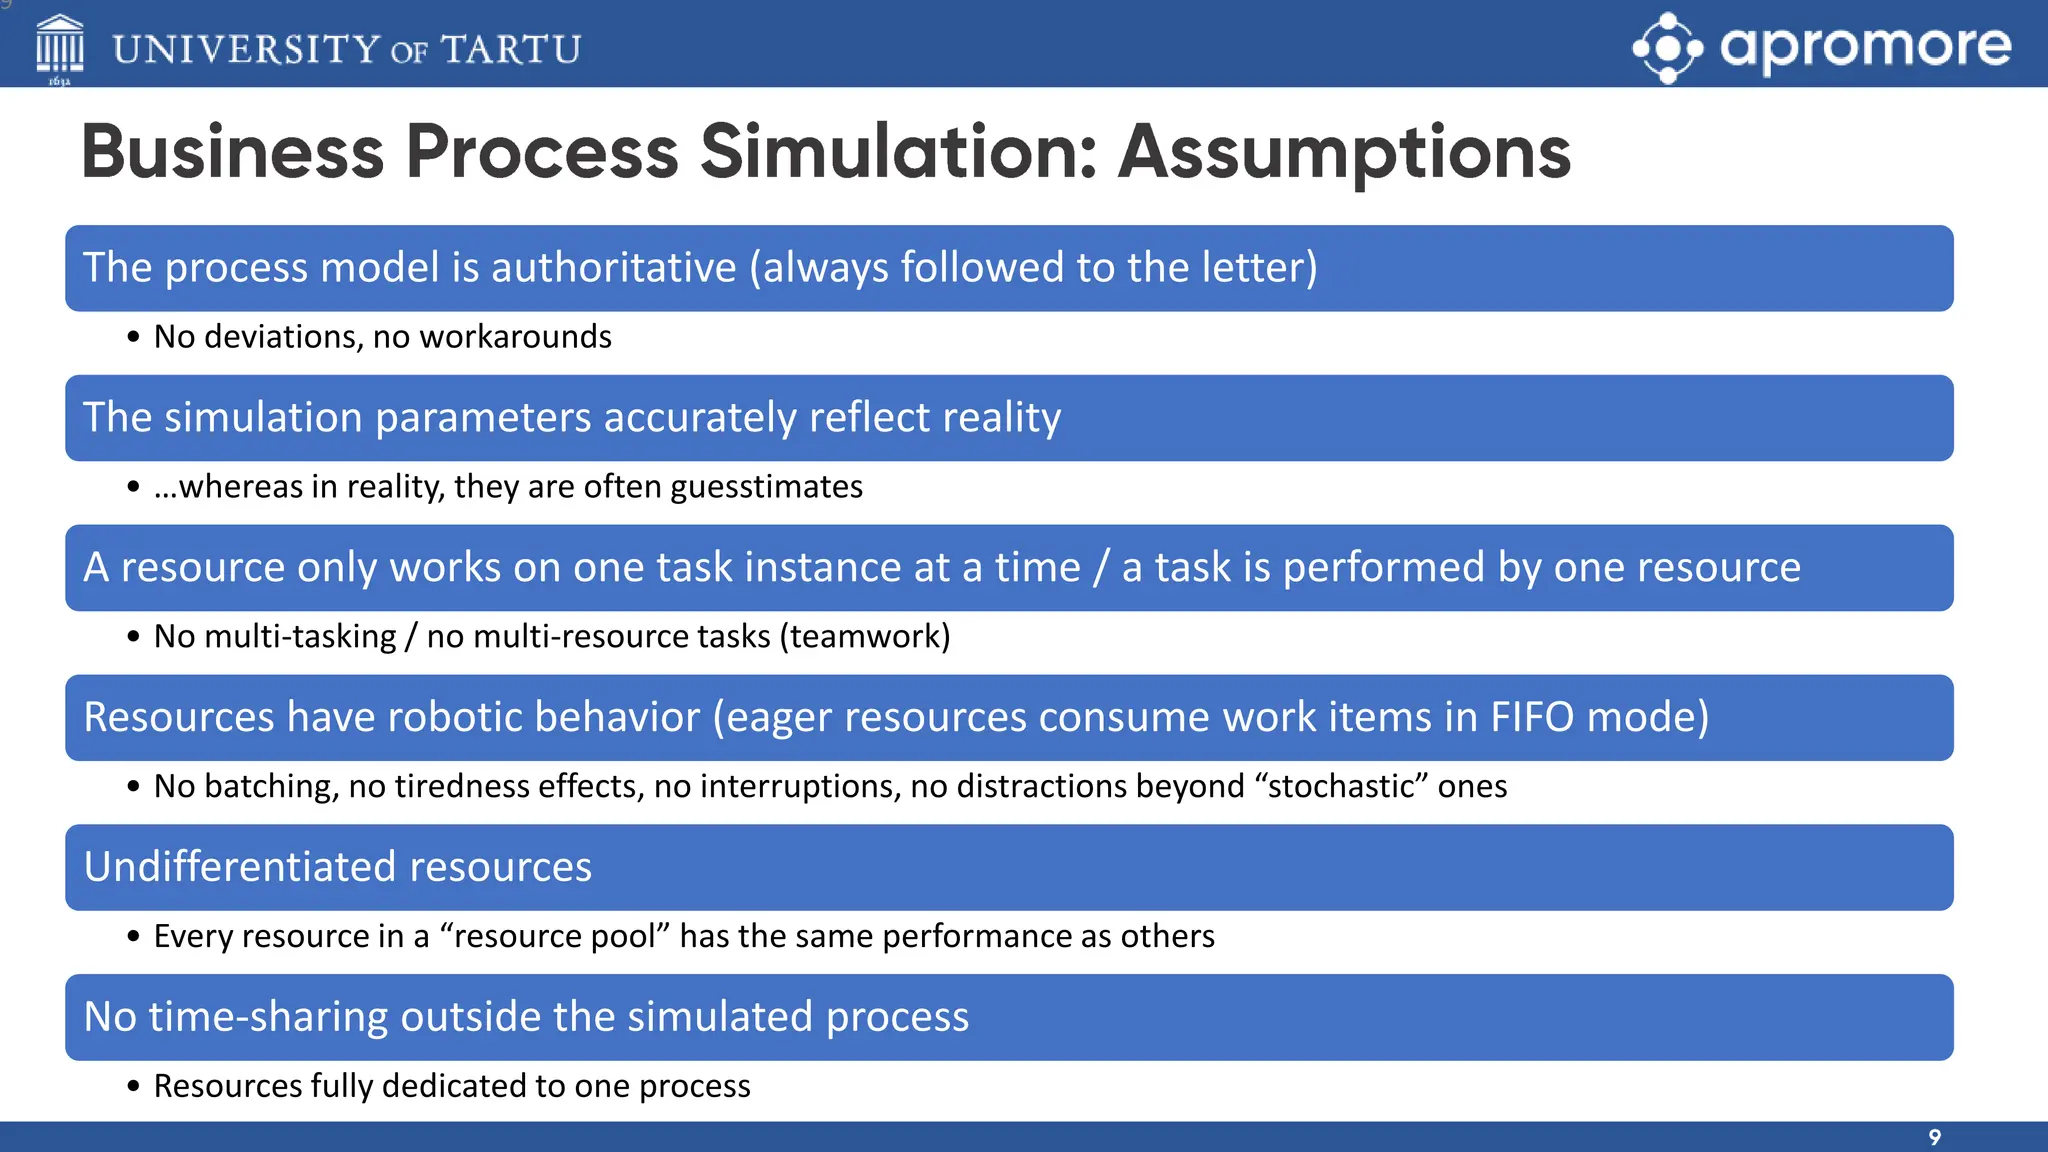
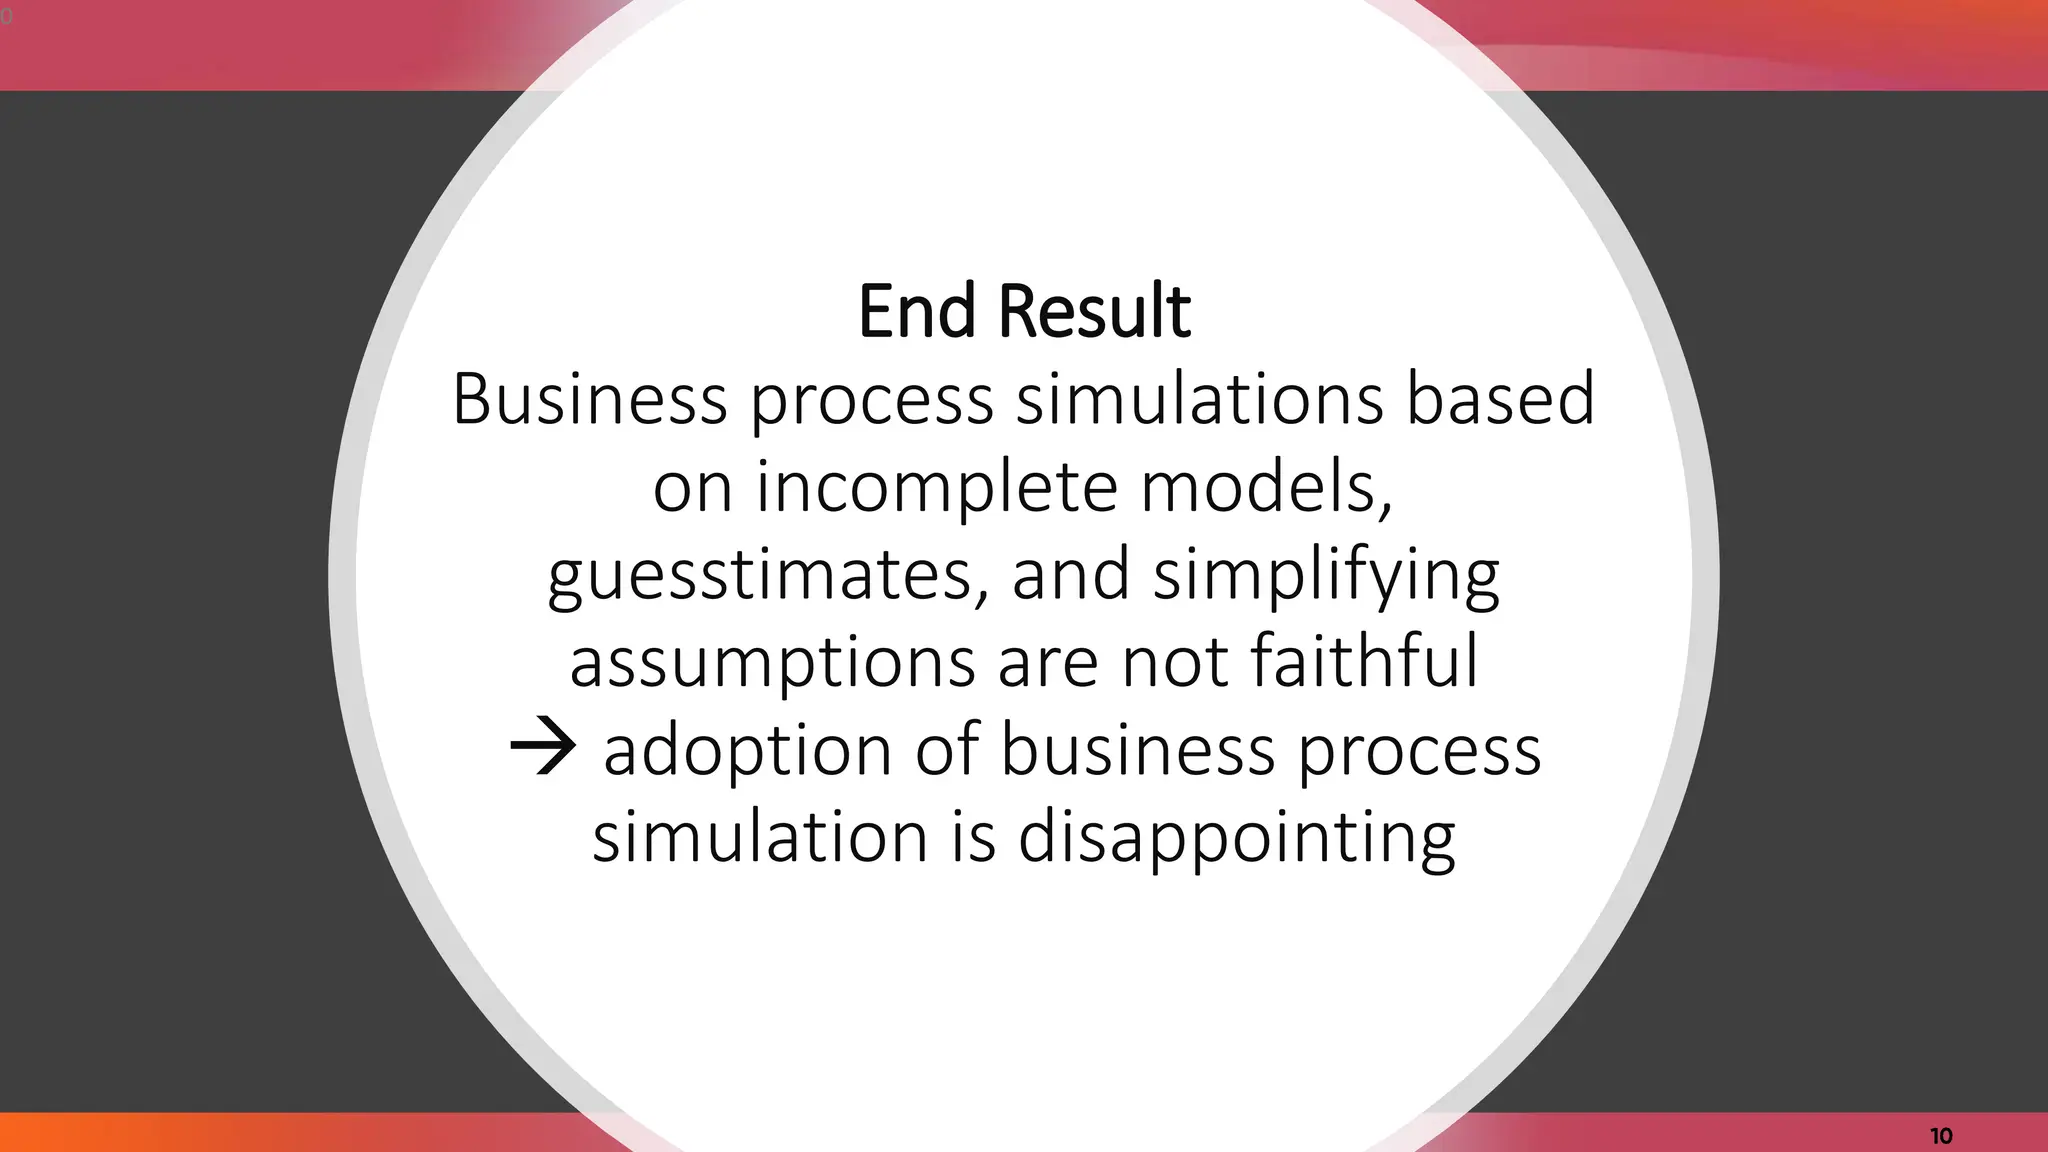
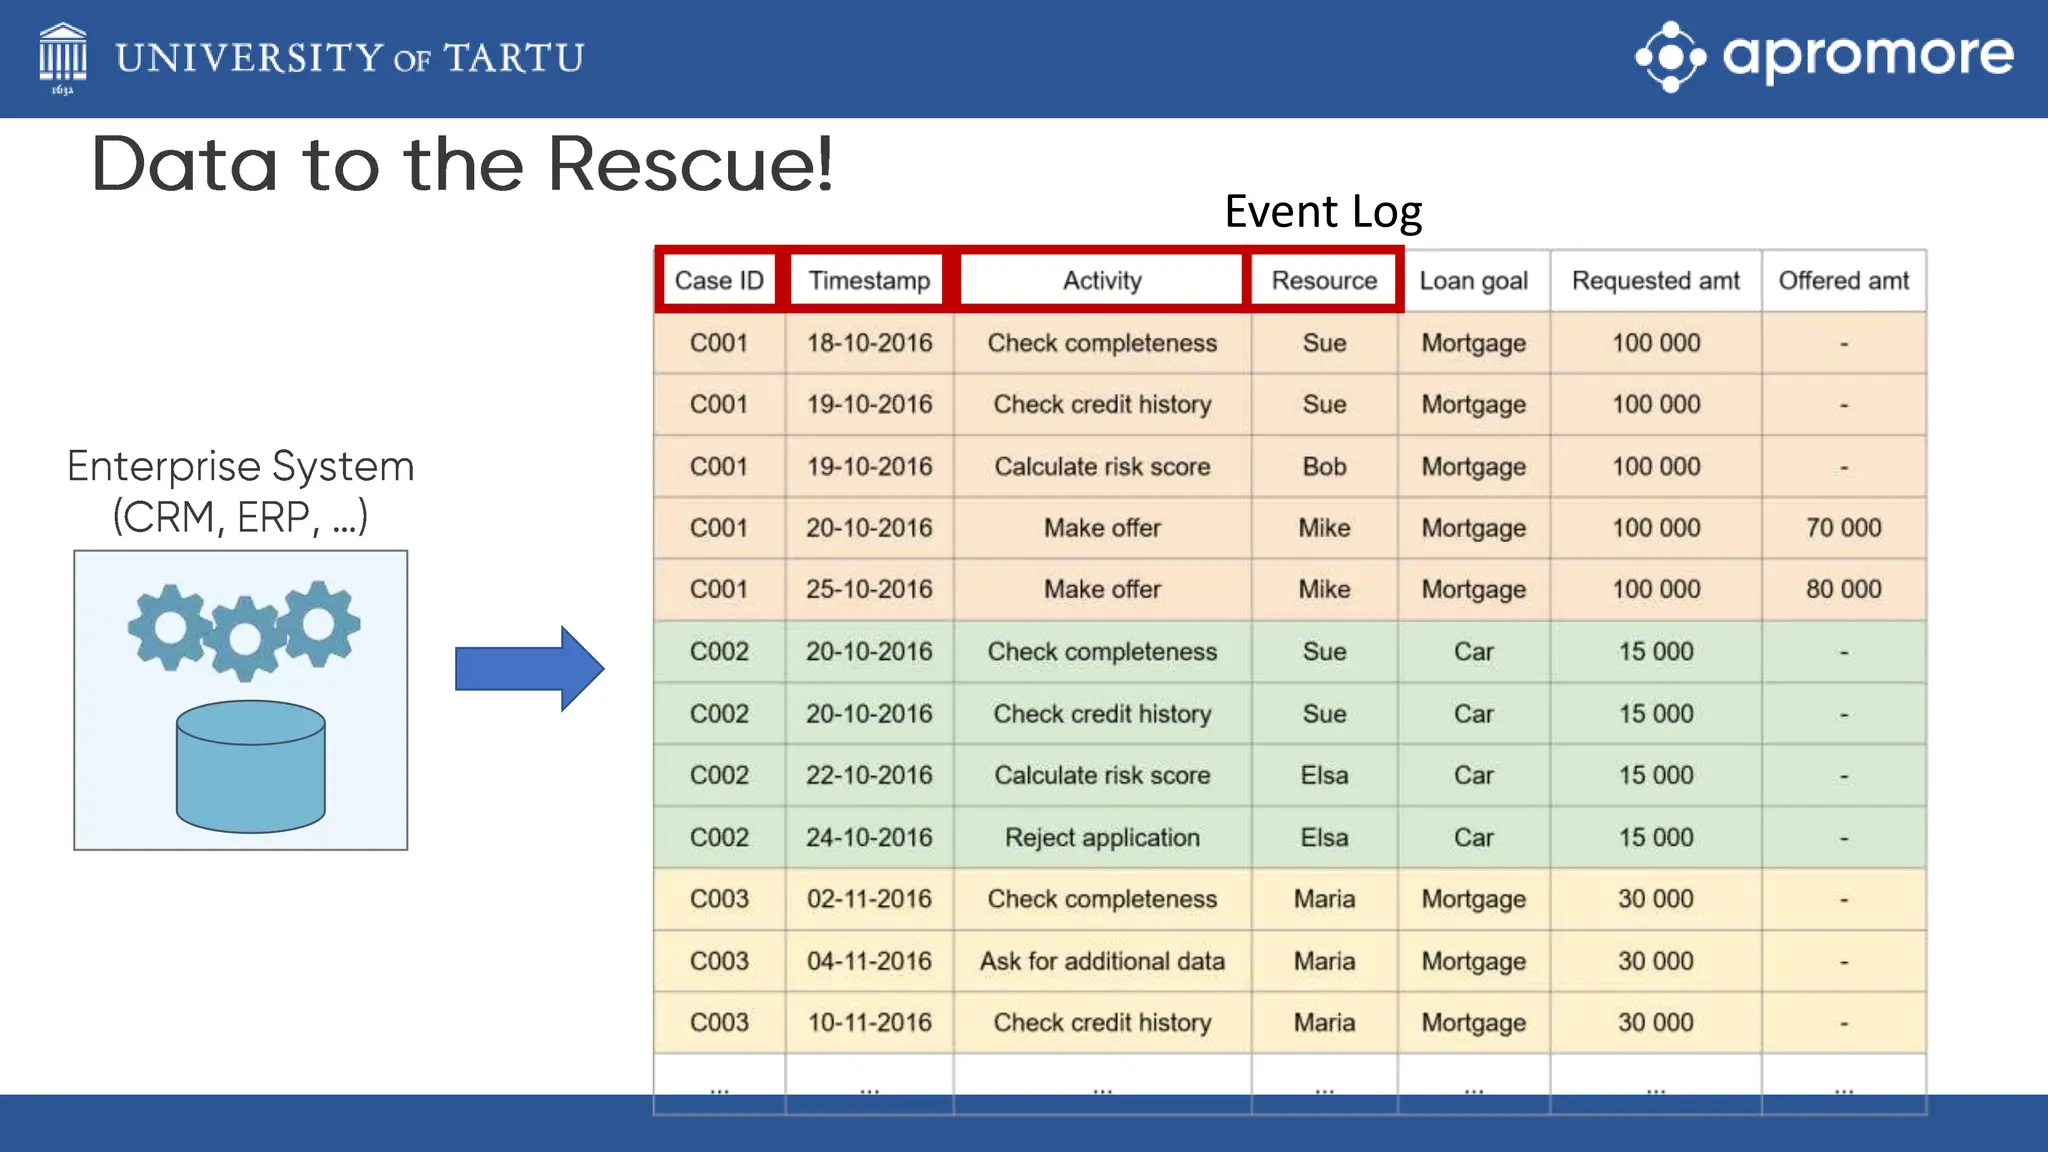
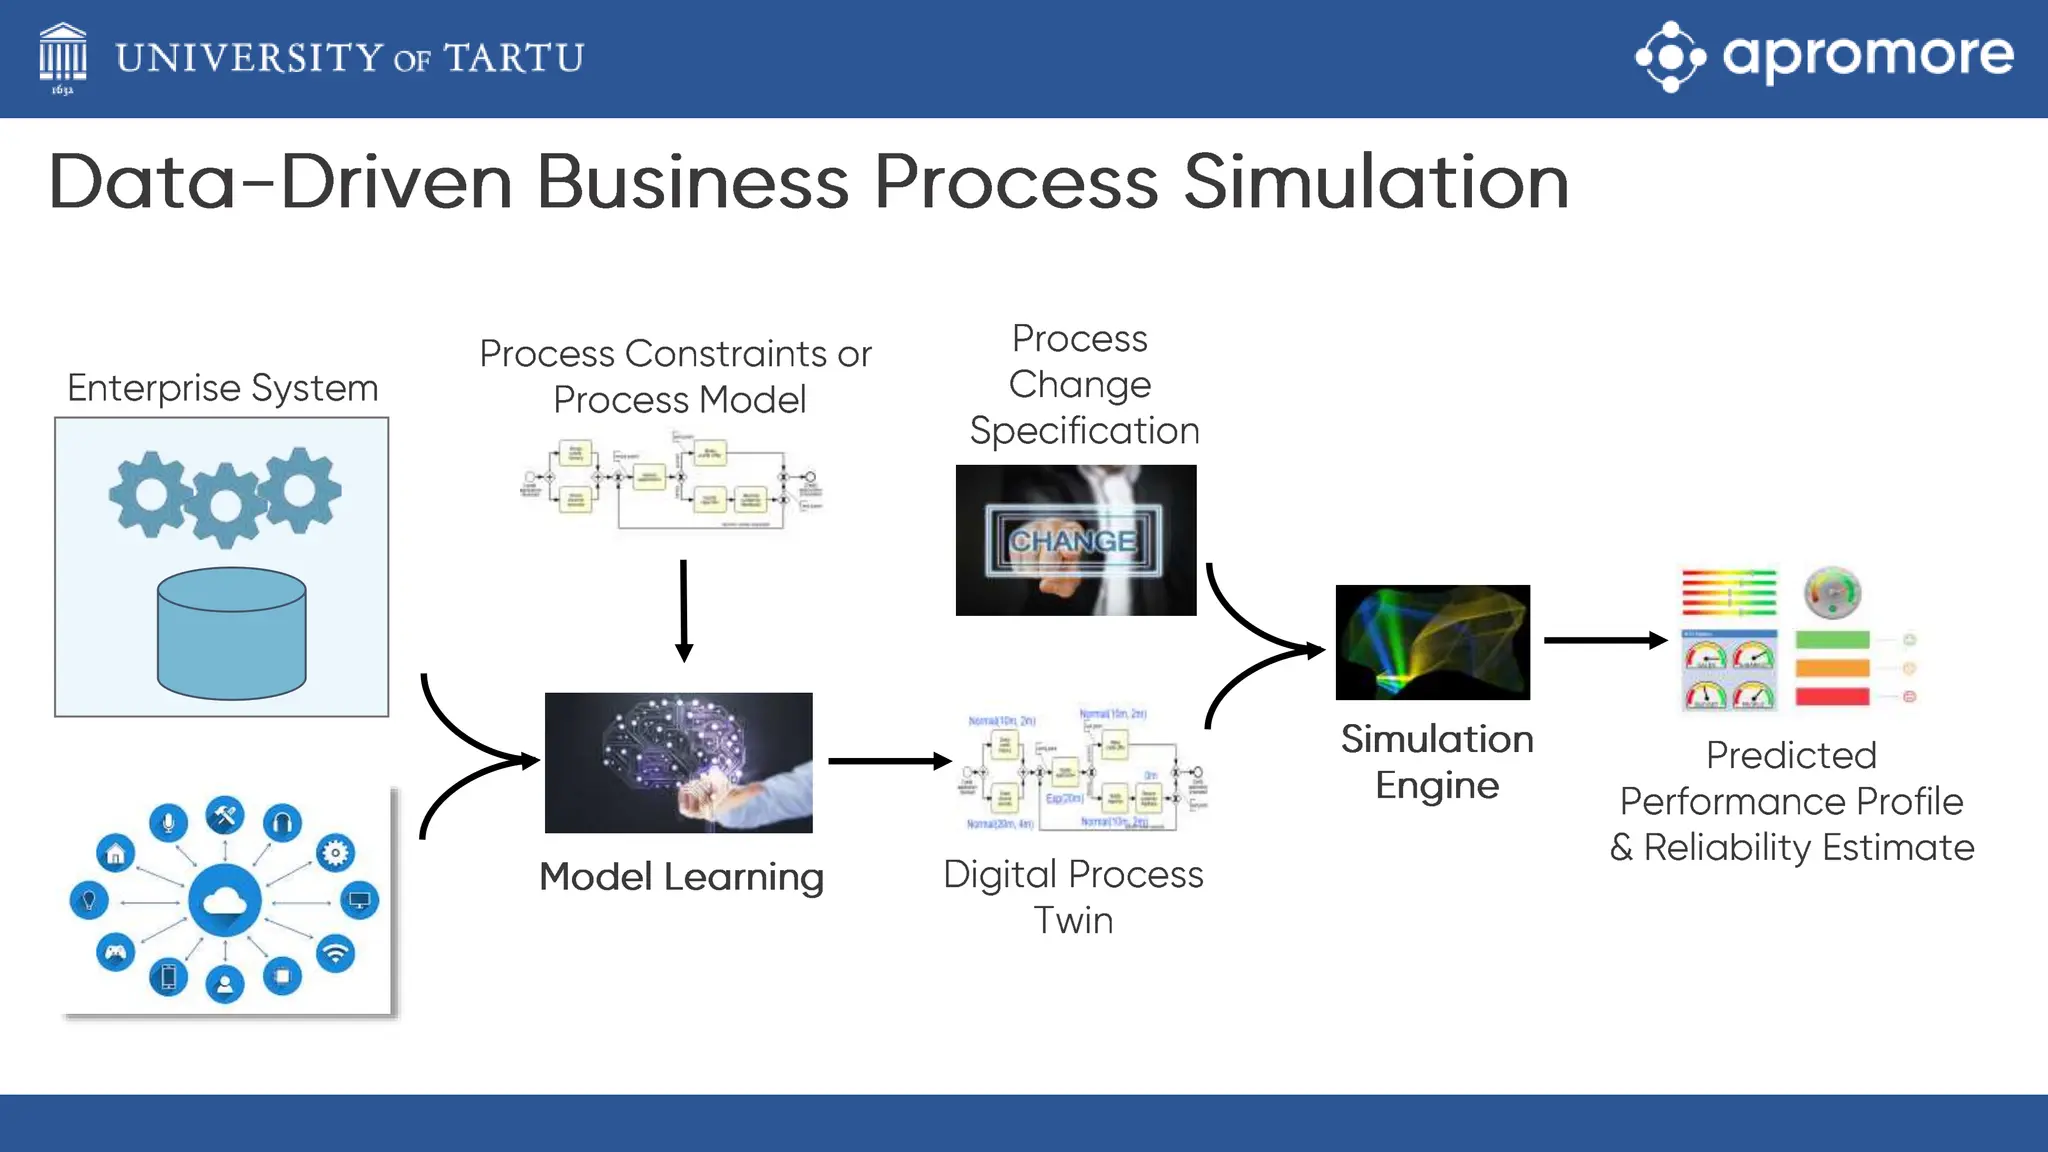
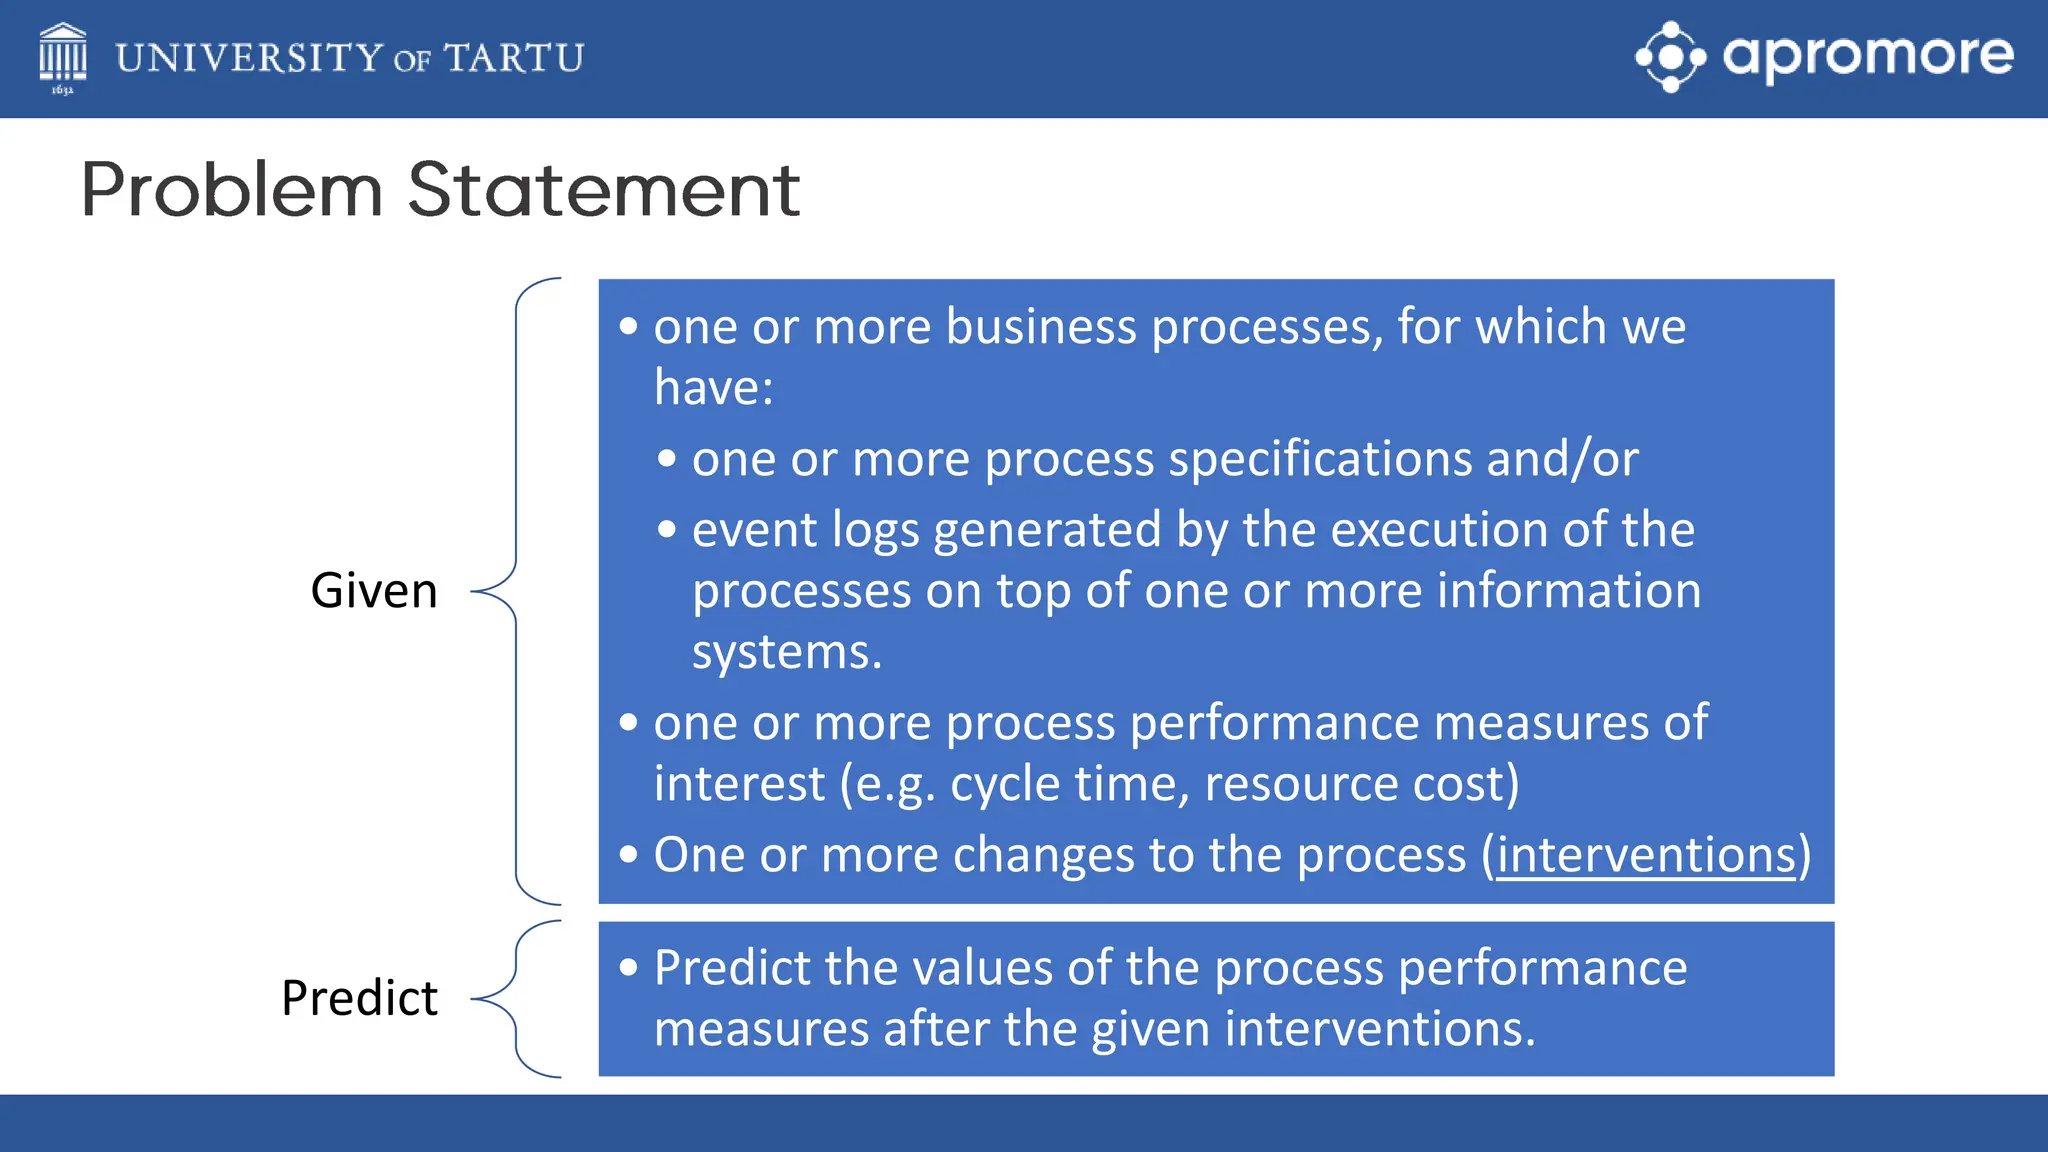
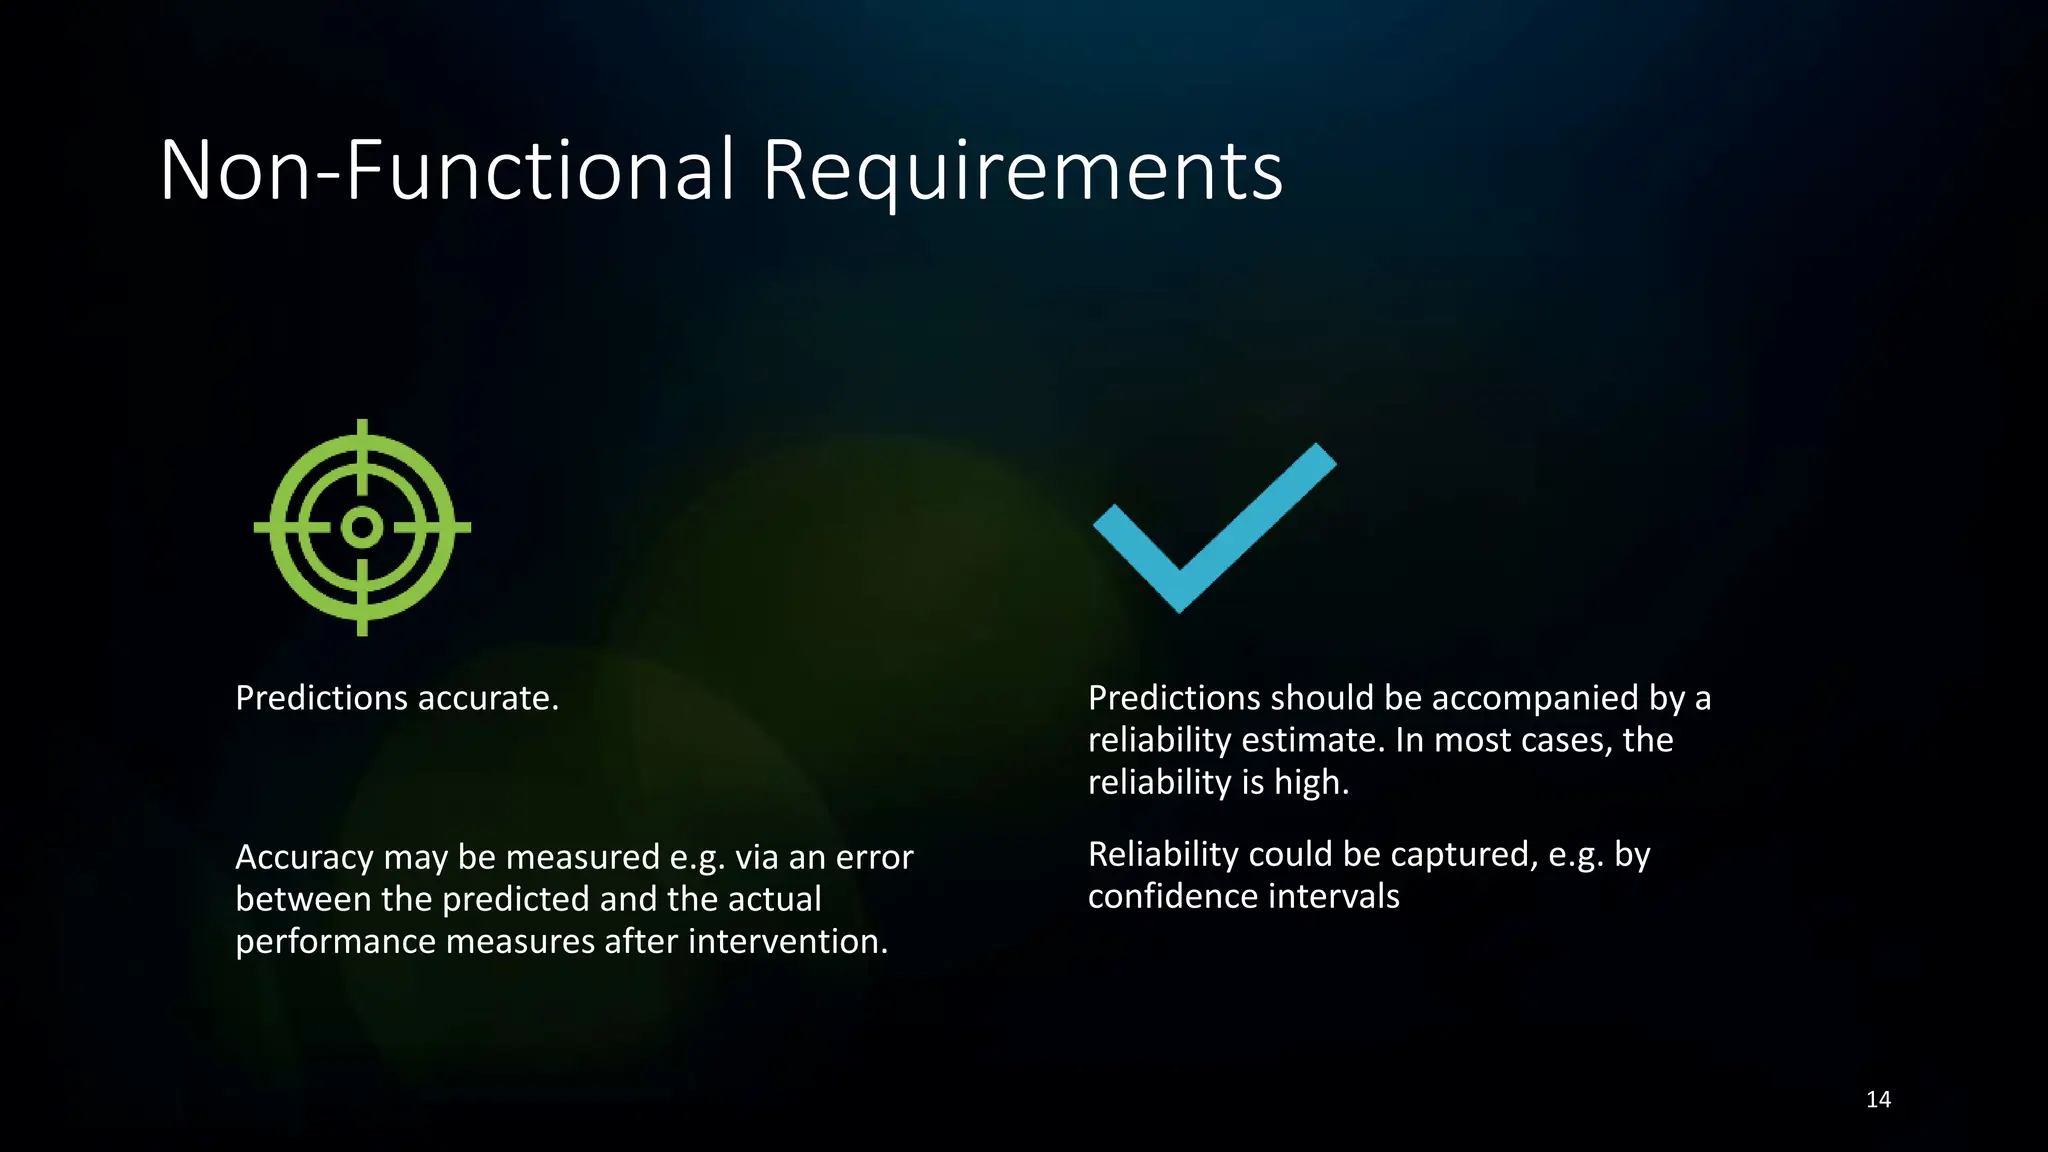
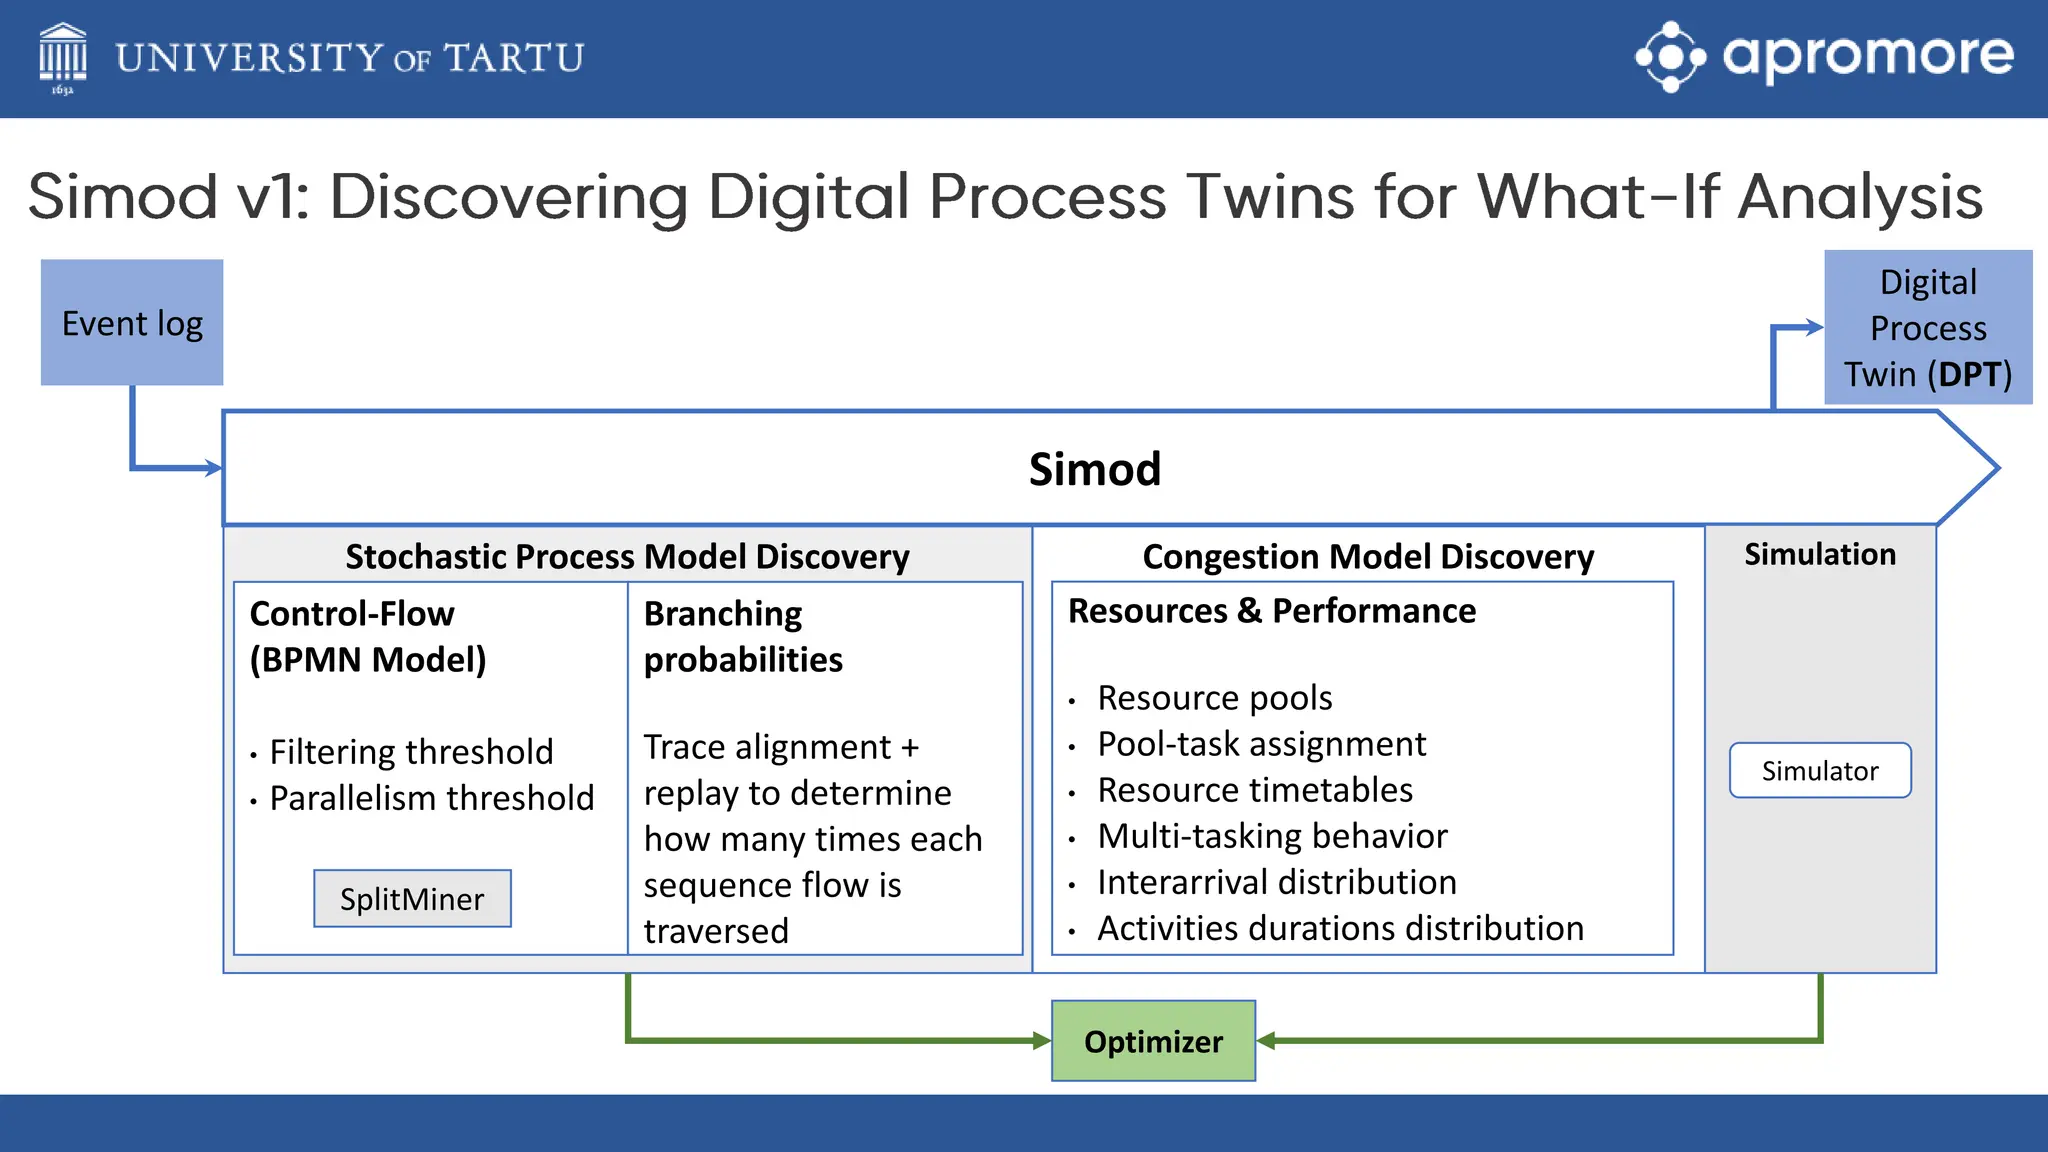
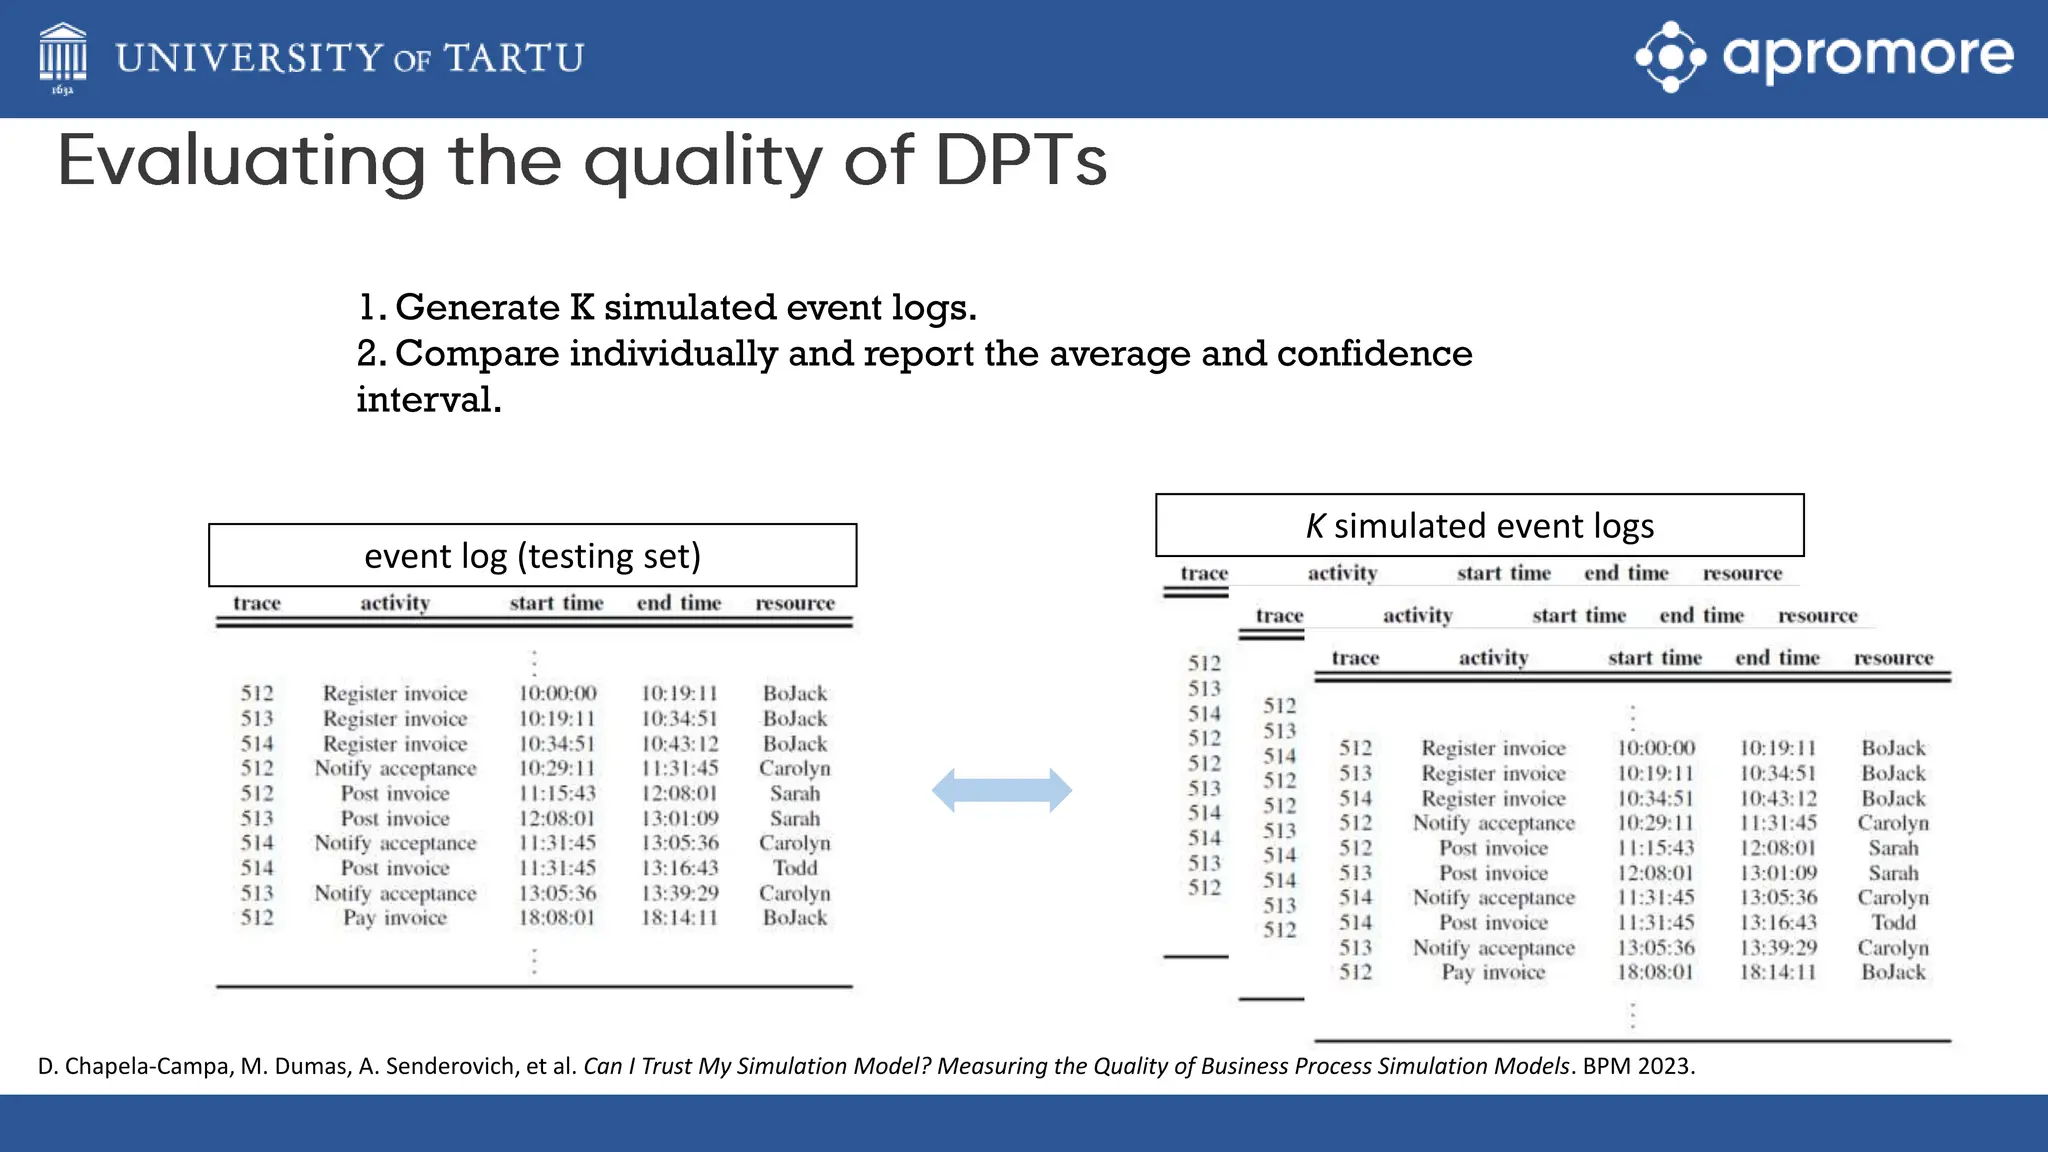
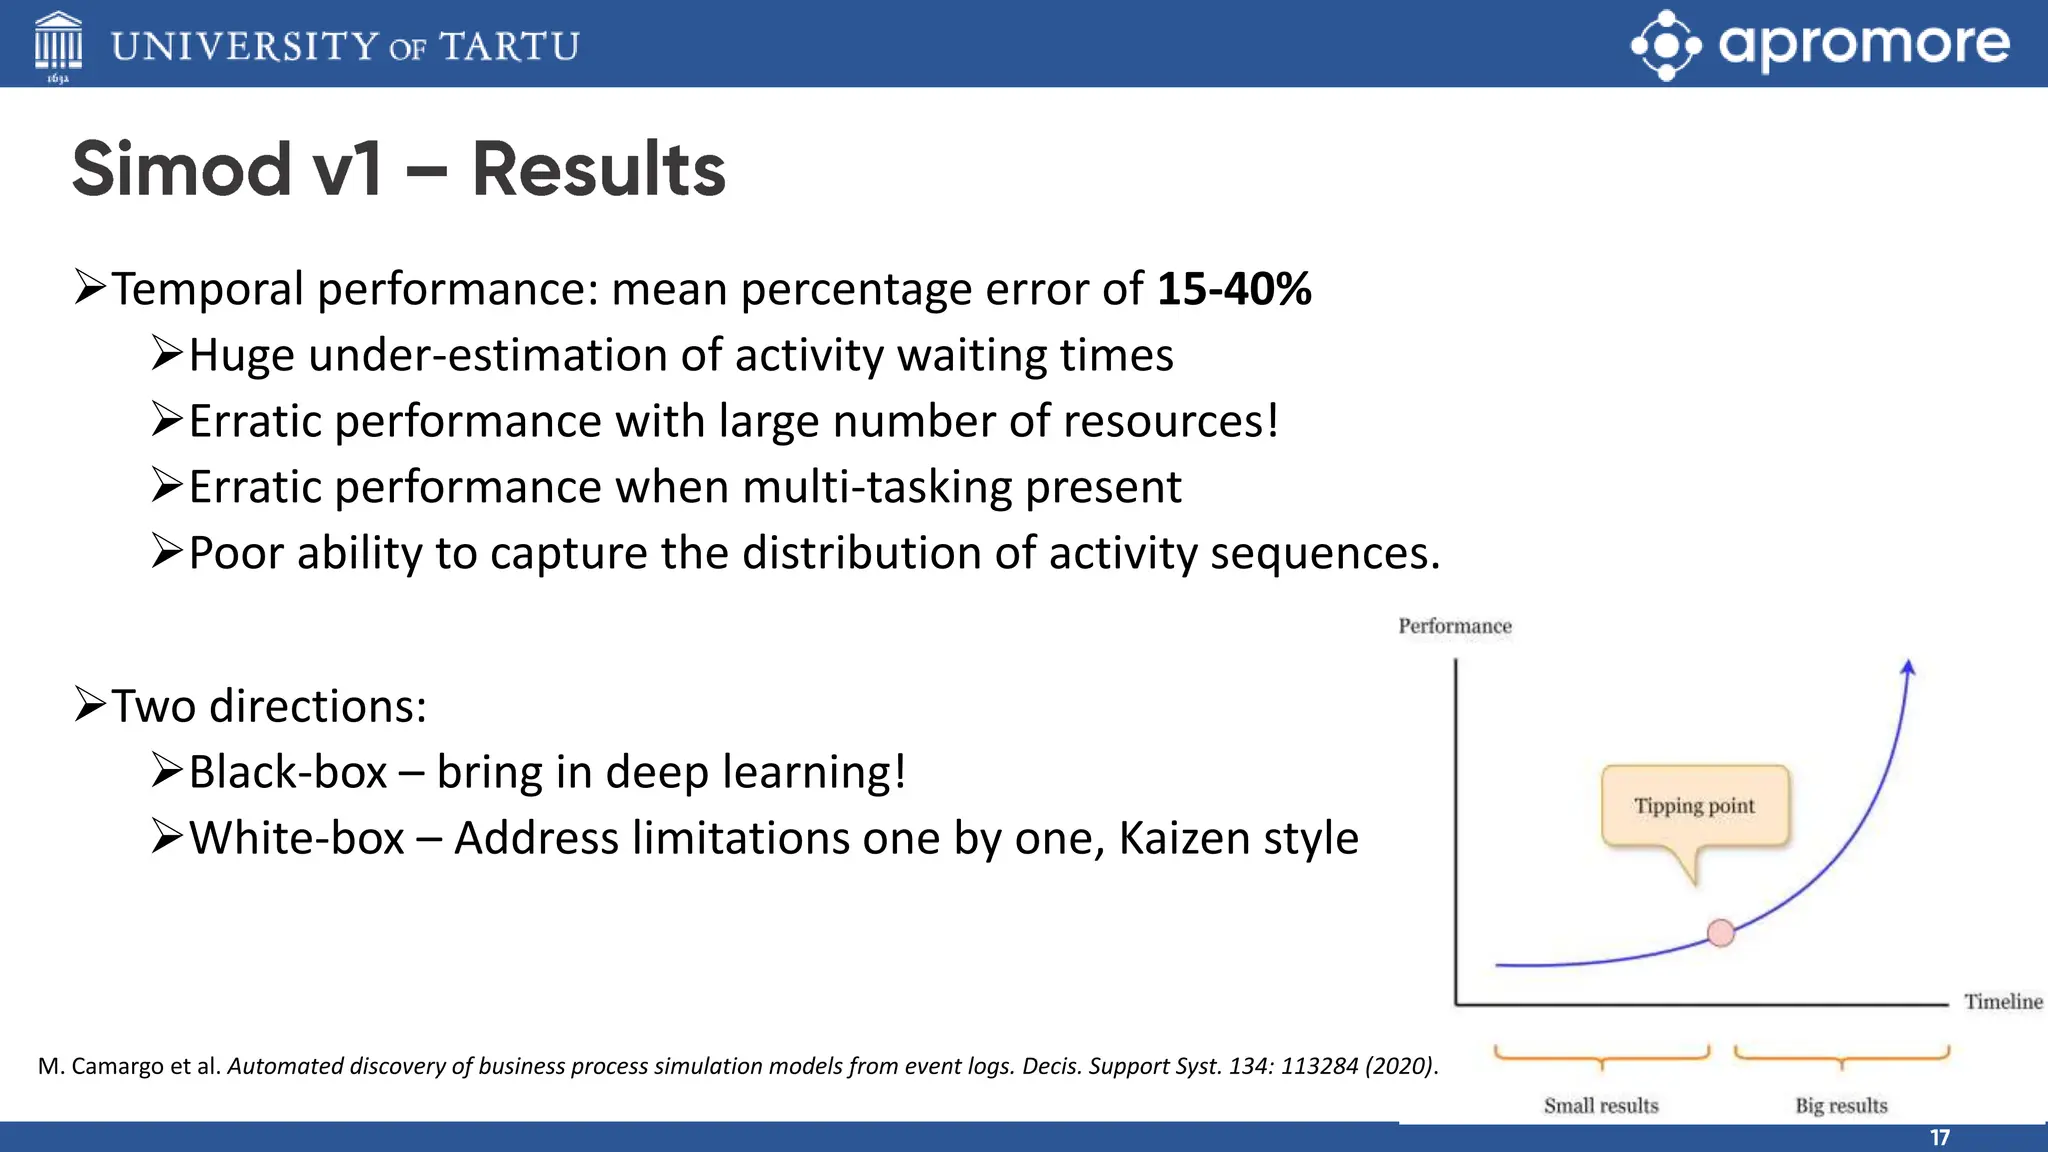
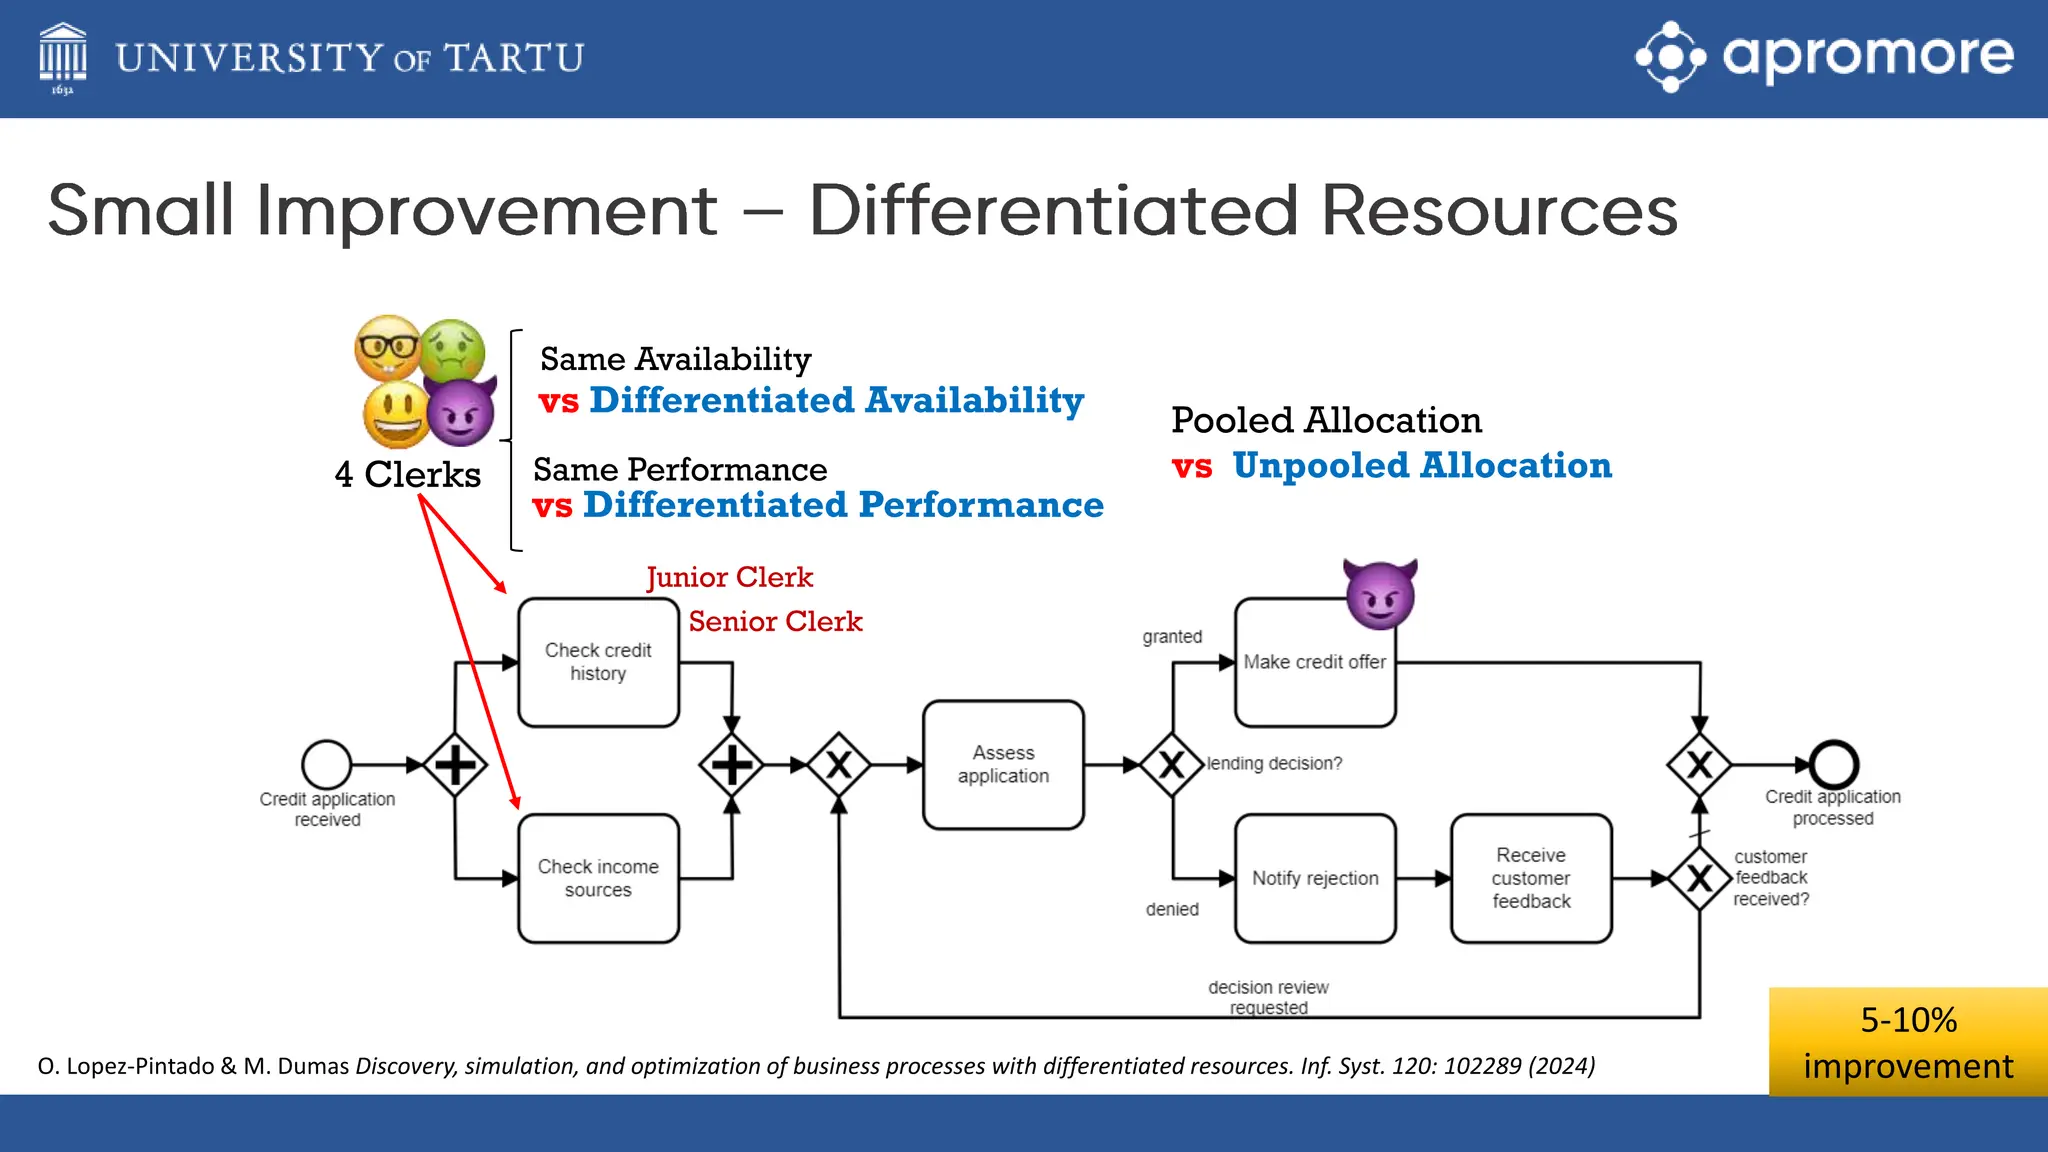
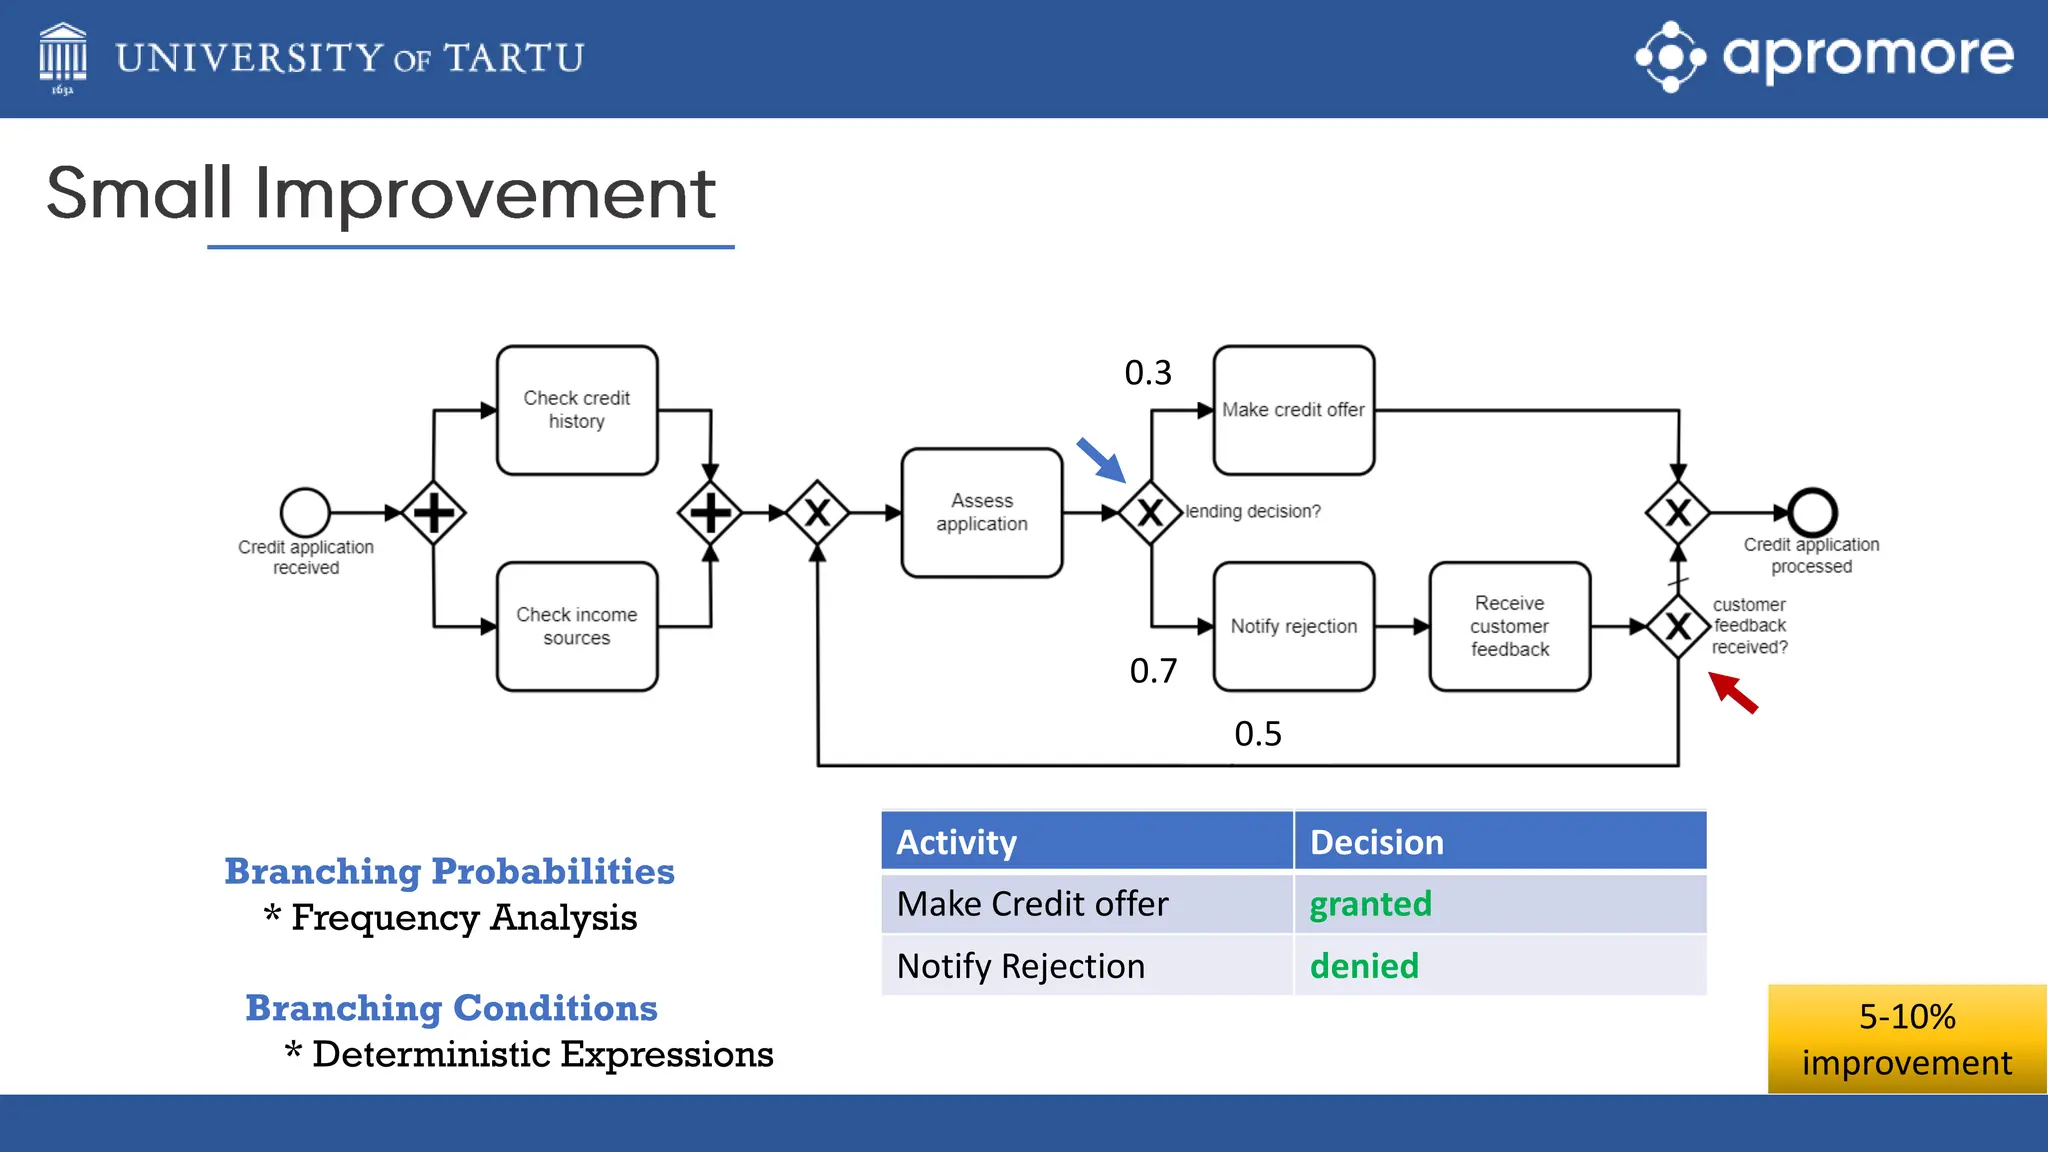
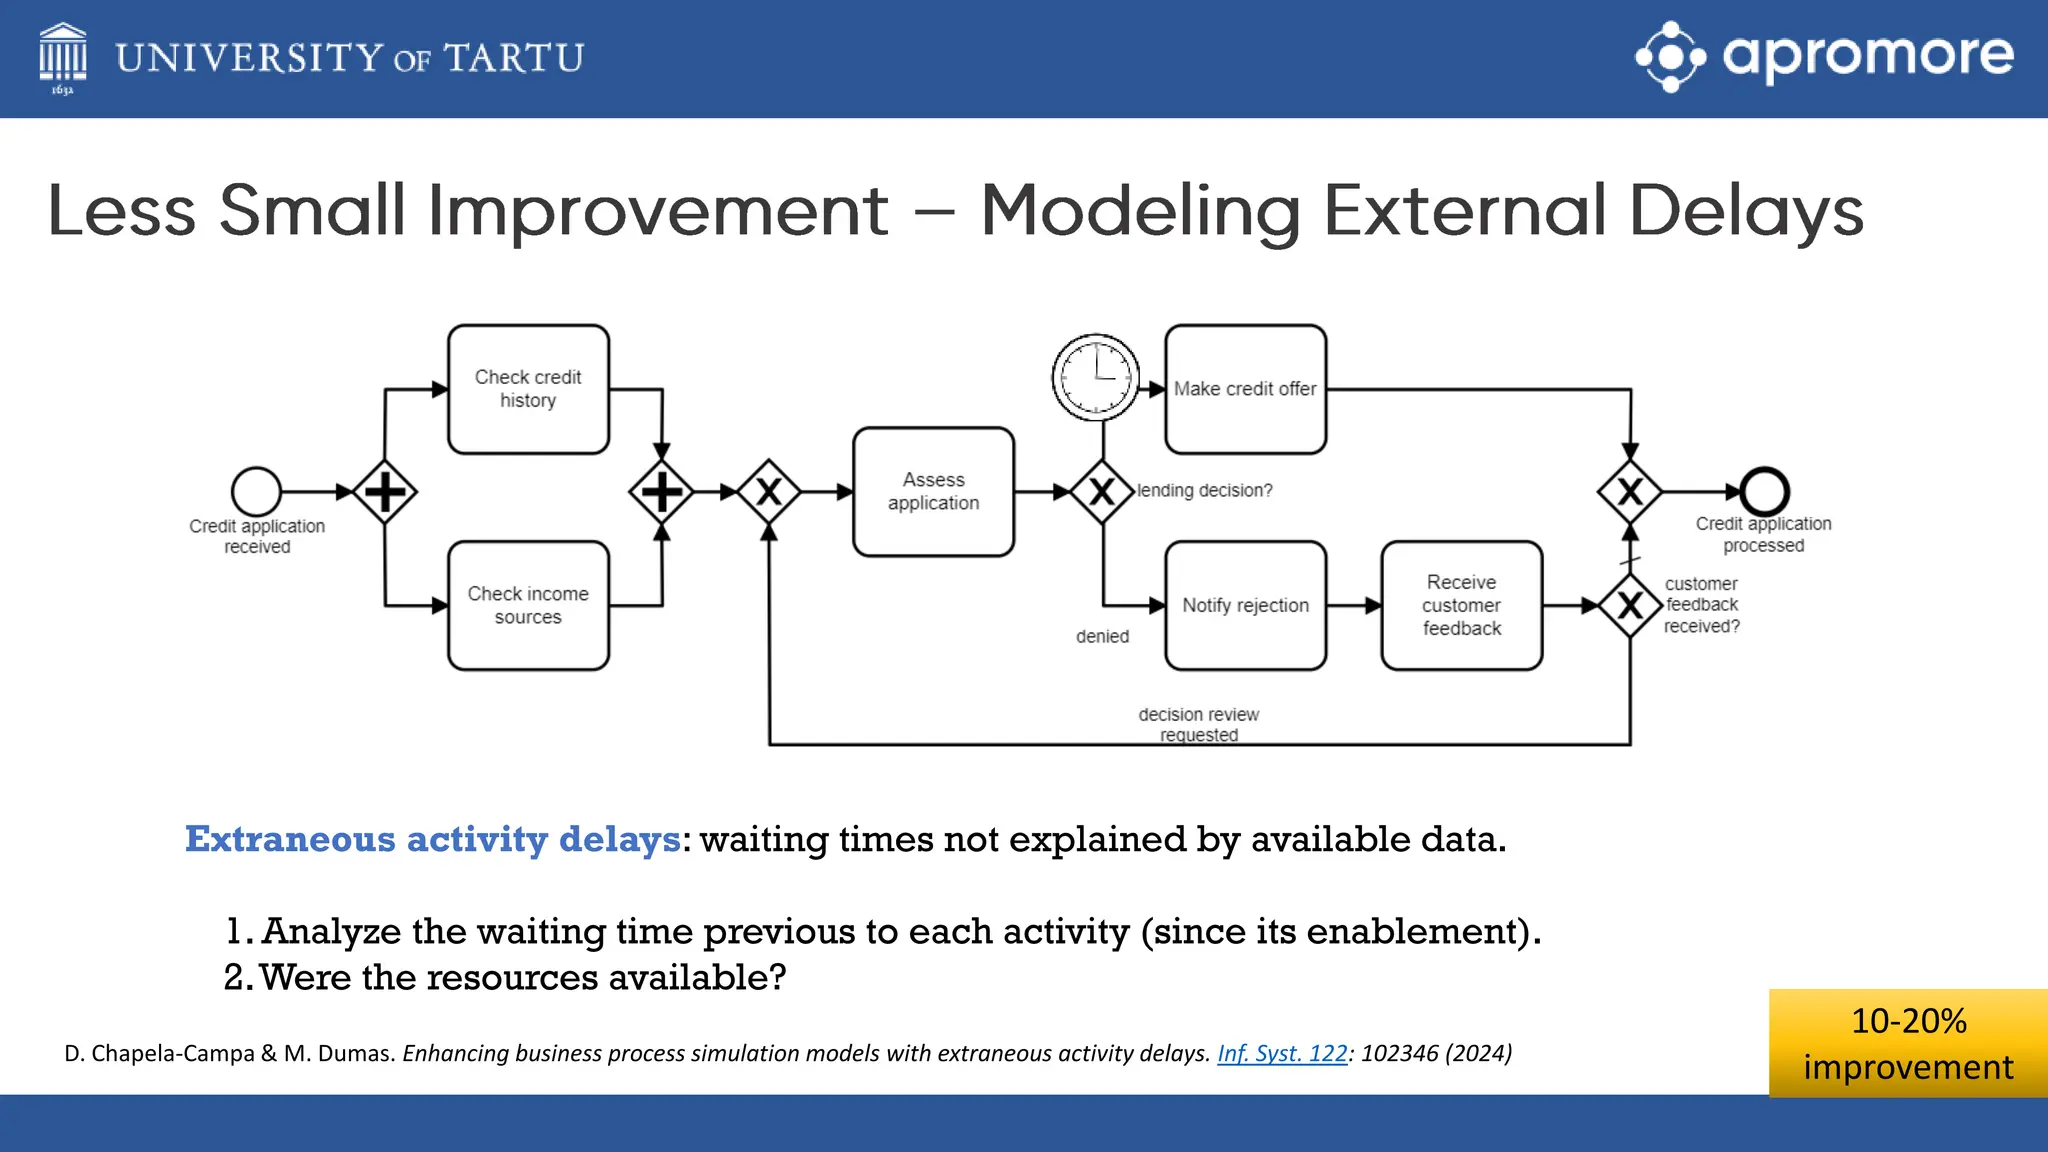
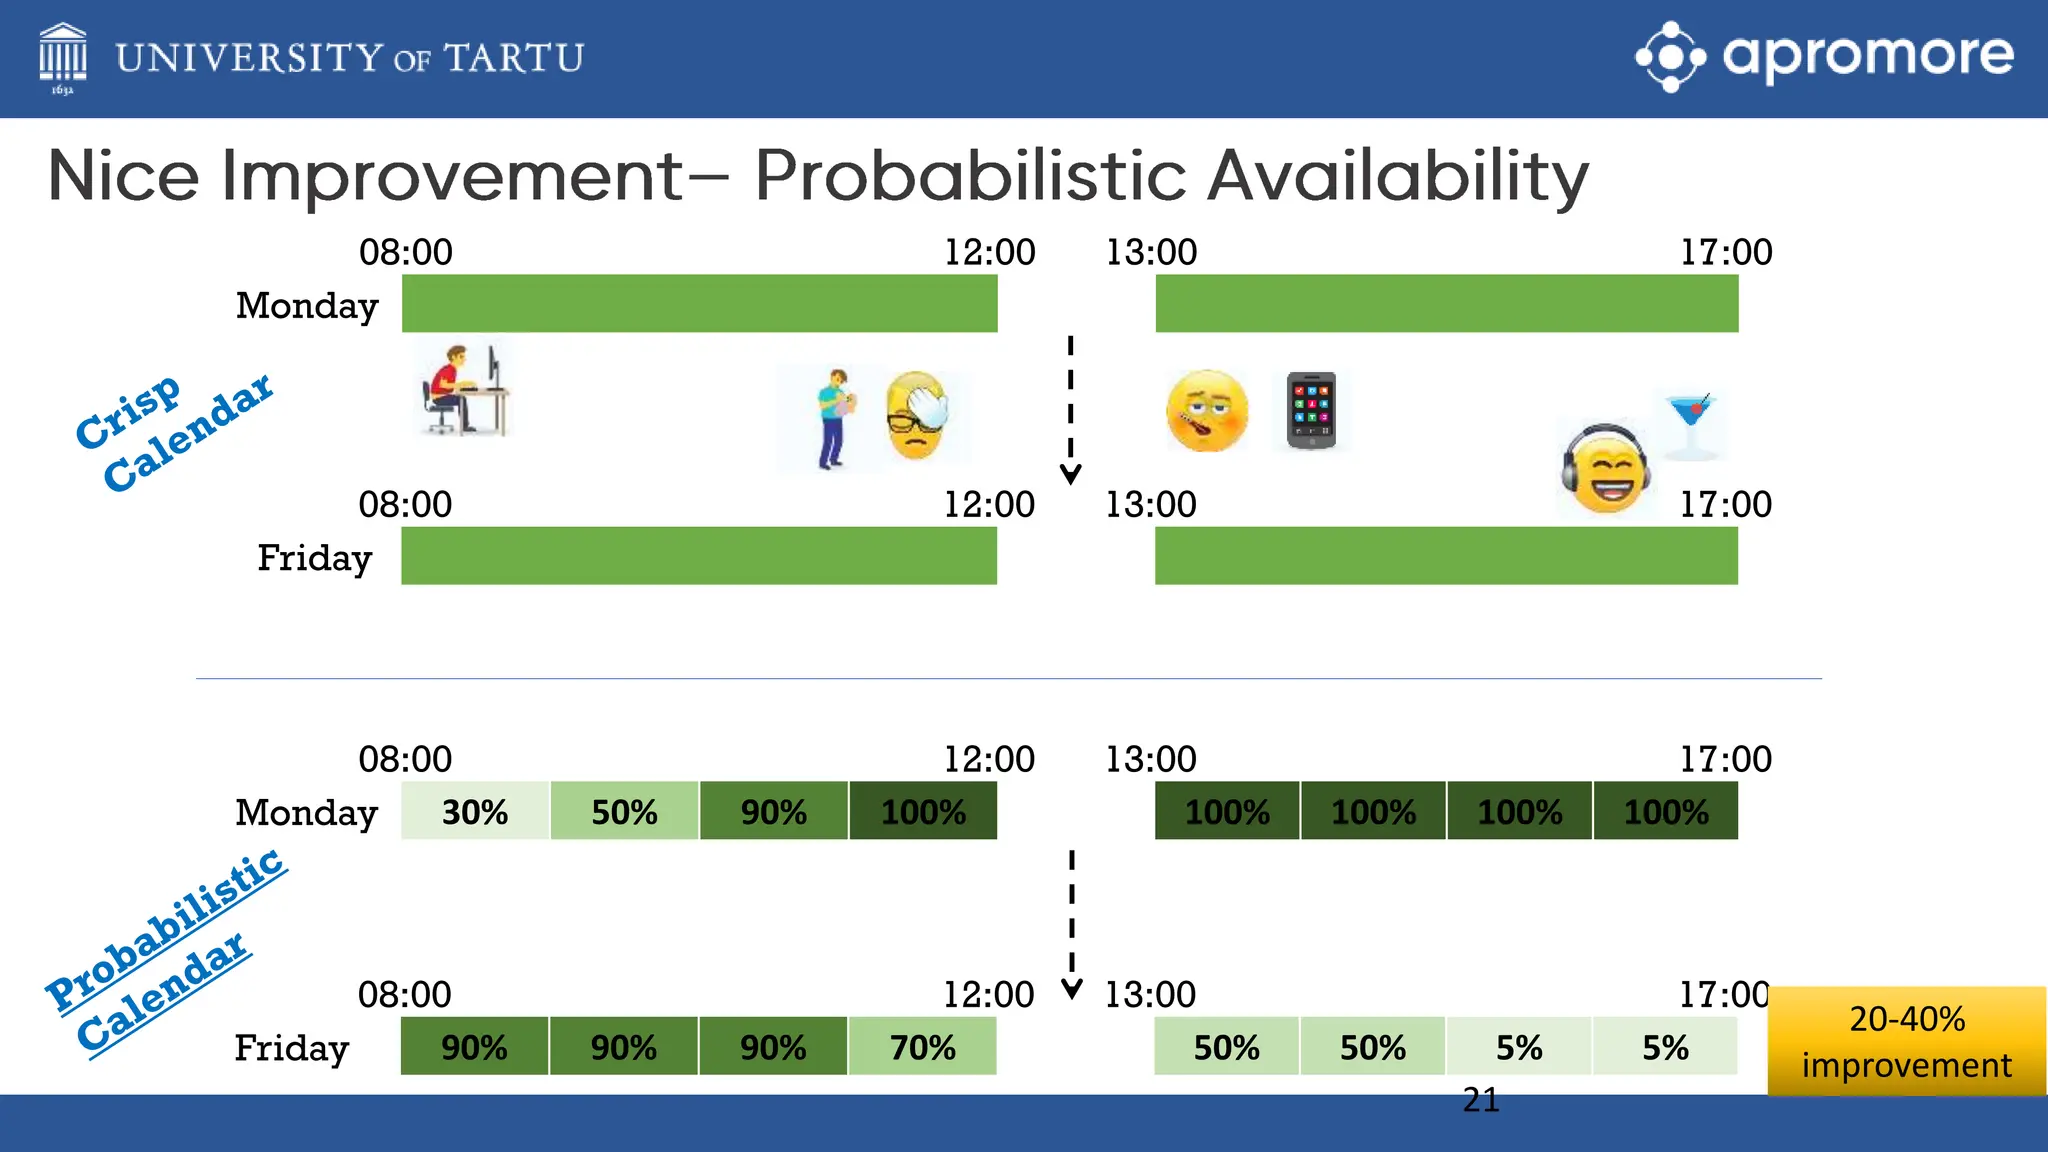
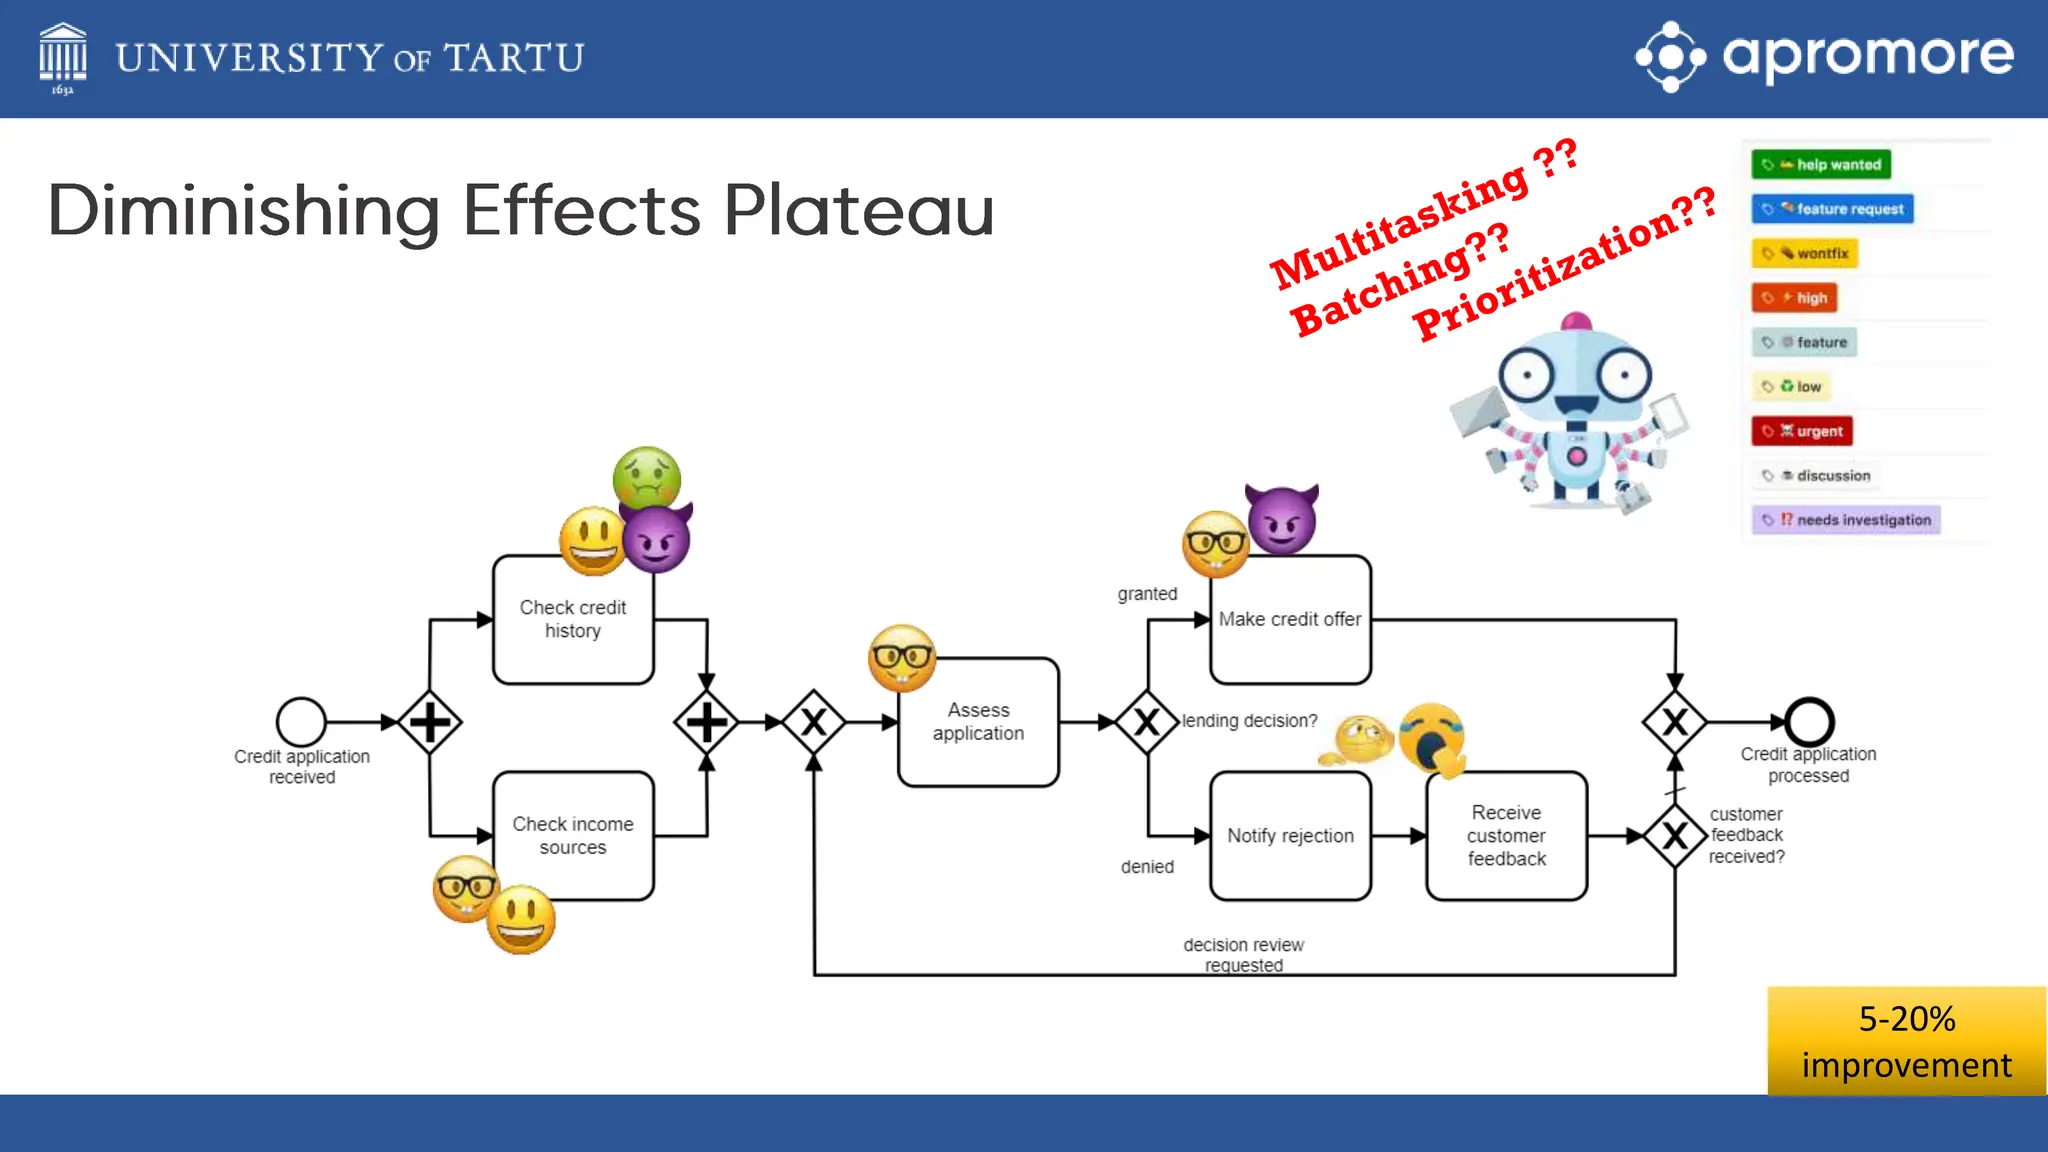
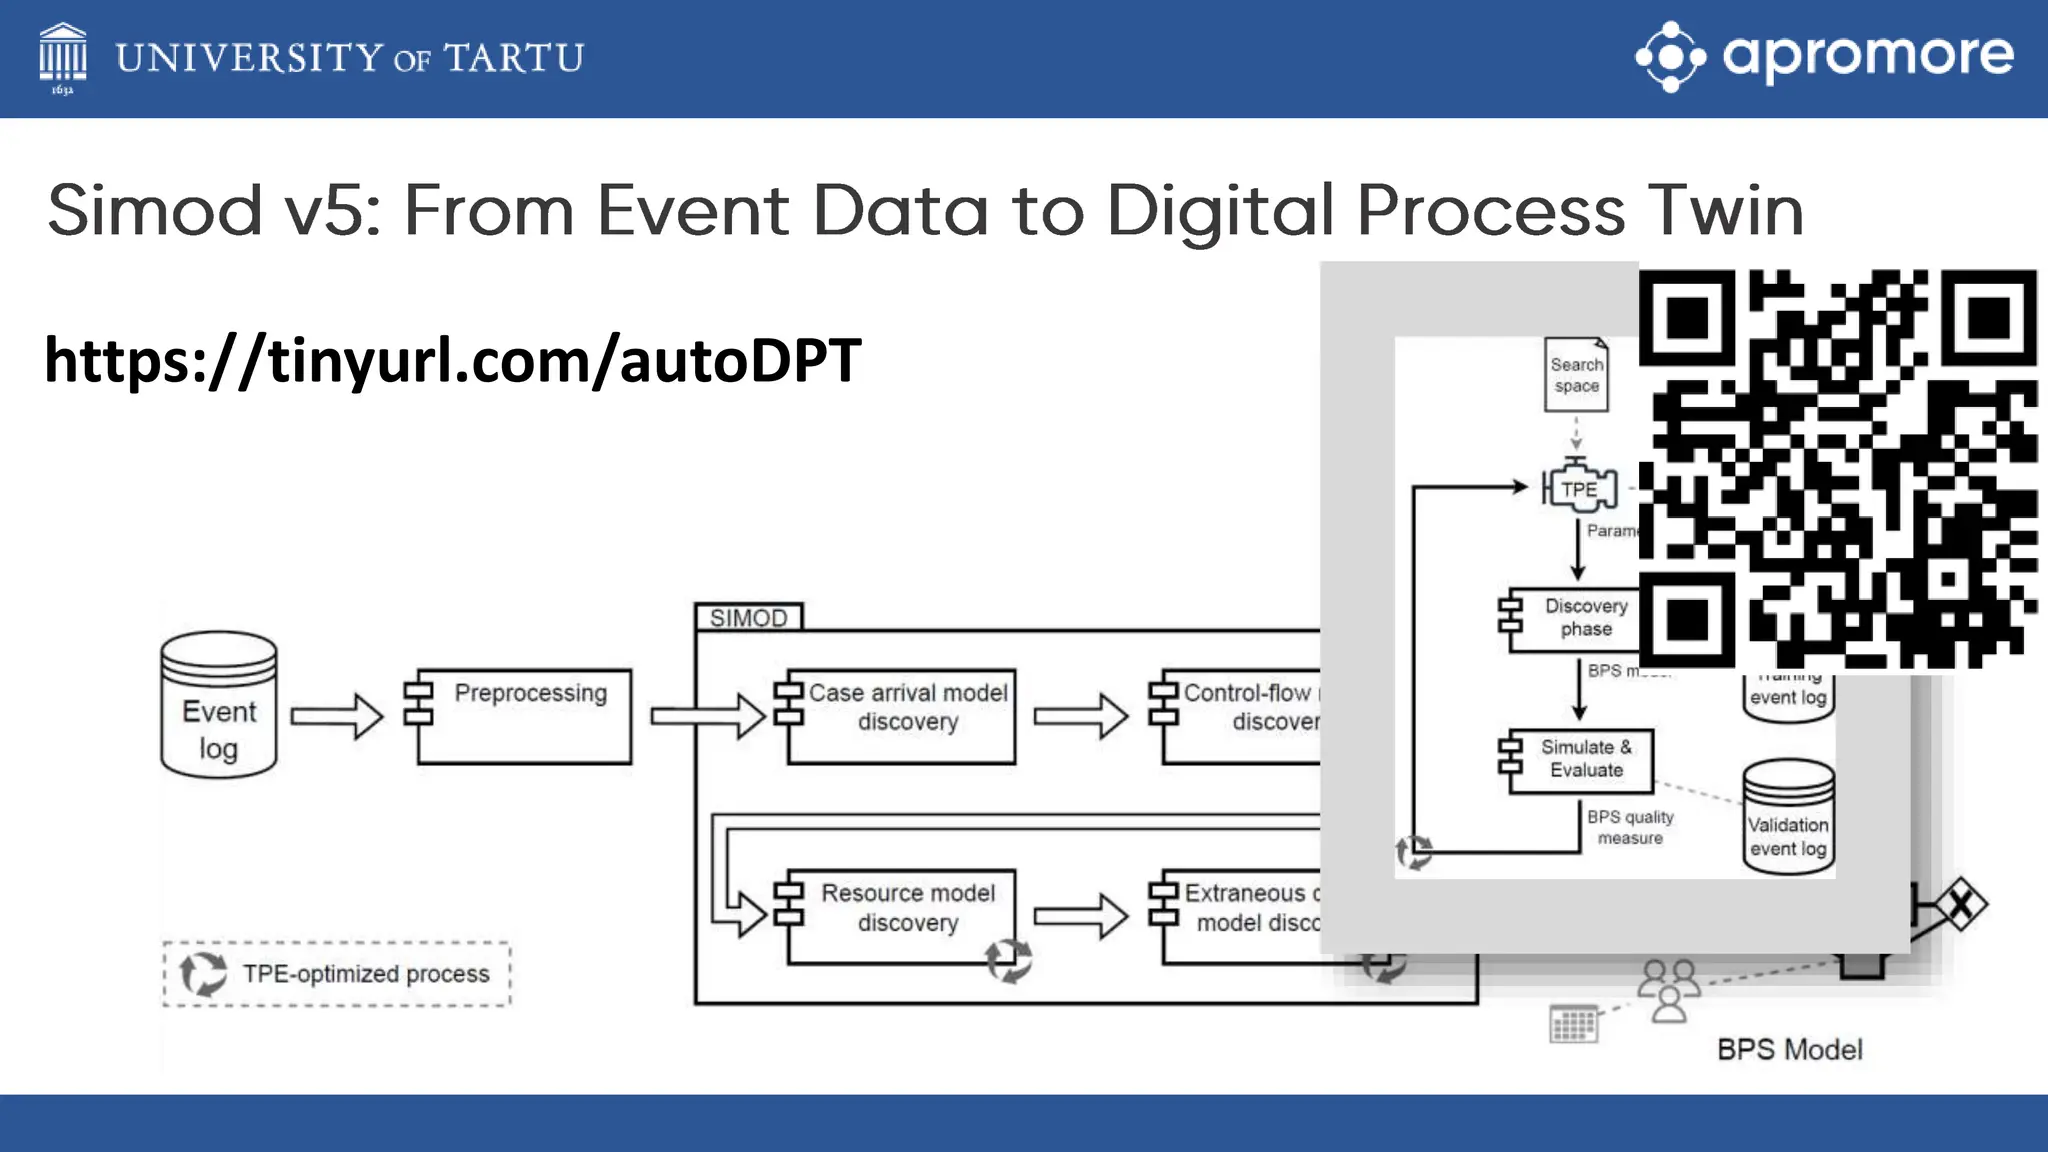
AUTO-TWIN Webinar – June 19, 2024
Model the
process
Define a
simulation
scenario
Run the
simulation
Analyze the
simulation
outputs
Repeat for
alternative
scenarios
3
4
5
Exp(20m)
Normal(20m, 4m)
Normal(10m, 2m)
Normal(10m, 2m)
Normal(10m, 2m)
0m
6
Arrival rate = 2 applications per hour
Inter-arrival time = 0.5 hour
Negative exponential distribution
From Monday-Friday, 9am-5pm
0.3
0.7
0.3
Clerk
Officer
System
Clerk
Officer
Officer
D
The process model is authoritative (always followed to the letter)
• No deviations, no workarounds
The simulation parameters accurately reflect reality
• …whereas in reality, they are often guesstimates
A resource only works on one task instance at a time / a task is performed by one resource
• No multi-tasking / no multi-resource tasks (teamwork)
Resources have robotic behavior (eager resources consume work items in FIFO mode)
• No batching, no tiredness effects, no interruptions, no distractions beyond “stochastic” ones
Undifferentiated resources
• Every resource in a “resource pool” has the same performance as others
No time-sharing outside the simulated process
• Resources fully dedicated to one process
9
End Result
Business process simulations based
on incomplete models,
guesstimates, and simplifying
assumptions are not faithful
 adoption of business process
simulation is disappointing
0
Event Log
Given
• one or more business processes, for which we
have:
• one or more process specifications and/or
• event logs generated by the execution of the
processes on top of one or more information
systems.
• one or more process performance measures of
interest (e.g. cycle time, resource cost)
• One or more changes to the process (interventions)
Predict
• Predict the values of the process performance
measures after the given interventions.
Non-Functional Requirements
14
Predictions accurate.
Accuracy may be measured e.g. via an error
between the predicted and the actual
performance measures after intervention.
Predictions should be accompanied by a
reliability estimate. In most cases, the
reliability is high.
Reliability could be captured, e.g. by
confidence intervals
Stochastic Process Model Discovery
Event log
Simod
Control-Flow
(BPMN Model)
• Filtering threshold
• Parallelism threshold
Branching
probabilities
Trace alignment +
replay to determine
how many times each
sequence flow is
traversed
Resources & Performance
• Resource pools
• Pool-task assignment
• Resource timetables
• Multi-tasking behavior
• Interarrival distribution
• Activities durations distribution
Simulation
Simulator
Optimizer
Congestion Model Discovery
SplitMiner
Digital
Process
Twin (DPT)
event log (testing set)
K simulated event logs
1. Generate K simulated event logs.
2. Compare individually and report the average and confidence
interval.
D. Chapela-Campa, M. Dumas, A. Senderovich, et al. Can I Trust My Simulation Model? Measuring the Quality of Business Process Simulation Models. BPM 2023.
Temporal performance: mean percentage error of 15-40%
Huge under-estimation of activity waiting times
Erratic performance with large number of resources!
Erratic performance when multi-tasking present
Poor ability to capture the distribution of activity sequences.
Two directions:
Black-box – bring in deep learning!
White-box – Address limitations one by one, Kaizen style
M. Camargo et al. Automated discovery of business process simulation models from event logs. Decis. Support Syst. 134: 113284 (2020).
4 Clerks
Same Availability
Same Performance
vs Differentiated Availability
vs Differentiated Performance
Senior Clerk
Junior Clerk
Pooled Allocation
vs Unpooled Allocation
5-10%
improvement
O. Lopez-Pintado & M. Dumas Discovery, simulation, and optimization of business processes with differentiated resources. Inf. Syst. 120: 102289 (2024)
Branching Probabilities
* Frequency Analysis
Branching Conditions
* Deterministic Expressions
0.3
0.7
0.5
Activity Decision
Make Credit offer denied
Notify Rejection granted
Activity Decision
Make Credit offer granted
Notify Rejection denied
5-10%
improvement
Extraneous activity delays: waiting times not explained by available data.
1. Analyze the waiting time previous to each activity (since its enablement).
2.Were the resources available?
10-20%
improvement
D. Chapela-Campa & M. Dumas. Enhancing business process simulation models with extraneous activity delays. Inf. Syst. 122: 102346 (2024)
21
08:00 12:00 13:00 17:00
Monday
08:00 12:00 13:00 17:00
Friday
30% 50% 90% 100% 100% 100% 100% 100%
08:00 12:00 13:00 17:00
Monday
90% 90% 90% 70% 50% 50% 5% 5%
08:00 12:00 13:00 17:00
Friday
20-40%
improvement
5-20%
improvement
https://tinyurl.com/autoDPT

Discovering Digital Process Twins for What-if Analysis: a Process Mining Approach

  • 1.
    AUTO-TWIN Webinar –June 19, 2024
  • 3.
    Model the process Define a simulation scenario Runthe simulation Analyze the simulation outputs Repeat for alternative scenarios 3
  • 4.
  • 5.
  • 6.
    6 Arrival rate =2 applications per hour Inter-arrival time = 0.5 hour Negative exponential distribution From Monday-Friday, 9am-5pm 0.3 0.7 0.3
  • 7.
  • 8.
  • 9.
    The process modelis authoritative (always followed to the letter) • No deviations, no workarounds The simulation parameters accurately reflect reality • …whereas in reality, they are often guesstimates A resource only works on one task instance at a time / a task is performed by one resource • No multi-tasking / no multi-resource tasks (teamwork) Resources have robotic behavior (eager resources consume work items in FIFO mode) • No batching, no tiredness effects, no interruptions, no distractions beyond “stochastic” ones Undifferentiated resources • Every resource in a “resource pool” has the same performance as others No time-sharing outside the simulated process • Resources fully dedicated to one process 9
  • 10.
    End Result Business processsimulations based on incomplete models, guesstimates, and simplifying assumptions are not faithful  adoption of business process simulation is disappointing 0
  • 11.
  • 13.
    Given • one ormore business processes, for which we have: • one or more process specifications and/or • event logs generated by the execution of the processes on top of one or more information systems. • one or more process performance measures of interest (e.g. cycle time, resource cost) • One or more changes to the process (interventions) Predict • Predict the values of the process performance measures after the given interventions.
  • 14.
    Non-Functional Requirements 14 Predictions accurate. Accuracymay be measured e.g. via an error between the predicted and the actual performance measures after intervention. Predictions should be accompanied by a reliability estimate. In most cases, the reliability is high. Reliability could be captured, e.g. by confidence intervals
  • 15.
    Stochastic Process ModelDiscovery Event log Simod Control-Flow (BPMN Model) • Filtering threshold • Parallelism threshold Branching probabilities Trace alignment + replay to determine how many times each sequence flow is traversed Resources & Performance • Resource pools • Pool-task assignment • Resource timetables • Multi-tasking behavior • Interarrival distribution • Activities durations distribution Simulation Simulator Optimizer Congestion Model Discovery SplitMiner Digital Process Twin (DPT)
  • 16.
    event log (testingset) K simulated event logs 1. Generate K simulated event logs. 2. Compare individually and report the average and confidence interval. D. Chapela-Campa, M. Dumas, A. Senderovich, et al. Can I Trust My Simulation Model? Measuring the Quality of Business Process Simulation Models. BPM 2023.
  • 17.
    Temporal performance: meanpercentage error of 15-40% Huge under-estimation of activity waiting times Erratic performance with large number of resources! Erratic performance when multi-tasking present Poor ability to capture the distribution of activity sequences. Two directions: Black-box – bring in deep learning! White-box – Address limitations one by one, Kaizen style M. Camargo et al. Automated discovery of business process simulation models from event logs. Decis. Support Syst. 134: 113284 (2020).
  • 18.
    4 Clerks Same Availability SamePerformance vs Differentiated Availability vs Differentiated Performance Senior Clerk Junior Clerk Pooled Allocation vs Unpooled Allocation 5-10% improvement O. Lopez-Pintado & M. Dumas Discovery, simulation, and optimization of business processes with differentiated resources. Inf. Syst. 120: 102289 (2024)
  • 19.
    Branching Probabilities * FrequencyAnalysis Branching Conditions * Deterministic Expressions 0.3 0.7 0.5 Activity Decision Make Credit offer denied Notify Rejection granted Activity Decision Make Credit offer granted Notify Rejection denied 5-10% improvement
  • 20.
    Extraneous activity delays:waiting times not explained by available data. 1. Analyze the waiting time previous to each activity (since its enablement). 2.Were the resources available? 10-20% improvement D. Chapela-Campa & M. Dumas. Enhancing business process simulation models with extraneous activity delays. Inf. Syst. 122: 102346 (2024)
  • 21.
    21 08:00 12:00 13:0017:00 Monday 08:00 12:00 13:00 17:00 Friday 30% 50% 90% 100% 100% 100% 100% 100% 08:00 12:00 13:00 17:00 Monday 90% 90% 90% 70% 50% 50% 5% 5% 08:00 12:00 13:00 17:00 Friday 20-40% improvement
  • 22.
  • 23.