This document provides an executive summary of a study conducted to assess groundwater quality characteristics in industrially predominant areas of Himachal Pradesh. The study was conducted in two phases: the first involved collecting groundwater samples from deep tube wells and analyzing water quality parameters, while the second involved additional sampling from shallow tube wells to better understand spatial and temporal variations in water quality. Analysis found that groundwater quality varied spatially and some parameters exceeded permissible limits. While direct industrial impacts were not established from deep well samples, shallow well samples provided insight and detected traces of heavy metals at some locations. The study developed GIS-based maps and models to analyze spatial trends in water quality and vulnerability. It concluded that continuous long-term monitoring is
Abstract— 11 wells in Wadi Fatimah were chosen to perform this study. The studied area was classified into three regions namely Abo-Hassani, Al-Khief, and Allaf. In Abo-Hassani, the water quality agrees with the WHO standards. The TDS was between 175 and 339 ppm. The hardness was below 193 ppm. The sodium and the chloride were below 71 and 63 ppm, respectively. The water here suffers from the presence of E.Coli. In Al-Kheif region, the water suffers from the high TDS 1077 ppm and the presence of E. Coli. In Allaf region the TDS was high a little (487 ppm), but still within WHO standards for drinking water. In this region, the sulfate value and the total hardness were above 250 ppm, which exceeds the WHO standards.
Abstract— 11 wells in Wadi Fatimah were chosen to perform this study. The studied area was classified into three regions namely Abo-Hassani, Al-Khief, and Allaf. In Abo-Hassani, the water quality agrees with the WHO standards. The TDS was between 175 and 339 ppm. The hardness was below 193 ppm. The sodium and the chloride were below 71 and 63 ppm, respectively. The water here suffers from the presence of E.Coli. In Al-Kheif region, the water suffers from the high TDS 1077 ppm and the presence of E. Coli. In Allaf region the TDS was high a little (487 ppm), but still within WHO standards for drinking water. In this region, the sulfate value and the total hardness were above 250 ppm, which exceeds the WHO standards.
Condition Studied Moisture of Ground Agryculture Production in Azerbaijan to ...CrimsonpublishersMedical
Condition Studied Moisture of Ground Agryculture Production in Azerbaijan to Achieve Ecological Clean Products by Aliev ZH in International Journal of Medical Sciences
International Journal of Computational Engineering Research(IJCER) is an intentional online Journal in English monthly publishing journal. This Journal publish original research work that contributes significantly to further the scientific knowledge in engineering and Technology.
EVALUATION OF GROUNDWATER QUALITY OF VAIPPAR BASIN, TAMIL NADU, INDIA: A GEOI...SagarChougule11
The Vaippar Basin, one of the important basins of Tamil Nadu is located between 9° 0' 05" & 9° 44' 56" N latitudes and 77° 23' 25" & 78° 17' 02" E longitudes with an area of 5339 sq.km. Groundwater samples were collected from 91 different locations in Vaippar basin, Tamil Nadu, India. Groundwater quality data for the period of 30 years (1983 to 2013) of both pre-monsoon and post-monsoon periods were used to analyze the groundwater quality aspects of the Vaippar basin.
Gowanus Canal Survey Report - Single Beam Echo SoundersSyQwest Inc.
CR Environmental, Inc. (CR) performed a bathymetric survey of part of Gowanus Bay and all navigable portions of the Gowanus Canal, located in Brooklyn, NY, on January 5, 2010 for Henningson, Durham and Richardson Architecture and Engineering, P.C. (HDR). The objective of the survey was to map seabed elevations within the Gowanus Canal Study Area in support of the ongoing Remedial Investigation/Feasibility Study (RI/FS). These data can be used to support volume calculations, estimates of changes in depth over time, and to assist in planning sediment sampling investigations.
This draft report summarizes the methods used for bathymetric data acquisition and the results obtained. Digital data products were transmitted electronically to HDR and CH2M Hill, Inc. on January 25, 2010 and also on a CD with the draft report submitted February 2010. Data are projected to New York State Plane (Long Island), NAD-83, U. S. Survey Feet. Seabed elevations are reported in U.S. Survey Feet relative to NAVD88 (estimated).
Single-Beam Echo Sounders (SBES)
Syqwest Inc. has a complete line of high quality affordable single beam echo sounders to choose from for Hydrographic Surveying applications.
SBES systems were developed about 80 years ago and have substantially contributed to important primary oceanographic discoveries and developments. SBES are still commonly used in hydrographic surveying. A SBES can measure only one point per acoustic echo wave (echo) emitted. The specifications of SBES are defined by beam angle and frequency of transmitted acoustic wave from the transducer as well as many other sonar parameters which may be selected in order to provide water depth capabilities from less than 1 meter to full ocean depth.
Final year civil engineering project report physico chemical analsis of groun...Shaik Jawad
Final year civil engineering project report
environmental engineering project report
environmental engineering project report
environmental engineering
remote sensing technique
ground water quality
physico chemical analysis of ground water quality
physico chemical analysis of ground water quality with application of GIS AND REMOTE SENSING TECHNIQUE
Dear Sir / Madam,
Greetings and Good morning!!!!
Please find attached to this email a copy of my latest Resume. I am interested in applying for the Sr Hydrogeologist position. I have more than 16 years of experience in the field of Geological / Hydrogeological / and Geotechnical investigations in India, Singapore, Papua New Guinea and Bangladesh for soil & rock investigations for offshore and onshore. I believe that my strong technical experience and educational qualifications will make me a very competitive candidate for this position. I am immediately available for joining. If you have any questions or would like to set up a discussion, please let me know.
I look forward to hearing from you
Many Thanks,
Dr John Devadas. Dakey
drjohndevadas@yahoo.co.in
+91 8374568847
Kenex have been working with Duke Exploration in order to develop exploration targets for base and precious metal mineralisation in Australia. We have been involved throughout all stages of the exploration workflow, details of which are provided below. The Bundarra project represents one of the most successful exploration targeting projects that Kenex has been involved with and promises to be even more exciting in the future!
Potential Usage Estimation of Ground Water using Spatial Association Rule MiningSuci Utami
The utilization of ground water in the long term will lead to a number of negative impacts on groundwater resources and the environment, such as the decrease of groundwater level, seawater intrusion, land subsidence as well as scarcity of ground water. Furthermore, the use of ground water has directly affected the consumption pattern of Regional Water Company Bogor City (PDAM) customers. This study aims to determine the patterns and characteristics of PDAM customers in the utilization of ground water by using spatial association rule mining, so it can help PDAM to approximate the increase of customers that utilize ABT and the losses incurred. This research shows that as many as 53.362 (41.27%) PDAM customers that have the potential to use groundwater. The said customers are featured by several characteristics, such as being active customers, with monthly water bill of less than Rp. 53.358 and are not close to river.
Potential Usage Estimation of Ground Water using Spatial Association Rule MiningTELKOMNIKA JOURNAL
The utilization of ground water in the long term will lead to a number of negative impacts on
groundwater resources and the environment, such as the decrease of groundwater level, seawater
intrusion, land subsidence as well as scarcity of ground water. Furthermore, the use of ground water has
directly affected the consumption pattern of Regional Water Company Bogor City (PDAM) customers. This
study aims to determine the patterns and characteristics of PDAM customers in the utilization of ground
water by using spatial association rule mining, so it can help PDAM to approximate the increase of
customers that utilize ABT and the losses incurred. This research shows that as many as 53.362 (41.27%)
PDAM customers that have the potential to use groundwater. The said customers are featured by several
characteristics, such as being active customers, with monthly water bill of less than Rp. 53.358 and are not
close to river.
SyQwest Bathy-2010 Sub Bottom Profiler used in Tarbela Reservoir StudySyQwest Inc.
Hydrographic echo sounders are used to measure the depth to the seafloor by using the properties of acoustic waves. The principle of echo-sounders is basic - by measuring the two-way travel time between the acoustic waves transmitted on sea surface and those reflected at seafloor.
In this study, an integrated approach for hydrographic surveying is introduced and evaluated in terms of its efficiency in comparison with the traditional methods of hydrographic surveying. The approach develops an integrated environment of hydrographic surveying comprising human, hardware and software. The process of surveying starts from in-house planning using specialized geo-spatial softwares. Then, on site a combination of computer hardware, echosounder, differential global positioning system (DGPS), survey vessel and survey crew is made. Post-processing is performed after conducting a survey in order to improve quality of data by filtering errors and producing the end product like reservoir underwater terrain, development of reservoir stage-area and stage-storage relationships, etc. The study was applied to Tarbela Reservoir, Pakistan.
International Journal of Engineering Research and Applications (IJERA) is an open access online peer reviewed international journal that publishes research and review articles in the fields of Computer Science, Neural Networks, Electrical Engineering, Software Engineering, Information Technology, Mechanical Engineering, Chemical Engineering, Plastic Engineering, Food Technology, Textile Engineering, Nano Technology & science, Power Electronics, Electronics & Communication Engineering, Computational mathematics, Image processing, Civil Engineering, Structural Engineering, Environmental Engineering, VLSI Testing & Low Power VLSI Design etc.
Similar to Hp wq study of ground water quality characteristics in industrially predominant areas of himachal pradesh (20)
UiPath Test Automation using UiPath Test Suite series, part 3DianaGray10
Welcome to UiPath Test Automation using UiPath Test Suite series part 3. In this session, we will cover desktop automation along with UI automation.
Topics covered:
UI automation Introduction,
UI automation Sample
Desktop automation flow
Pradeep Chinnala, Senior Consultant Automation Developer @WonderBotz and UiPath MVP
Deepak Rai, Automation Practice Lead, Boundaryless Group and UiPath MVP
Software Delivery At the Speed of AI: Inflectra Invests In AI-Powered QualityInflectra
In this insightful webinar, Inflectra explores how artificial intelligence (AI) is transforming software development and testing. Discover how AI-powered tools are revolutionizing every stage of the software development lifecycle (SDLC), from design and prototyping to testing, deployment, and monitoring.
Learn about:
• The Future of Testing: How AI is shifting testing towards verification, analysis, and higher-level skills, while reducing repetitive tasks.
• Test Automation: How AI-powered test case generation, optimization, and self-healing tests are making testing more efficient and effective.
• Visual Testing: Explore the emerging capabilities of AI in visual testing and how it's set to revolutionize UI verification.
• Inflectra's AI Solutions: See demonstrations of Inflectra's cutting-edge AI tools like the ChatGPT plugin and Azure Open AI platform, designed to streamline your testing process.
Whether you're a developer, tester, or QA professional, this webinar will give you valuable insights into how AI is shaping the future of software delivery.
Generating a custom Ruby SDK for your web service or Rails API using Smithyg2nightmarescribd
Have you ever wanted a Ruby client API to communicate with your web service? Smithy is a protocol-agnostic language for defining services and SDKs. Smithy Ruby is an implementation of Smithy that generates a Ruby SDK using a Smithy model. In this talk, we will explore Smithy and Smithy Ruby to learn how to generate custom feature-rich SDKs that can communicate with any web service, such as a Rails JSON API.
GDG Cloud Southlake #33: Boule & Rebala: Effective AppSec in SDLC using Deplo...James Anderson
Effective Application Security in Software Delivery lifecycle using Deployment Firewall and DBOM
The modern software delivery process (or the CI/CD process) includes many tools, distributed teams, open-source code, and cloud platforms. Constant focus on speed to release software to market, along with the traditional slow and manual security checks has caused gaps in continuous security as an important piece in the software supply chain. Today organizations feel more susceptible to external and internal cyber threats due to the vast attack surface in their applications supply chain and the lack of end-to-end governance and risk management.
The software team must secure its software delivery process to avoid vulnerability and security breaches. This needs to be achieved with existing tool chains and without extensive rework of the delivery processes. This talk will present strategies and techniques for providing visibility into the true risk of the existing vulnerabilities, preventing the introduction of security issues in the software, resolving vulnerabilities in production environments quickly, and capturing the deployment bill of materials (DBOM).
Speakers:
Bob Boule
Robert Boule is a technology enthusiast with PASSION for technology and making things work along with a knack for helping others understand how things work. He comes with around 20 years of solution engineering experience in application security, software continuous delivery, and SaaS platforms. He is known for his dynamic presentations in CI/CD and application security integrated in software delivery lifecycle.
Gopinath Rebala
Gopinath Rebala is the CTO of OpsMx, where he has overall responsibility for the machine learning and data processing architectures for Secure Software Delivery. Gopi also has a strong connection with our customers, leading design and architecture for strategic implementations. Gopi is a frequent speaker and well-known leader in continuous delivery and integrating security into software delivery.
Epistemic Interaction - tuning interfaces to provide information for AI supportAlan Dix
Paper presented at SYNERGY workshop at AVI 2024, Genoa, Italy. 3rd June 2024
https://alandix.com/academic/papers/synergy2024-epistemic/
As machine learning integrates deeper into human-computer interactions, the concept of epistemic interaction emerges, aiming to refine these interactions to enhance system adaptability. This approach encourages minor, intentional adjustments in user behaviour to enrich the data available for system learning. This paper introduces epistemic interaction within the context of human-system communication, illustrating how deliberate interaction design can improve system understanding and adaptation. Through concrete examples, we demonstrate the potential of epistemic interaction to significantly advance human-computer interaction by leveraging intuitive human communication strategies to inform system design and functionality, offering a novel pathway for enriching user-system engagements.
Slack (or Teams) Automation for Bonterra Impact Management (fka Social Soluti...Jeffrey Haguewood
Sidekick Solutions uses Bonterra Impact Management (fka Social Solutions Apricot) and automation solutions to integrate data for business workflows.
We believe integration and automation are essential to user experience and the promise of efficient work through technology. Automation is the critical ingredient to realizing that full vision. We develop integration products and services for Bonterra Case Management software to support the deployment of automations for a variety of use cases.
This video focuses on the notifications, alerts, and approval requests using Slack for Bonterra Impact Management. The solutions covered in this webinar can also be deployed for Microsoft Teams.
Interested in deploying notification automations for Bonterra Impact Management? Contact us at sales@sidekicksolutionsllc.com to discuss next steps.
DevOps and Testing slides at DASA ConnectKari Kakkonen
My and Rik Marselis slides at 30.5.2024 DASA Connect conference. We discuss about what is testing, then what is agile testing and finally what is Testing in DevOps. Finally we had lovely workshop with the participants trying to find out different ways to think about quality and testing in different parts of the DevOps infinity loop.
The Art of the Pitch: WordPress Relationships and SalesLaura Byrne
Clients don’t know what they don’t know. What web solutions are right for them? How does WordPress come into the picture? How do you make sure you understand scope and timeline? What do you do if sometime changes?
All these questions and more will be explored as we talk about matching clients’ needs with what your agency offers without pulling teeth or pulling your hair out. Practical tips, and strategies for successful relationship building that leads to closing the deal.
From Daily Decisions to Bottom Line: Connecting Product Work to Revenue by VP...
Hp wq study of ground water quality characteristics in industrially predominant areas of himachal pradesh
1. i
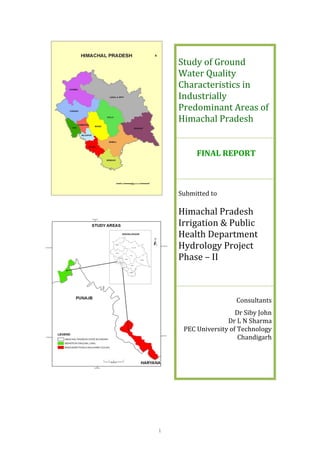
Study of Ground
Water Quality
Characteristics in
Industrially
Predominant Areas of
Himachal Pradesh
FINAL REPORT
Submitted to
Himachal Pradesh
Irrigation & Public
Health Department
Hydrology Project
Phase – II
Consultants
Dr Siby John
Dr L N Sharma
PEC University of Technology
Chandigarh
2. ii
PREFACE
This report is part of a purpose driven study entitled “Study of Ground Water
Quality Characteristics in Industrially Predominant Areas of Himachal Pradesh”
jointly undertaken by HP IPH and PEC University of Technology, Chandigarh. The
primary objective of this study was to improve and develop an integrated and
comprehensive hydrological data collection and database management system for
improved productivity and cost effectiveness of water related investments in
Himachal Pradesh.
In response to the letter No. IPH-SE-Hyd-Project II-PDSr2010 -3757-59 dated
27.08.10, a formal proposal was submitted by the Principal investigator from PEC
University of Technology, Chandigarh to the Superintending Engineer (Hydrology)
and Nodal Officer, Hydrology Project – II, IPH, Himachal Pradesh. The project
proposal was subsequently negotiated and accepted in a joint meeting held in the
office of the Superintending Engineer (Hydrology) office at Shimla on 22nd
November 2010. On receipt of the offer letter No. IPH-Hyd-II-CB-Tender-Ground
water Quality Characteristics/2010-4522-29 dated 07.01.2011; the project work was
formally initiated. The project team (Consultants / Client Deptt) after preliminary
reconnaissance prepared the Inception Report and submitted the same by 30 June
2011. The historical data available with the IPH and Central Pollution Control Board
(CPCB) / HPPCB were used to prepare the baseline maps. Subsequent data collected
from the analysis of samples from the identified tube wells were used to prepare the
spatial variation in groundwater quality of the study area. As the data collected from
the deep tube wells during the first phase of the study could not yield meaningful
conclusions to meet the objectives of the study, a second phase of the study was
conducted for a period of one year from March 2013 to February 2014 (extended
project duration) with sampling from the shallow tube wells identified in the study
area.
The consultants would like to place on record their deep sense of gratitude to
the Nodal Officer and all other officers of HP IPH for their cooperation and support in
implementing the project. Thanks are also due to the technical staff who worked with
in preparing the GIS based maps.
3. iii
CONTENTS
PREFACE
LIST OF TABLES
LIST OF FIGURES
EXECUTIVE SUMMARY
CHAPTER 1 : INTRODUCTION 1-3
1.0 General
1.1 Statement of the Problem
1.2 Objective of the Study
CHAPTER 2 : STUDY AREA 4-10
2.0 General
2.1 Baddi, Barotiwala, Nalagarh of District Solan
2.1.1 Climate and Rainfall
2.1.2 Geomorphology and Soil
2.1.3 Hydrogeology
2.1.4 Industries in the Baddi, Barotiwala, Nalagarh of District Solan
2.2 Tahilwal and Mehatpur of District Una
2.2.1Climate and Rainfall
2.2.2 Geomorphology & Soil
2.2.3 Hydrogeology
2.2.4 Industries in the Tahliwal and Mehatpur of District Una
2.3 Depth to water level and water level fluctuation chapter
CHAPTER 3 : METHODOLOGY 11-33
3.0 Introduction
3.1 Work plan
3.2 GIS based mapping of the study area
3.2.1 Geo-saptial setting of the study area
3.2.2 Location of industries (possible sources of contamination)
3.2.3 Georefrencing of tubewells
3.2.4 Gological an d geomorphological maps
3.2.5 Land use and land cover
4. iv
3.3 Water quality mapping
3.3.1 Baseline data
3.3.2 Identification of the tube wells and parameters for Monitoring
3.3.3 Updation of data through collection and analysis of the
groundwater samples
3.3.4 Spatial distribution of quality of water
3.3.5 Preparation of lithological maps of study area
3.3.6 Vulnerability / Pollution potential
CHAPTER 4 : RESULTS AND DISCUSSION 34-185
4.0 General
4.1 Analysis based on the historical / baseline data
4.2 Spatial variation in deep tube wells in 2012
4.3 Spatial variation in deep tube wells in 2013
4.3.1 Pre - Monsoon
4.3.2 Post - Monsoon
4.3.3 Variation in the concentration of the parameters in deep tube wells of
pre and post monsoon 2013
4.4 Spatial variation in shallow tube wells in 2013
4.4.1 Pre - Monsoon
4.4.2 Post - Monsoon
4.4.3 Variation in the concentration of the parameters in deep tube wells of
pre and post monsoon 2013
4.5 Major ion concentration
4.6 Lithological model
4.7 Groundwater vulnerability
CHAPTER 5 : CONCLUSIONS AND RECOMMENDATIONS 186-188
5.1 Summary and Conclusions
5.2 Recommendations
REFERENCES 189-190
APPENDIX 1
- List of Industries
5. v
EXECUTIVE SUMMARY
Industrialization and water resources have been usually projected on a
conflicting mode. It is intuitive that the industrial pollutants / contaminants do affect
the quality of groundwater, if they are able to get transported to the aquifers. In view
of this, a PDS entitled “Study of Ground Water Quality Characteristics in Industrially
Predominant Areas of Himachal Pradesh” was awarded under the Hydrology Project
– II, Himachal Pradesh. The major objective of the project was to improve the
hydrological data collection and management system by developing an integrated and
comprehensive hydrological data collection and information system for improved
productivity and cost effectiveness of water related investments in Himachal Pradesh.
The specific objective of the study was to assess the characteristics of groundwater in
industrially predominant areas of Himachal Pradesh.
The major industrial areas in the state of Himachal Pradesh viz Baddi-
Barotiwala in Solan District and Tahliwal- Mehatpur falling in Una District were
considered for the study. The total area of the study area was
UNA - 58.73 km2
Baddu Barotiwala - 134.00 km2
The areas are bound by the geographical setting of
UNA: 760
15’ 15” E to 760
22’ 0” E and 310
26’ 1” N to 310
18’ 11” N
Baddi- Barotiwala: 760
38’ 50” E to 760
53’ 32” E and 310
5’ 35” N to 300
52’ 0” N
To achieve the objectives of the study the following work plan was adopted:
1. Field study to mark the spatial location of groundwater structures in the
study area
2. Laboratory studies to prepare and update the database with respect to
various geochemical quality parameters of the groundwater in the study
area
3. Development of the hydro-geological database of the area of study
4. Analysis of the data and development of spatial and temporal maps/models
in a GIS environment
5. Validation of models and development of the groundwater management
tools.
6. vi
The base maps of the study area were prepared using Survey of India’s (SOI)
topographic sheet Nos 53A7, 53A12, 53A16, 53 B9 and 53 B13 of 1:50,000 scale,
secondary data collected from the various departments, GPS based spatial data and
the attribute data collected from the field work coupled with IRS LISS IV data
procured as part of this study. The study area boundaries were fixed by considering
the state boundary, drainage pattern, topography, location of industries and location of
water bodies such as rivers, streams etc. The various thematic maps such as drainage,
geomorphology, geology, landuse & landcover of the study area were prepared on a
GIS platform using ArcGIS 9.3.
The study was conducted in two distinct phases:
I. The field study to collect the samples of groundwater and to assess its
quality through laboratory studies.
II. Data analysis and preparation of the thematic maps and development of
specific groundwater management tools.
The water quality data available with HPPCB, CPCB, CGWB and HPIPH
were used to create a from the baseline data base. This baseline data was used to
identify the basic water quality parameters for the study.
A reconnaissance survey was conducted to identify representative tube well
locations for sampling of water for quality assessment. Based on the locations of the
industries and keeping in view the objectives of the study, a total of 18 tube wells (06
from Una and 12 from Baddi-Barotiwala) were chosen for the initial sampling.
Initially the data were collected for the identified deep tube wells in the study. The
maps showing the spatial variation in groundwater quality parameters in the region
were prepared using Arc/GIS. It has been found that the groundwater quality in the
region varied spatially for many of the parameters. However, the impact of the
industries on the groundwater quality could not be explicitly established in this part of
the study. Accordingly, it was decided to include specific parameters which could be
of the specific industry origin in further analysis. Parametrs like TOC/COD were
considered for tracing possible organic pollution from industries like food and
breweries, pharmaceuticals etc. Also, it was observed that the transport of the
pollutants of industry origin may take longer time period to reach the deep aquifers
7. vii
and this could be a possible reason for absence of such pollutants in the deep tube
well samples. Therefore, it was decided to dig shallow tube wells as observation wells
in the study area. The variation in the quality of groundwater in pre-monsoon and
post-monsoon was also decided to be studied. The data derived during the second
stage using the additional shallow tube wells provided better insight into the spatial
and temporal variations in the groundwater quality of the region. At few locations
traces of heavy metals like iron, lead, zinc, cadmium, chromium etc were observed.
The concentration of some of the parameters was exceeding the permissible limits.
The groundwater quality did show variation in pre and post monsoon samples. The
results indicated deteriorating trend in the groundwater quality of the region.
However, a continuous long term assessment of the groundwater quality and data
analysis is essential to make better understanding of the issue. Therefore, there is an
urgent need to improve the groundwater management system in Himachal Pradesh
especially in the industrially predominant areas.
The analysis of the piezometric observations indicated that the depth to water
level was ranging from 20 m to 100 m bgl in Una, whereas in Baddi –Barotiwala it
was ranging from 40 m to 210 m bgl in this area.
The lihtological models were developed using the hardcopy log charts
available with the department. This will provide an easy tool in predicting the
lithological profile of a tube well dug in the area. It will also offer capabilities in
predicting geogenic quality of groundwater of the study area. Geochemical facies
evaluation indicated that the groundwater of the study area is of Ca-Mg-HCO3 type.
Using geographical and geological parameters, the pollution potential
(vulnerability) of the study area was evaluated. Based on vulnerability, the study areas
were classified into three categories viz low, medium and high. The vulnerability
assssemnt of the study area using DRASTIC indicated that in Una region, the highly
vulnerable area was estimated to be around 10 – 15%; whereas in Baddi-Barotiwala
the percentage area falling under highly vulnerable category was about 80 - 85%.
GIS based information system for groundwater management developed as part
of the project is useful in dealing with diverse and complex data base of groundwater
quality. The visual comparison facilitates easy understanding and decision making
8. viii
related to groundwater management. The methodology developed in the project
presents a simple GIS based information system to deal with the data base of
continuous monitoring of groundwater system.
9. 1
CHAPTER - 1
INTRODUCTION
1 .0 INTRODUCTION
Water as a vital natural resource for human survival has been well-established. Water
from beneath the ground has been exploited for various beneficial water uses since the
earliest times. The choice of underground water is obviously on the basis of superior
quality, low capital cost of development, development in stages to keep pace with rising
demand and convenient availability close to where water is required Apart from the
natural or geogenic factors, anthropogenic influences such as industrial or domestic waste
disposal, solid waste land filling etc. affect the quality of groundwater. Therefore,
groundwater quality is the sum of geogenic and anthropogenic influences. To monitor the
changes in the groundwater quality due to the above influences groundwater quality
assessment programmes are normally envisaged. The overall goal of a groundwater
quality assessment programme, is to obtain a comprehensive picture of the spatial
distribution of groundwater quality and of the changes with time that occur, either
naturally, or under the influence of man. However, in practice, most of the groundwater
assessment systems are limited to generating data with regard to levels of parameters
defining groundwater quality. Often, much less thought and research efforts have gone
into the data management phase of groundwater quality assessment. Therefore, to meet
the above goals of the groundwater quality assessment programme, what is required is to
process and translate these data into information which can be used for groundwater
quality management. The benefits of comprehensive and appropriate groundwater quality
information are timely water quality management, and/or pollution control measures, that
can be taken based on it.
Himachal Pradesh, since attaining state hood in 1971, has adopted an approach of
balanced inter-sectoral development to raise the standard of living and overall prosperity
of the people of the state. As part of this approach, the industrial policy of Himachal
Pradesh was announced in 1991. The efforts of the state Govt. to promote industries have
received further impetus with the notification of special package of incentives for the
state by the central Govt. in 2003. However, considering increased pressure on its water
resources due population growth, industrialization, and climate change etc. the state has
10. 2
notified its State Water Policy in the year 2005 and later revised in 2013 in line with the
national water policy 2012. The salient issues identified in the said policy are:
In Himachal Pradesh availability of water is highly uneven in both space and
time.
Some parts of state have already become water stressed.
Rapid growth in demand for water due to population growth, urbanization,
changing lifestyle and industrialisation pose serious challenges to water security.
Groundwater, though part of hydrological cycle and a community resource, is still
perceived as an individual property and is exploited inequitably and without any
consideration to its sustainability leading to its over-exploitation in several areas.
Growing pollution of water sources, especially through industrial effluents, is
affecting the availability of safe water besides causing environmental and health
hazards.
A holistic and inter-disciplinary approach at water related problems is missing.
There is a need to map the aquifers to know the quantum and quality of ground
water resources (replenishable as well as non-replenishable).
Both surface water and ground water shall be regularly monitored for quality. A
phased programme shall be undertaken for effecting changes in different
parameters. Water quality parameters for different uses shall continuously be
reviewed with a view to closely monitor the changes in water quality with time.
All hydrological data, other than those classified on national security
consideration, should be in public domain. The data may be collected, collated,
processed and maintained in open and transparent manner on a GIS platform.
1.1 STATEMENT OF THE PROBLEM
Himachal Pradesh is one of the 4 new States amongst the participating 13 States and 8
Central agencies of Hydrology Project – II (HP – II). Main objective of Hydrology
Project–II is to improve and develop an integrated and comprehensive hydrological data
collection and information system for improved productivity and cost effectiveness of
water related investments in the country.
As part of the project a study to assess the impact of fast industrial growth on ground
water characteristics in the identified industrial areas of Himachal Pradesh was taken up.
11. 3
Ground water resource development in the valley parts of the state for meeting the
domestic, irrigational and industrial water needs is going on for the last three decades.
Due to extensive ground water development for irrigation and industrial units, the water
levels are likely to show depleting trend. This increasing water drawl coupled with the
disposal of sewage/effluents by growing domestic and industrial users is likely to affect
the groundwater quality. Therefore, there is an urgent need to initiate water quality
monitoring vis-à-vis water level monitoring network from both the shallow and deep
aquifers to monitor its behavior qualitatively and quantitatively, on short as well as long
term basis.
After discussing with the officials of IPH, Industry Department and HPPCB, the
following industrial areas were considered for this study:
(i) Baddi, Barotiwala, Nalagarh of District Solan and
(ii) Tahilwal and Mehatpur of District Una.
1.2 OBJECTIVES OF THE STUDY
The objective of the study is to assess the impact of fast industrial growth on ground
water characteristics in the identified industrial areas of Himachal Pradesh in respect of
the following:
1. Groundwater quality, trend of concentration of different quality parameters
and also the changes in quality characteristics due to rapid industrialization.
2. Sustainability of available ground water resources, different artificial
measures in selected locations with regards to augmentation of fresh water
reserve (both quantitatively and qualitatively) in the study area.
3. Planning for optimum development of ground water.
4. Suggesting ameliorative measures for protecting groundwater contamination
from the industrial effluents and policy guidelines.
Monitoring of ground water quantity and quality being one of the mandates of HP-II,
thus, this study has great relevance to the project.
12. 4
CHAPTER - 2
STUDY AREA
2.0 GENERAL
The study area comprises industrially predominant areas of Himachal Pradesh viz. Baddi,
Barotiwala, Nalagarh of District Solan and Tahilwal and Mehatpur of District Una. The
geographical, geological and hydrogeological settings of the study area and major
industries in the region are described below:
2.1 Baddi, Barotiwala, Nalagarh of District Solan
The area is bounded by Bilaspur district in north-west & Mandi district in the north,
Shimla & Sirmaur district in east & south-east respectively. District has inter-state
boundary in the south and west with State of Haryana and Punjab respectively. The
Nalagrah form one of the 4 sub-divisions and Tehsils
The local inhabitants mainly depend on agriculture for their subsistence and adopt several
traditional practices conducive for farming in sloping terrains. Large and small scale
industrial development however has taken place randomly all over the Solan district,
especially rapid industrial development is taking place in areas adjoining Punjab plains
viz., at Nalagarh valley with in the nagar panchayat of Baddi and gram panchayat of
Barotiwala, Sandholi,
2.1.1 Climate and Rainfall
The climate of the area is sub-tropical in the valley. There are four major seasons. The
winter season commences from Nov to Feb & ends in march; summer season extends
from March to June followed by the monsoon period extending from July to September.
Maximum precipitation occurs during the months from July to September. Average
annual rainfall in the area is about 1450 mm with average of 64 rainy days. Mean
maximum and minimum temperature ranges between 34°C and 4°C.
2.1.2 Geomorphology and Soil
The study area is in the valleys portion of the district Solan with altitude ranging from
300 to 700 m above MSL. The altitude of the hill ranges is higher in northern parts
whereas south-western parts are represented by low denuded hill ranges of Siwalik. The
13. 5
Nalagarh valley is narrow and deep with steep slopes trending in NW-SE direction. The
terrain is moderately to highly dissected with steep slopes.
Sirsa nadi, forming part of the drainage basin of Sutluj, virtually running parallel to study
area is drained by streams / rivers. Most of the rivers / streams / khads maintain base flow
for major part of the year. In hilly terrain the drainage density is high and fine but it
become coarse in foothill, kandi areas and valleys.
Soil is generally sandy loam in valley areas of the district and in rest of the hilly and
mountainous areas soil is skeletal, soil depth is generally shallow except in areas having
good vegetative cover. It is generally dry, shallow and deficient in organic matter.
Landslides are the common features in mountainous terrain. Soils are rich in nutrients and
thus are fertile
2.1.3 Hydrogeology
Geologically, the rock formations occupying the district range in age from pre-Cambrian
to Quaternary period. Hydro-geologically, the unconsolidated valley fill or alluvial
formation occurring in the valley area; semi-consolidated formations belonging to
Siwalik Group and older consolidated hard rocks form aquifer in this region.
Intergarnular pore spaces in the sedimentary formations and secondary fissured porosity
in hard rocks, topographical set up coupled with precipitation in the form of rain and
snow, mainly govern occurrence and movement of ground water. Porous alluvial
formation occurring in the valley area forms the most prolific aquifer system where as the
sedimentary semi-consolidated formations and hard rocks form aquifer of low yield
prospect.
In valley area of Nalagarh, the ground water occurs in porous unconsolidated alluvial
formation (valley fills) comprising, sand, silt, gravel, cobbles/pebbles etc. Ground water
occurs both under phreatic & confined conditions. Wells and tube wells are the main
ground water supply structures. Ground water is being developed in the area by medium
to deep tube wells, dug wells, dug cum bored wells. Depth of open dug wells and dug
cum bored well in area ranges from 4.00 to 60.00 m bgl wherein depth to water level
varies from near ground surface to more then 35 m bgl. Yield of shallow aquifer is
moderate with well discharges up to 10 lps. Deeper semi-confined aquifers are being
developed by tube wells ranging in depth from 65 to 120 m tapping 25-35 m granular
14. 6
zones. The well discharges vary from about 10 to 30 lps. Static water level of the tube
wells ranges from 2.2 to 43.20 mbgl. Depth to water table shows wide variation.
2.1.4 Industries in the Baddi, Barotiwala, Nalagarh of District Solan
The major industries in the region were identified to be pharmaceutical, detergent /
cosmetics, polymer, steel or iron, chemical industries, rubber / plastic, textile and leather.
The details of the same are given in Appendix-1
2.2 Tahilwal and Mehatpur of District Una
The area is bounded by Kangra district , towards north- & east by Hamirpur & Bilaspur
districts and towards south-west by State of Punjab. Una district is well developed in the
industrial sector due to close proximity to Punjab state with Mehatpur, Gagret, Tahliwal
& Amb as main industrial centers. Agriculture is the major occupation of the people of
the district with more than 70% population engaged in the agriculture and allied sector.
Major crops like maize, wheat, rice, sugarcane and pulses are grown apart from the
vegetables in the area. Net area irrigated in the district is about 85 sq km. Ground water is
the major source of water in the district for irrigation and domestic use.
2.2.1 Climate and Rainfall
Climate of the district is tropical to temperate in nature as the terrain varies from plains to
high hills. Temperature varies from minimum of 4°C in winter to the maximum of 46°C
in summer. The area receives rainfall during monsoon period extending from June to
September and also non- monsoon period (winter). The annual average rainfall in the area
is about 1040 mm with about 55 average rainy days. The winter season starts from the
November and continues till the middle of March. Thereafter the mercury continues
rising till the set of Monsoon which starts from the last weak of June and continues till
the middle of September
2.2.2 Geomorphology & Soil
The study area nestles between Siwalik ranges and forms part of the lesser Himalaya. It
has a diverse landscape made of the hills, valleys with piedmont zone, terraces. The
elevations of the land surface in the district vary from 340 m in south-eastern part to 1041
15. 7
m above sea level (ASL) in eastern part of the district. Siwalik hill ranges form hilly
upland or plateau area with elevation up to 666 m above mean sea level. The vast area
between the northwesterly & southeasterly hill ranges, on both sides of river Soan is the
UNA valley. The undulating to plain fertile Una valley has an area of about 455 sq km
and it extends from Daulatpur in the north west to Santokhgarh in the south east.
Soan or Swan River, a tributary of river Satluj, drains the major part (80%) of the Una
district. Soan is an intermittent river and maintains base flow in the lower reaches. Soan
river divides the district into two parts. Soan river flows in a southeastern direction and
has a wide channel and exhibits braided nature. It originates near Daulatpur in the
northeastern part and leaves the district near Santokhgarh and subsequently joins river
Satluj. During monsoon Soan river gets flooded due to shallow bank heights & large area
on both sides get affected.
Two types of soils are observed in the district viz., alluvial soil and non-calcic brown soil.
Most of the area in district is covered with alluvial soil and only about 25% of the area
i.e. hilly area in the district is covered with Non-calcic brown soil. Soils are rich in
nutrients and thus are fertile
2.2.3 Hydrogeology
The rock formations occupying the district range in age from pre-Cambrian to Quaternary
period
Hydro-geologically, either the unconsolidated valley fill or alluvial formation is
occurring in the valley area and semi-consolidated sediments belonging to Siwalik Group
form aquifer system in the district. Porous alluvial formation forms the most prolific
aquifer system in the valley area where as the sedimentary semi-consolidated formation
for aquifer of low yield prospect.
The ground water in the Siwalik group of rocks occur under the unconfined to semi
confined conditions mainly in the arenaceous rocks viz., sandstone, siltstone, gravel
boulder beds etc. The occurrence and movement of ground water is controlled by inter
granular pore spaces and also the fracture porosity. Siwalik sediments underlie
Hilly/undulating areas where springs (mostly gravity/contact type) and bowries are the
main ground water structures apart from the hand pumps. In the low lying areas underlain
by Siwalik rocks, dug wells and hand pumps are the main ground water structures that
16. 8
range in depth from 3.00 to 25.00 m bgl where in depth to water level ranges from 2.50 to
15.00 m bgl. In upland/plateau areas the water level is generally deep.
In Una valley area, the ground water occurs in porous unconsolidated / alluvial formation
(valley fills) comprising sand, silt, gravel, cobbles / pebbles etc., & forms prolific aquifer.
Ground water occurs both under phreatic & confined artesian conditions. Free flowing
wells are also observed in the lower part of Soan river. Ground water is being extensively
developed in the area by medium to deep tube wells, dug wells, dug cum bore wells and
also by hand pumps. Depth of dug wells and dug cum bored well in area ranges from
4.00 to 70.00 m bgl whereas depth to water level ranges from near surface to 26.46 m bgl
in pre monsoon Yield of shallow aquifer is moderate with well discharges up to 10 lps.
In Una valley depth to water level shows wide variation. During pre- monsoon period
(May 2006) it ranged from less than 2.00 to 65.00 m bgl. Deeper water levels are
confined mainly in south west (Beet area). In major parts of Una valley, depth to water
level ranged between 2.00 & 10.00 m bgl. Some areas in discharge zone along the river
Soan, show water logging conditions where water level is less than 1.5 m bgl. Historical
data indicate seasonal fluctuation (rise) between pre and post monsoon period. In general,
fall in water level up to 2 m is observed in most part of the valley.
2.2.4 Industries in the Tahilwal and Mehatpur of District Una
The major industries in the region were identified to be pharmaceutical, detergent /
cosmetics, breweries, motor, iron and steel, chemical industries, rubber / plastic, textile
and leather. The details of the same are given in Appendix 1.
2.3 DEPTH TO WATER LEVEL AND WATER LEVEL FLUCTUATION
It is very important to know depth to water level and its behavior with respect to time and
space. Based on the existing tube well data depth to water level for both the study areas
were prepared. In Una deeper aquifers are confined to northern parts of the district and
depth to water level is ranging from 20 m to 100 m bgl as shown in figure 2.1. Where as
in Baddi- barotiwala area deeper aquifers are confined to Nalagarh and Barotiwala areas.
The depth to water level is ranging from 40 m to 210 m bgl in this area (figure 2.2).
Several factors will affect recharge to groundwater including groundwater fluctuations.
When groundwater recharge exceeds the groundwater discharge, the rise in the
17. 9
groundwater takes place. On perusal of tube well data it is observed that seasonal i. e pre
and post monsoon water level fluctuations are a common site in both the areas. Decline of
water level in the both the areas can be attributed to rise in number of tube wells.
Attempts should be made to regularly observe and create a data base for future
management of the groundwater fluctuations.
Figure 2.1
19. 11
CHAPTER-3
METHODOLOGY
3.0 INTRODUCTION
The variation in quality of groundwater systems with respect to space and time is fair
possibility due to varied geogenic and anthropogenic reasons. Although, groundwater
quality assessment is taken up as a routine activity by many agencies/departments, much
less thought and research efforts have gone into, beyond laboratory analysis and
generating enormous data. In the data treatment phase of groundwater quality assessment,
water quality and hydro-geological data need to be converted into information that can be
interpreted and used for evolving effective water management systems.
The Geographical Information System (GIS) has emerged as an effective tool for
analyzing the vast volumes of different data types, obtained from different sources. The
data of groundwater quality spread over an area can be better understood with the help of
GIS based maps. In this project work an attempt was made to improve the groundwater
database in the study area using ArcGIS 9.3 (ESRI California, USA). It was also aimed to
enhance the insights into the interaction of industrialization generated anthropogenic
influences that affect the groundwater quality of the region.
The present study was carried out in two distinct steps:
I. The field study to collect the samples of groundwater and to assess its quality
through laboratory studies.
II. Data analysis and preparation of the thematic maps and development of
specific groundwater management tools.
3.1 WORK PLAN
To achieve the objectives of the study the following work plan was adopted:
1. Field study to mark the spatial location of groundwater structures in the study
area
2. Laboratory studies to prepare and update the database with respect to various
geochemical quality parameters of the groundwater in the study area
3. Development of the hydro-geological database of the area of study
20. 12
4. Analysis of the data and development of spatial and temporal maps/models in
a GIS environment
5. Validation of models and development of the groundwater management tools.
The following sections indicate methodology followed in the study: development of
thematic maps, sample collection and laboratory analysis to assess the groundwater
quality, preparation of subsurface lithological profiles and development to specific
groundwater management tools used on the data analysis.
3.2 GIS BASED MAPPING OF THE STUDY AREA
The base maps of the study area were prepared using Survey of India‟s (SOI) topographic
sheet Nos 53A7, 53A12, 53A16, 53 B9 and 53 B13 of 1:50,000 scale using the index
map shown in Map 1, secondary data collected from the various departments, GPS based
spatial data and the attribute data collected from the field work.
The following basic rationales were applied on fixing up the boundaries of the study area:
(i) State Boundary: Wherever the Himachal Pradesh state boundary
interceded, the boundary of the study area was limited to the State
Boundary. The study area map highlighting the state boundary is shown in
Map 2.
(ii) Drainage Pattern: The study area was aligned in the direction of the
predominant drainage areas in accordance with the basic objectives of the
study. Map 3 and Map 4 show the map of the study areas indicating the
prominent drainage pattern.
(iii) Topography: Similar to drainage pattern, the slope and gradient of the
area was considered for deciding the boundaries of the study area.
(iv) Location of the Industries: In order to understand the impact of
industries on the groundwater of the region, the density of the industries
was considered to fix the extent of the study area in the industrial belts in
the Una and Solan districts. Map 5 and Map 6 depict the industries
identified to have possible impacts on the ground water aquifers in the
study area.
27. 19
(v) Location of water bodies: As the water bodies impose natural limitations
to the flow of water/subsurface water, the boundaries fixed according to
the water bodies.
3.2.1 GEO-SAPTIAL SETTING OF THE STUDY AREA
The total area of the study area is reckoned as
UNA - 58.73 km2
Baddi Barotiwala - 134.00 km2
The areas are bound by the geographical setting of
UNA: 760
15‟ 15” E to 760
22‟ 0” E and 310
26‟ 1” N to 310
18‟ 11” N
Baddi- Barotiwala: 760
38‟ 50” E to 760
53‟ 32” E and 310
5‟ 35” N to 300
52‟ 0” N
3.2.2 LOCATION OF INDUSTRIES (POSSIBLE SOURCES OF
CONTAMINATION)
Both the areas are predominantly industrial in nature with major types of industries
classified as Iron and Steel industries, Aluminum industries, Chemical units,
Pharmaceutical companies, Rubber and Plastics, Textile and Polymer and Soap and
Cosmetics units. The industries which are potential contamination sources are mapped
and are placed at Map 5 and Map 6. The details of the industries are presented in
Appendix 1.
3.2.3 GEOREFRENCING OF TUBEWELLS
A survey was conducted to identify and locate the tube wells both deep and shallow in
the study area. The location of tube wells was recorded using GPS 72H (Garmin, USA).
3.2.4 GEOLOGICAL AN D GEOMORPHOLOGICAL MAPS
The geological maps of the study area, Baddi-Barotiwala and Una are attached at Map 7
and Map 8, respectively. The geomorphological maps of the study areas are presented at
Map 9 and Map 10.
3.2.5 LAND USE AND LAND COVER
Land use / land cover map of the study area on 1:250,000 scale (Maps 11 and 12) was
prepared using NRC LISS IV data (procured by the H.P IPH)
34. 26
3.3 WATER QUALITY MAPPING
3.3.1 BASELINE DATA
There is no common database generation or management practices with respect to
groundwater on one platform is available in the study area (i.e., some of the tube wells
are owned / managed by HP IPH, some are owned by industries department and some are
privately owned) . The H.P IPH, Central Ground Water Board (CGWB), CPCB and
HPPCB had taken some initiative of analyzing the groundwater quality of the region. The
historical data so available for the base years were used as base line data.
3.3.2 IDENTIFICATION OF THE TUBE WELLS and PARAMETERS FOR
MONITORING
In this study, based on the spatial analysis of the base line data, it was decided to monitor
06 tube wells in Una and 12 in Baddi Barotiwala. The tube well locations in both the
areas are shown in Maps 13 and Map 14. The tube wells were so chosen that the wells
should be representative and should meet the objectives of the study. Later, in the second
phase of the study some additional shallow tube wells were dug to meet the requirements
of the specific objectives of the study. The possible parameters of importance were
decided based on the type and density of the industries in the vicinity of the tube wells.
The list of the parameters is shown in table 3.1. In the second phase of the study, during
extended period 6 shallow tube wells each were dug and monitored from both the
industrial areas (study areas).
3.3.3 UPDATION OF DATA THROUGH COLLECTION AND ANALYSIS OF
THE GROUNDWATER SAMPLES
As per the agreement of the project the H.P IPH Department collected the samples from
the identified wells and analysed it at its own laboratory at Mandi (HP), P.H. Lab Una
H.P. Some of the major parameters especially the heavy metals were got analysed from
third party NABL accredited laboratory (Eco Laboratories and Consultants Pvt Limited,
Mohali).
The test methods, detection limits and standards are presented in table 3.1.
37. 29
Table 3.1 Test method and Standards
S.No Test Parameters Test Method Requirements as per IS:
10500-1991
Desirable
Limits
In absence of
Alternate
Source
1. pH value IS: 3025(P-11) 1983 R-2002 6.5 to 8.5 No relaxation
2. Total Hardness (as
CaCO3)
IS: 3025(P-521) 1983 R-2002
Ad. 1
Max 300 Max 600
3. Conductivity IS: 3025(P-14) 1984 R-2002 --- ---
4. Chloride (as Cl) IS: 3025(P-32) 1988 R-1999 Max 250 Max 100
5. Sulphate (as SO4) IS: 3025(P-24) 1986 R 1998 Max 200 400 (Sec col7)
6. Manganese (as Mn) IS: 3025(P-59): 2006
(DL= 0.05 mg/l)
Max 0.1 0.3
7. Nitrate (as NO3) IS: 3025 (P-34)1988 R 1999
(DL= 0.1 mg/l)
Max 45 100
8. Iron (as Fe) IS: 3025(P-53): 2003 Max 0.3 Max 1.0
9. Alkalinity, Max. APHA 21st
ED 2005-2320 B Max 200 600
10. Acidity IS: 3025(P-22) 1986 R-2002 --- ---
11. Turbidity IS: 3025(P-10) 1984 R-2002 Max 5 Max 10
12. Dissolved Solids IS: 3025(P-53) 2003 Max 0.3 Max 1.0
13. Fluoride (as F) APHA-21st
ED. 2005-4500 D Max 1.0 1.5
14. Mercury (as Hg) APHA- 3112B- 21st
ED.2005
DL= 0.001 mg/l
Max 0.001 No relaxation
15. Cadmium (as Cd) IS: 3025(Part 41) 1992 R 1998
DL= 0.008 mg/l
Max 0.01 No relaxation
16. Cyanide (as CN) IS: 302(Part 27): 1986
DL= 0.01 mg/l
Max 0.05 No relaxation
17. Lead (as Pb) APHA- 21st
ED.2005-
3111BA-AC
DL= 0.02 mg/l
Max 0.05 No relaxation
18. Zinc (as Zn) IS: 3025 (P-49) 1994 R 1999
Amnd. 1
DL= 0.02 mg/l
Max 5 15
19. Copper (as Cu) APHA- 21st
ED.2005- 3111B
DL= 0.02 mg/l
Max 0.05 1.5
20. Chromium (as Cr) APHA- 21st
ED.2005- 3111B
DL= 0.02 mg/l
Max 0.05 No relaxation
21. Coliforms IS: 1622-1981 R 2003 Max 10 ---
22. Feacal Coliforms IS:1622-1981 R 2003 --- ---
38. 30
3.3.4 SPATIAL DISTRIBUTION OF QUALITY OF WATER:
The GIS based analysis of spatio-temporal behaviour of the groundwater quality in the
study area was done using the Geostatistical Analyst module of ArcGIS 9.3 (ESRI,
USA). The interpolation technique used in the analysis is inverse distance weighted
(IDW) method. IDW is an algorithm for spatially interpolating, or estimating values
between measurements. Each value estimated in an IDW interpolation is a weighted
average of the surrounding sample points. Weights are computed by taking the inverse of
the distance from an observation‟s location to the location of the point being estimated.
The variation of each geochemical parameter is plotted taking into consideration the
minimum and maximum value of each parameter as well as permissible limits as per
standards. The spatial maps are prepared for base line data as well as current data.
3.3.5 PREPARATION OF LITHOLOGICAL MAPS OF STUDY AREA
Litho logical strata charts of the tube wells falling in the study area and its vicinity have
been collected from the client department (H.P IPH). The lithological data is interpreted
from samples collected at the time of drilling and electric logging which uses the
resistivity methods. The subsurface data was transferred in the Excel sheet and was
imported in the RockWorks14 (RockWare Inc., USA) software package for geological
data management, analysis, and visualization. It offers tools for modeling, image
creation, and report generation. The specific tool of Rockware software to link with
ArcGIS is used so that the work can be done in ArcGIS 9.3 window with RockWorks14
as a special tool.
The layer-wise lithological database of each tube well is prepared and the database file so
prepared is run on the Software for the generation of subsurface lithological model of the
study area. In order to bring more clarity to the subsurface lithology of the area, the
sections are selected in the direction of flow and in its perpendicular.
3.3.6 VULNERABILITY / POLLUTION POTENTIAL
A DRASTIC model applied in a GIS environment was used to evaluate the vulnerability
of the shallow groundwater of study area. The DRASTIC model was developed by the
US Environmental Protection Agency (EPA) to evaluate groundwater pollution potential
for the entire United States. It was based on the concept of the hydro-geological setting
that is defined as a composite description of all the major geologic and hydrologic factors
39. 31
that affect and control the groundwater movement into, through and out of an area (Aller
et al. 1987). The acronym DRASTIC stands for the seven parameters used in the model
which are: depth to water, net recharge, aquifer media, soil media, topography, impact of
vadose zone and hydraulic conductivity (Table 5.8). The model yields a numerical index
that is derived from ratings and weights assigned to the seven model parameters. The
DRASTIC Index is then computed applying a linear combination of all factors according
to the following equation:
Drastic Index = Dr Dw + Rr Rw + Ar Aw + Sr Sw + Tr Tw + Ir Iw + Cr Cw = Pollution
Potential
Where D, R, A, S, T, I, C represent the seven hydrogeologic factors, r is the notation for
rating value (1–10) and w is the weight value for a given parameter (1–5), which are
given below in tabular format (Table 5.8). The resulting DRASTIC index was calculated
for each location and plotted using ArcGIS 9.3 (ESRI, USA).
Table 3.2: Assigned weights for calculating ‘DRASTIC INDEX’
Feature Weight
Depth to water table 5
Net Recharge 4
Aquifer Media 3
Soil Media 2
Topography 1
Impact of Vadose Zone 5
Hydraulic Conductivity of the Aquifer 5
Table 3.3 Ranges and ratings for depth to water table
Range in meters Rating
0-1.5 10
1.5.-4.5 9
4.5-9.1 7
9.1-15.2 5
15.2-22.9 3
22.9-30.5 2
>30.5 1
40. 32
Table 3.4 Ranges and ratings for aquifer media
Range Weight
Massive Shale 2
Metamorphic/Igneous 3
Weathered Metamorphic/Igneous 4
Thin Bedded Sandstone, Limestone Shale
Sequences
6
Massive Sandstone 6
Massive Limestone 6
Sand and Gravel 8
Basalt 9
Karst Limestone 10
Table 3.5 Ranges and ratings for soil media
Range Rating
Thin or Absent 10
Gravel 10
Sand 9
Peat 8
Shrinking and /or Aggregated Clay 7
Sandy Loam 6
Loam 5
Silty Loam 4
Clay Loam 3
Muck 2
Non-shrinking and Non-aggregated Clay 1
Table 3.6 Ranges and ratings for topography (percent slope)
Range Rating
0-2 10
2-6 9
6-12 5
12-18 3
18+ 1
41. 33
Table 3.7 Ranges and ratings for impact of Vadose Zone Media
Range Rating
Silt/Clay 1
Shale 3
Limestone 6
Sandstone 6
Bedded Limestone, Sandstone, Shale 6
Sand and Gravel with significant Silt and
Clay
6
Metamorphic / Igneous 4
Sand and Gravel 8
Basalt 9
Karst Limestone 10
Table 3.8 Ranges and ratings for K Value
Range Rating
0.05-0.5 1
0.5-1.5 2
1.5-3.5 4
3.5.-5 6
5-10 8
>10 10
Table 3.9 Ranges and ratings for net recharge
Range in mm Rating
0-50.8 1
50.8-101.6 3
101.6-177.8 6
177.8-254.0 8
>254.0 9
42. 34
CHAPTER-4
RESULTS AND DISCUSSION
4.0 GENERAL
The major thrust of the study was to improve the status of the groundwater management
system vis-a-vis the groundwater quality data base management in the wake of rapid
industrialization in the study area. To meet the challenges in the complexity and diversity
of the data base with regard to groundwater quality GIS based data base management and
modeling approach was used. This section deals with the variation in the groundwater
quality with respect to space and time. Maps showing the spatial and temporal variation
in groundwater quality are presented. The results are presented for both base line data and
updated data generated as part of the study. In the extended period of the study specific
attention was paid to understand the groundwater quality changes with respect to pre and
post monsoon period. Also, efforts were made to study the possible impact of
industrialization in groundwater quality by drawing samples from the specific shallow
wells dug in the study area.
4.1 ANALYSIS BASED ON THE HISTORICAL / BASELINE DATA
The available historical data collected from HPIPH, HPPCB, CGWB and CPCB were
analysed and the information is presented in figure 4.1 to 4.10. Based on this analysis and
the possible contaminants originated from the industries in the vicinity the parameters for
the further study were decided.
4.2 SPATIAL VARIATION IN DEEP TUBE WELLS IN 2012
This section deals with the spatial variation in quality parameters such as pH, TH,
Conductivity, Cl, SO4, Mn, NO3, Fe, Alkalinity, Acidity, Turbidity, Dissolved Solids, F,
Hg, Cd, CN, Pb, Zn, Cu, Cr, Coliforms and Faecal Coliform. The specific test results of
all the samples for all the parameters are attached as Appendix 2. The spatial variation in
the above water quality parameters for both the study areas is depicted in figure 4.11 to
4.39.
From the figures it can be seen that the deep tube well samples analyzed in 2012, in
Baddi area the alkalinity and chloride exceed the permissible limit about 5% of the total
area. The heavy metal concentration in the entire area was less than the permissible limit
except lead which is found to be slightly more than the permissible limit in the Kalu
43. 35
Jhanda area, which was dominated by leather industries. In the Una area almost all the
parameters were with in the permissible limits except alkalinity and chloride which were
found to be exceeding permissible limit in about 2-3% of the total area. However, it was
concluded that the perceptible change in the quality of the groundwater could not be
observed due to the fact that the samples were drawn from deep tube wells and where the
impact of the industrial effluent could be possibly less. Therefore it was suggested after
this phase of the study that in order to achieve the specific objectives of the study,
samples should be drawn from shallow tube wells where the possible impact of industrial
effluent may be significant.
Figure 4.1 Figure 4.2
Figure 4.3 Figure 4.4
Figure 4.5 Figure 4.6
52. 44
4.3 SPATIAL VARIATION IN DEEP TUBE WELLS IN 2013
4.3.1 Pre - Monsoon
Figures 4.40 to 4.63 show the spatial variation of the various quality parameters in deep
tube wells during the pre-monsoon period. The figures indicate that quality attributes in
deep tube wells did not show significant variation from the results of 2012. Both in Una
and Baddi-Barotiwala, the iron concentration is found to be exceeding the permissible
limit, possibly due to the presence of iron and steel industry or metal working industries
effluent. However, the additional parameters like of TOC or COD did figure in some of
the tube wells especially at locations close to industries where such organic pollution is
anticipated. Therefore, it was decided that such a parameter may be continued to be
monitored in the subsequent samplings. Concentration of some heavy metals like Lead,
Zinc, Chromium, Cadmium etc., although was observed in few tube wells, no meaningful
conclusions could be drawn due to paucity of data. However, the continued monitoring of
these wells and analysis of data would provide more insights into this observation
4.3.2 Post - Monsoon
The results of spatial mapping of the variation of various water quality parameters in
deep tube wells for the post – monsoon are shown in figures 4.64 to 4.85.
4.3.3 VARIATION IN THE CONCENTRATION OF THE PARAMETERS IN
DEEP TUBE WELLS OF PRE AND POST MONSOON 2013
Comparison of the changes in groundwater quality parameters with in pre and post
monsoon is attempted in this section. Figures 4.86 to 4.89 present the temporal change in
the groundwater quality in deep tube wells in the study area. The changes in water quality
parameters with respect to space as indicated therein show that there is variation in the
concentration of some of the parameters between pre – monsoon and post – monsoon
(alkalinity, iron, hardness etc). The concentration of most of the parameters reduced in
post – monsoon.
111. 103
4.4 SPATIAL VARIATION IN SHALLOW TUBE WELLS IN 2013
4.4.1 Pre - Monsoon
In the extended phase of the study special attention was made to understand the spatial
variation in the quality of groundwater in the top aquifers (Shallow wells). Figures 4.98
to 4.122 Show the spatial variation in the quality parameters in the shallow tube wells.
Most of the parameters showed a trend below the permissible limits. However, the
additional parameters like of TOC or COD did figure in some of the tube wells especially
at locations close to industries where such organic pollution is anticipated. Therefore, it
was decided that such a parameter may be continued to be monitored in the subsequent
samplings. Concentration of some heavy metals like Lead, Zinc, Chromium, Cadmium
etc., although was observed in few tube wells, no meaningful conclusions could be drawn
due to paucity of data. However, the continued monitoring of these wells and analysis of
data would provide more insights into this observation
4.4.2 Post - Monsoon
The figures 4.123 to 4.148 depict the spatial variation in the quality of groundwater in
shallow wells in the post monsoon period.
4.4.3 VARIATION IN THE CONCENTRATION OF THE PARAMETERS IN
SHALLOW TUBE WELLS OF PRE AND POST MONSOON 2013
Comparison of the changes in groundwater quality parameters with in pre and post
monsoon is attempted in this section. Figures 4.149 to 4.172 present the temporal change
in the groundwater quality in shallow tube wells in the study area. The changes in water
quality parameters with respect to space as indicated therein show that there is variation
in the concentration of some of the parameters between pre – monsoon and post –
monsoon (alkalinity, iron, hardness etc). The concentration of most of the parameters
reduced in post – monsoon.
187. 179
4.5 MAJOR ION CONCENTRATION
The major ion concentration of the groundwater chemical quality was evaluated using the
trilinear diagram (piper diagram). The data derived from the groundwater quality analysis
of the study areas were used for making the piper diagram. Figures 4.173 and 4.174.
depict the piper diagram for Una and Baddi and Barotiwala areas of the study,
respectively. Geochemical facies evaluation of the groundwater indicated that most of the
samples, both from shallow and deep wells, are of the Ca-Mg-HCO3 type.
Figure 4.173 Piper diagram (Una)
188. 180
Figure 4.174 Piper diagram (Baddi)
4.6 LITHOLOGICAL MODEL
Figures 4.175 and 4.178 indicate the lithological model of the study areas using the
procedure demonstrated in section 3.3.5. The cross section so derived will be of use in
predicting the lithological profile of the wells and in identifying the lithologically ideal
locations for well construction.
191. 183
4.7 GROUNDWATER VULNERABILITY
Vulnerability/pollution potential is an estimate of the potential threat of the groundwater
to pollution. The approach used is to prepare a pollution potential index based on the
topography, drainage pattern and lithological profile of the region. Using the thematic
maps of the region, the final vulnerability map was prepared by running the DRASTIC
model in the GIS environment by superimposing the seven hydro-geological layers.
Figures 4.179 & 4.180 show the vulnerability maps for the study areas. The Drastic
Indices obtained from the model varied largely from 100 to 160. The study areas were
divided into less vulnerable (less than 100), moderately vulnerable (100 – 150) and
highly vulnerable (more than 150) with respect to groundwater pollution. In Una region,
the highly vulnerable area was estimated to be around 10 – 15%; whereas in Baddi-
Barotiwala the percentage area falling under highly vulnerable category was about 80 -
85%. Incidentally, under the natural conditions, the high and moderate groundwater
vulnerability zones are mainly located in the groundwater recharge zones. This map
would help in identifying the vulnerable areas in the region and would provide a
management tool in deciding the location of groundwater extraction structures and
potential pollution threat in decision making with respect to groundwater management.
194. 186
CHAPTER-5
CONCLUSIONS AND RECOMMENDATIONS
5.1 SUMMARY AND CONCLUSIONS
The project was undertaken as part of Hydrology Project – II (HP – II) with an objective
to improve and develop an integrated and comprehensive hydrological data collection
and database management system for improved productivity and cost effectiveness of
water related investments in Himachal Pradesh. The specific objective of the study was to
assess the characteristics of groundwater in industrially predominant areas of Himachal
Pradesh. The major industrial areas in the state of Himachal Pradesh viz Baddi-
Barotiwala in Solan district and Tahliwal- Mehatpur falling in Una District were
considered for the study. The water quality data from the baseline data and data collected
as part of this study were used for preparing the GIS based information system for
groundwater management in the region. Based on the analysis of the data and
observations, the following specific conclusions are drawn:
There is an urgent need to improve the groundwater management system in
Himachal Pradesh especially in the industrially predominant areas.
GIS based information system for groundwater management is useful in dealing
with diverse and complex data base of groundwater quality
The quality of the groundwater in the study area varied both spatially and
temporarily (Pre monsoon and Post monsoon)
Although it is intuitive that the industrial effluents affect the groundwater quality,
no substantiative proof to this effect could be derived from this study based on the
deep tube well water quality studies.
Although the transport of the pollutants / contaminants from the industrial
effluents to the aquifers as hypothesised could not be established based on the
water quality assessment done in the deep aquifers, the results indicated
deteriorating trend in the groundwater quality in the region.
The water quality of the shallow wells was found to be inferior to that of deep
wells.
The lihtological models developed from the log data of the study area would be
useful in groundwater management decision making
195. 187
Geochemical facies evaluation indicated that the groundwater of the study area is
of Ca-Mg-HCO3 type
The vulnerability assessment of the study area using DRASTIC indices indicated
that both the studies areas are vulnerable to contamination of groundwater. In Una
region, the highly vulnerable area was estimated to be around 10 – 15%; whereas
in Baddi-Barotiwala the percentage area falling under highly vulnerable category
was about 80 - 85%.
The methodology proposed here in presents a simple GIS based information
system to deal with the data base of continuous monitoring of groundwater system.
This information system could also be used for the impact assessment of
industrial activities and policy decisions on groundwater management.
5.2 RECOMMENDATIONS
The following recommendations are made based on the present study:
Continuous monitoring of the observation wells in the industrially predominant
areas of the Himachal Pradesh is essential to understand the impact of the
industries in the vicinity on the groundwater quality
A GIS based information system for groundwater management is essential to be
established in the industrially predominant areas of the Himachal Pradesh. Data
on a continuous basis to be input to this information system so as to regularly
asses the spatial and temporal changes in the groundwater quality in the area
Although the impact of the industrial pollutants or contaminants on the
groundwater quality is intuitive no clear correlation could be established as part
of this study. A study and modeling of pollutant transport in the geographical
region is required to establish a clear correlation or „cause – effect‟ relationship
In this study, the groundwater quality was assessed based on the drinking water
quality parameters. However, a long term study tracking the specific parameters
identified to be originated from the industry(s) under consideration should be
taken up to establish the „cause – effect‟ relationship (e.g., the monitoring of
TOC, COD etc as proposed in the later part of the study).
Since the study areas receives high average annual rainfall, it is recommended
that rainwater harvesting may be adopted as a mandatory requirement in all the
industries / buildings in the region
196. 188
The development of the groundwater resources in the region should be carried out
in a controlled and phased manner. The fluctuations in the water level and quality
changes may have to be continuously monitored and the management of the
groundwater in the region may be carried out by a single agency / department
The monitoring and management of the industrial effluents emanate from the
region should be carried out and effluent treatment should be made mandatory for
all the industries
197. 189
REFERENCES
Aguuilar, J. B, Orban P, Dassargues, A, and Brouyere, S , Identification of
groundwater quality trends in a chalk aquifer threatened by intensive agriculture
in Belgium., Journal of Hydrogeology, V 15(2), pp1615-1627, 2007
Al-Adamat, A.R.N Foster, I.D.L and Baban, SMJ, Groundwater vulnerability and
riskmapping for the Balastic auifer of the Azraq basin of Jordan using GIS ,
Remote sensing and DRASTIC, Applied Geography, V 23 (3) , pp 303-324, 2003.
Aller, L , Bennet, T Lehar J H, Petty, R.J and Hackett G , DRASTIC a
standardized system for evaluation groundwater pollution potential using
hydrogeological settings, EPA 600/2/87/035: 625, 1987
CGWB, Groundwater Information Booklet, Una District, Himachal Pradesh, 2007
CGWB, Groundwater Information Booklet, Solan District, Himachal Pradesh,
2007
CGWB, Groundwater year Book Himachal Pradesh (2007-2008)
CGWB, Groundwater Management Studies Una District, Himachal Pradesh
(Reapprisal Hydrogeologcal Survey, AAP 2006-2007)
CGWB, Aquifer System of Himachal Pradesh, 2012
CPCB, Status of water quality in India, 2010
Rajesh Bansal, L. N. Sharma and Siby John, Analysis, Assessment and Mapping
of Groundwater Quality of Chandigarh (India), Journal. of Environmental Science
and Engg., V 53(2), pp 157-162, April 2011
Rajesh Bansal, L. N. Sharma and Siby John, Groundwater Pollution Risk
Mapping of Chandigarh in Ghaggar Basin, 23rd
Indian Engineering Congress,
IEI, Warangal, 11-14 December, 2008
198. 190
Siby John, L.N.Sharma, Rajesh Bansal, Groundwater quality assessment and
mapping for Chandigarh (India), Proc. Int. Conf ASCE-EWRI India, IIT Madras,
India, 2010
Siby John, L.N.Sharma, Rajesh Bansal “GIS Based Modeling of Geo-chemical
quality of Groundwater in Chandigarh”, Int. Symposium, “Geospatial Databases
for Sustainable Development”, Goa, Sept 27-30, , pp 36, 2006