Hydrographic echo sounders are used to measure the depth to the seafloor by using the properties of acoustic waves. The principle of echo-sounders is basic - by measuring the two-way travel time between the acoustic waves transmitted on sea surface and those reflected at seafloor.
In this study, an integrated approach for hydrographic surveying is introduced and evaluated in terms of its efficiency in comparison with the traditional methods of hydrographic surveying. The approach develops an integrated environment of hydrographic surveying comprising human, hardware and software. The process of surveying starts from in-house planning using specialized geo-spatial softwares. Then, on site a combination of computer hardware, echosounder, differential global positioning system (DGPS), survey vessel and survey crew is made. Post-processing is performed after conducting a survey in order to improve quality of data by filtering errors and producing the end product like reservoir underwater terrain, development of reservoir stage-area and stage-storage relationships, etc. The study was applied to Tarbela Reservoir, Pakistan.
Sediment deposition in koyna reservoir by integrated bathymetric surveyeSAT Journals
Abstract In southern part of India, most of the precipitation occurs due to south-west monsoon during the months of June to September. Storage reservoirs are constructed to store the run-off volume and utilize it for long term requirements in the command such as irrigation, power generation, domestic water supply etc. The sediment deposition in the reservoir is a continuous and complex process. Sediment in a river which originates from the land erosion process in the catchment is propagated along with the river flow and finally gets deposited in the reservoir. This has adverse effect such as reduction in storage capacity and increase in backwater levels. For the long term and yearly planning of efficient utilization of reservoir capacity, estimation of sediment deposit is not only sufficient but also estimation of trapped sediment at different levels in the reservoir is required. Differential Global Positioning System (DGPS) based Integrated Bathymetric Survey System for hydrographic survey is used for estimation of sediment deposition pattern in the Koyna reservoir. In this method three or more satellite based GPS receivers are used in differential mode for positioning. Ecosounder is used for depth measurements. GPS reference receiver is located at a known latitude and longitude position and GPS mobile receiver is located on the survey boat. Both the GPS operate in differential mode through a communication link. From this study (2004) it is observed that sedimentation rate in Koyna reservoir is more than 6.5 Ham/100 sq.km/year anticipated in 1949. Key Words: reservoir, sedimentation, Bathymetric Survey, hydrographic, GPS
The document provides details of the DSS project in Kerala including:
1) Expenditure and funding amounts for the project from 2006-2014.
2) Components of the project including institutional strengthening, awareness programs, implementation support, hydrological studies, and decision support systems.
3) Financial details of investment and recurrent costs for each component from 2006-2014.
4) Achievements of the project including upgrading hydrological stations, training programs, studies conducted in the Bharathapuzha river basin using modeling tools, and establishing a DSS network.
5) Future requirements including training in new modeling software, exhaustive training in the DSS software, modeling of other basins
This document provides a summary of the financial progress and achievements of the Gujarat - Ground Water hydrology project. Some key points:
- Total projected cost is 176.32 crore INR, of which 169.11 crore (96%) has been spent as of March 2014.
- Major activities include upgrading the piezometer network, procuring equipment like DWLRs, GIS data, and training programs.
- Key outcomes are improved groundwater data availability and monitoring networks, as well as awareness raising and decision support systems.
- Lessons learned include the importance of data quality control, coordination, and training to improve groundwater management.
Since the recent development of UAVs(Unmanned Aerial Vehicles) and digital sensors technology has enabled the acquisition of high-resolution image data, it is considered that the image data of riverside can be analysed. Therefore, this study analyses the applicability of remote sensing techniques through image analysis in river systems and habitats. The target stream in this study was the Cheongmi stream and the applicability of the river environmental evaluation technique was analysed through image analysis. The satellite images used for the analysis of river topography and environments were compared with the aerial images taken by a micro UAV), and the river environmental evaluation was carried out with the field research at the same time. The data acquisition range and application limit by river environmental evaluation technique proposed previously were evaluated, and as a result, it was found that it was possible to draw various evaluation parameters using a drone that could take an image at a low altitude in comparison to satellite images.
This work report summarizes Amaljit Bharali's contributions in 2016 related to water resources, hydrology, and flood modelling in Northeast India. Major contributions included operational work on a Flood Early Warning System including hydrological modelling. Other work included database development, field surveys, and training. Research activities included urban flood modelling in Shillong and hydraulic modelling of flood prone rivers. Publications and conferences were also listed.
7 - AECOM Water Resources Seminar World Bank -16-Septindiawrm
The document discusses AECOM's work on rehabilitating the Pattamundai Canal System in Odisha, India. It overviews AECOM's scope of work, which included surveys, design, drawings and cost estimates. It describes the canal system and key challenges including lack of data on the old system. AECOM's methodology involved condition surveys, GIS mapping, designs for canal modifications and new structures, and contract documents. The process included surveys, investigation, planning, design, quantities and cost estimation, and completion documents.
The document discusses the importance of spatial data integrity in oil and gas exploration. It provides examples of how failures in spatial data integrity, such as using incorrect coordinate reference systems, can lead to significant costs and issues. Spatial data is critical in exploration activities from seismic surveying and well positioning to infrastructure construction. The case study of the SIS A #1 gas discovery in South Sesulu, Indonesia illustrates how maintaining spatial data integrity from the beginning of exploration played a role in the project's success.
1) Marine surveys in 2008 and 2012 found that the seabed between two offshore platforms in the Ujung Pangkah field is subject to frequent mudflows and sediment deposition. This helped explain a 2011 gas pipeline rupture.
2) Geomatics techniques including GIS and satellite imagery helped locate and monitor a buried gas pipeline segment undergoing nearby construction activities.
3) Maintaining pipeline integrity requires understanding seabed conditions and monitoring activities near pipelines. Geomatics practices provided data supporting pipeline design, maintenance, and integrity for the Ujung Pangkah field.
MORPHOMETRIC ANALYSIS OF SUKE SUB-WATERSHED OF TAWA RESERVOIR CATCHMENT AREA ...Journal For Research
The study area covers 732.95 Km2 in suke sub-watershed of Tawa reservoir catchment area of Hoshangabad, Bhopal (M.P.). the drainage network of suke sub watershed and measurement of Linear, Aereal and Relief aspects of basin by digitized using remote sensing and GIS techniques. The drainage network shows that the terrain exhibits dendritic drainage pattern. Stream order ranges from one to sixth order. The drainage density in the area 2.06km/km.2 belong to moderate category.Stream frequency in the area 2.82 and texture ratio 4.08 is range to belong moderate condition. The form factor indicate the sub watershed are less elongated in shape. The high value of circulatory ration the sub watershed is characterize by high to moderate relief and drainage system structurally controlled but the study area Rc is less than .50 indicating they are less elongated in shape.
The document summarizes the Tamilnadu Hydrology Project-II. It provides details on achievements of the project including institutional strengthening through equipment procurement and capacity building. It discusses the development of decision support systems in 3 basins, including setting up hydrological models. Challenges faced and plans for utilizing outputs post-project are also outlined. Financial status and plans for utilizing the remaining budget are presented.
Sediment Assessment of UJJANI Reservoir in Maharashtra by using Remote Sensin...IRJET Journal
This document summarizes a study that uses remote sensing to assess sedimentation in the Ujjani Reservoir in Maharashtra, India. Landsat satellite imagery from 2001-2002 was analyzed using NDWI to identify water pixels and calculate changing water spread areas over time. This allowed the researchers to generate a revised capacity-elevation curve and estimate total sedimentation in the reservoir over 34 years was about 207.822 cubic meters, at a rate of 6.65 hectare-meters per 100 square kilometers per year. Remote sensing provided a more efficient approach than traditional surveys to periodically evaluate sedimentation and inform management of the reservoir's longevity.
This document discusses groundwater usage and management in India. It notes that groundwater provides 38% of India's total usable water resources and is critical for irrigation, rural drinking water, and urban water supply. However, over 60% of assessment units have been designated as overexploited, and groundwater levels are declining in many areas. The Central Ground Water Board's new scheme aims to shift from groundwater development to management through comprehensive aquifer mapping, formulation of aquifer management plans, capacity building, and regulation. Key goals are improving data accuracy, managing aquifers at the local level through participation, and achieving water security and sustainability. Major initiatives include the National Aquifer Mapping project and participatory groundwater management programs.
The Development of a Catchment Management Modelling System for the Googong Re...GavanThomas
A scenario assessment model to assist the end-user in determining priorities for a series of agreed management prescriptions that can be enacted through controls on existing landuse
The document summarizes the Ocean Data and Information System (ODIS) developed by the Indian National Centre for Ocean Information Services. ODIS integrates heterogeneous ocean data from various observing systems into a centralized database to provide web-based data and information services. It receives over 5 terabytes of real-time data annually from in situ platforms like Argo floats and remote sensing satellites. The data goes through quality control before being loaded into the database. ODIS then makes this quality controlled data available through various web-based services like potential fishing zone advisories and ocean state forecasts using interactive maps and other visualization tools. These services provide ocean data, forecasts and advisories to users in multiple languages.
IRJET - Remote Sensing, GIS and Geophysical Techniques to Find Suitable Sites...IRJET Journal
This document discusses using remote sensing, GIS, and geophysical techniques to identify suitable sites for rainwater harvesting structures in the hard rock terrain of Talbehat block in Lalitpur district, Uttar Pradesh, India. Vertical electrical sounding (VES) was conducted at field locations to create maps of overburden thickness, aquifer thickness, and hard rock depth. These maps along with land use/cover, drainage, geomorphology, and other thematic layers were overlaid in GIS to produce a groundwater prospects map identifying potential sites for rainwater harvesting structures like nala bunds, check dams, and percolation tanks. The study aims to enhance groundwater availability and utilization of rainfall for sustainable
IRJET - Physico-Chemical Analysis of Ground Water of Bhathat Block of Gorakhp...IRJET Journal
This document analyzes the physicochemical properties of groundwater samples collected from 13 locations in the Bhathat Block of Gorakhpur District, India. The parameters tested include pH, electrical conductivity, total dissolved solids, total hardness, calcium, magnesium, nitrate, and fluoride. Geographic Information Systems (GIS) techniques like inverse distance weighted interpolation were used to map the spatial distribution of water quality. The water quality index was calculated to evaluate the overall quality of water. Most parameters were within acceptable limits according to BIS standards, though some locations had higher levels of nitrates and fluorides. The study aims to assess groundwater quality in the region and identify polluted areas to enable remedial measures.
Application of Swat Model for Generating Surface Runoff and Estimation of Wat...IRJET Journal
This document describes using the SWAT hydrological model to simulate rainfall-runoff and estimate water availability in the 800 sqkm Balehonnur catchment of the Badra River basin in India. Various data inputs were used, including DEM, land use, soil, and temperature and precipitation. The model was calibrated for 1995-2010 and validated for 2011-2015, achieving R2 and NSE values of 0.878 and 0.78 for calibration and 0.869 and 0.75 for validation. Future water availability from 2021-2050 was estimated using climate change scenario data, though overestimation requires bias correction. The study aims to evaluate climate change impacts on water resources for planning.
DSD-SEA 2018 Software Application in Integrated Water Resources Management in...Deltares
Presentation by Mr. Irfan Sudono (Ministry of Public Works and Housing, Indonesia) at the Seminar Cutting Edge Hydro Software for South-East Asia, during the Deltares Software Days South-East Asia 2018. Thursday, 6 September 2018, Yogyakarta.
IRJET- Hydraulic Redesign and Analysis of Kotmara Dam: Kas River BasinIRJET Journal
This document summarizes a study that used GIS tools to redesign the Kotmara Dam on the Kas River in India. The study first delineated the dam's watershed area using topographic maps and QGIS software. Runoff was then estimated to determine the actual water storage available. The dam's design was analyzed and its hydraulic dimensions reassessed based on the updated watershed and runoff data. Three trial designs were modeled by increasing the dam height. All trials showed safety factors above minimum requirements, indicating the dam could safely hold more water if its height was increased. The study concluded QGIS provided a more accurate watershed delineation than manual methods. Redesigning the dam could improve its ability to meet water
The document summarizes efforts to upgrade India's hydrological information system through the Hydrology Project. Key aspects of the upgrade include standardizing data collection procedures, developing infrastructure like new observation stations, and establishing a comprehensive computerized database. Over 1,700 existing rainfall stations were reactivated or upgraded, 650 new river gauging stations were established, and 7,900 new groundwater observation wells were added. The upgraded system aims to provide reliable, accessible hydrological data to support improved water management across nine states in India covering 1.7 million square kilometers.
The document discusses operational remote sensing applications in India. It outlines the institutional mechanisms for natural resource management using remote sensing data from Indian Space Research Organization (ISRO) satellites. Some key applications discussed are natural resource inventories, land use/land cover mapping, agriculture monitoring, drought and flood assessment, and the FASAL program for multi-crop forecasting using remote sensing, agrometeorology and ground data. National level inventories are done at 180m, 60m and 24m resolutions with finer scales at state and district levels.
Comparison of Spatial Interpolation Techniques - A Case Study of Anantnag Di...IJMER
Groundwater is used for a variety of purposes, including irrigation, industrial, drinking, and
manufacturing. Assessment and mapping of quality of groundwater is an important because the physical
and chemical characteristics of groundwater determine its suitability for agricultural, industrial and
domestic usages. The present study area i.e, District Anantnag lies in southern part of Jammu and
Kashmir and is characterized by undulating topography, rugged mountains. The habitants of the study
area mainly depend on ground water resources viz; springs and tube wells. The present study attempts to
explore the best spatial interpolation technique that will best represent the actual ground water quality of
district anantnag. In the present study various maps representing various physio-chemcial properties of
ground water quality were generated using spatial interpolation techniques viz; Inverse Distance
Weighted (IDW) and Nearest Neighbor (NN). Out of total 92 ground water samples, 8 points were
preserved for cross validation between the two interpolation techniques using Root Mean Square Error
(RMSE) test. Finally it can be conclude that IDW is the most preferable technique for spatial
interpolation measurement of ground water quality data.
This document provides a compilation of experiences implementing irrigation efficiency programs in India. It discusses the growing dependence on groundwater irrigation, the associated impacts on water availability and energy use. Various state-led programs since the 1980s have aimed to improve pumping efficiency and promote conservation. The report categorizes programs into those focusing on pump-set efficiency upgrades and those promoting efficient water use through micro-irrigation, recharge structures. It aims to derive lessons from past experiences to improve future groundwater management and reduce energy and water stresses.
1. The document describes Maharashtra's real-time flood forecasting approach, which includes installing a real-time data acquisition system (RTDAS) across the Krishna and Bhima river basins to monitor rainfall, river levels, and reservoir levels and outflows.
2. The RTDAS network consists of 149 automated stations, including 127 rainfall stations. Installation of the network was completed with the exception of one reservoir station.
3. Hydrological and reservoir operation models are being developed using data from the RTDAS to provide real-time flood forecasts and optimize reservoir operations for flood management. The system is intended to help reduce flood impacts and losses in Maharashtra.
This document describes a methodology for real-time reservoir operation of the Hirakud reservoir in India. The goal is to minimize penalties from deviating from recommended reservoir levels, flows exceeding safe limits downstream, and changes in release rates. The operation will be done in two phases - a calibration phase to determine penalty parameters, and a validation phase. Three historic floods will be used in the calibration phase to evaluate different penalty structures and select the best-performing set of penalties based on reservoir levels, downstream flows, and duration of flood operation.
Reconnaissance for Hydrographic Survey ProjectNzar Braim
Reconnaissance for Hydrographic Survey Project
The system is able to withstand the harsh environment of the nearshore and acquire beach profile information across the surf zone. This paper describes the system and results of a comparison in Myrtle Beach, S.C., between surveys collected over a 3- day period by the personal watercraft system and by a similar system mounted aboard a traditional coastal survey vessel.
The bathymetric measurements for the personal watercraft-mounted echosounder surveying system display mean repetitive differences of 6 cm.
This workshop is an introductory course in Hydrographic surveying.
It is designed for surveyors, engineers, survey technicians, dredge operators, and hydrographers.
The course focuses on theoretical principles of hydrographic surveying, project description, operation, and map production.
Exaple of use of decision support system planning dss (p) kerala statehydrologyproject0
The document discusses various applications of decision support system (DSS) tools to model the Bharathapuzha river basin in Kerala, India. Ten applications are described, including conjunctive water use, artificial groundwater recharge, inter-sub basin water transfer, hydropower generation, reservoir operation, water quality management, and irrigation modeling. The DSS tools were used to develop optimal water resource management scenarios and evaluate project proposals, with some receiving government approval for implementation. An ambitious new project is underway to model 20 river basins across Kerala using DSS.
Delineation of irrigation infrastructural, potential and land useIAEME Publication
This study assessed irrigation infrastructure in Muzaffarnagar district, India using satellite imagery. The main canals are Tikri Branch, Nirpura Branch, and Kurthal Branch, with several minor canals branching off. Satellite imagery was used to measure canal lengths and compare to official data. Most canal lengths matched well, but Gadidbra minor was found to be shorter than officially reported. Irrigation potentials were also estimated and found to match closely with official data, except for Gadidbra minor which had lower potential than expected due to its shorter length. Land use/land cover of the study area was classified, finding agricultural land covers 48.64% of the total area.
2007 hassan and islam - application of GIS for drinking water - paper_108SM Tanvir Hassan
This document summarizes a study that used GIS tools to identify areas in Dinajpur district, Bangladesh where groundwater levels fell below critical levels for rural drinking water supply during dry seasons from 1995-2003. The study compared interpolation methods to model groundwater surfaces and found that kriging most accurately estimated depths at observation wells. Critical areas were defined as those where groundwater depths exceeded 6 meters. The maximum critical area (49.7% of the study area) occurred in 1995, causing severe drought. Some areas, like Dinajpur Sadar upazila, experienced drinking water scarcity for up to 120 days in 1999. The study helps identify locations requiring solutions to mitigate dry season drinking water shortages.
IRJET- Rainfall-Runoff Analysis of the Watershed for River AIEIRJET Journal
This document summarizes a study analyzing the rainfall-runoff relationship of the Aie River watershed in Bhutan using the Soil and Water Assessment Tool (SWAT) model. Key steps included delineating the watershed boundaries using ASTER DEM data, defining land use and soil types, acquiring meteorological data, running hydrologic simulations from 1995-2014, and analyzing the water balance. The SWAT model effectively simulated the rainfall-runoff dynamics in the ungauged watershed and provided insights into its hydrologic response to precipitation patterns.
This document discusses wastewater reuse and desalination options being considered by Umgeni Water to augment water supplies. It describes Umgeni Water's existing infrastructure for treating wastewater for industrial reuse. Two options - direct and indirect reuse - for treating wastewater from Darvill Wastewater Works to potable standards are discussed. Pilot plants are testing advanced treatment technologies. A desalination pre-feasibility study considered a 450Ml/day plant, but a revised strategy is examining 150Ml/day plants on the north and south coasts.
Demarcation of Ground Water Potential Zone of Kanpur CityIRJET Journal
This document describes a study that used remote sensing, GIS, and the analytical hierarchical process (AHP) to delineate groundwater potential zones in Kanpur City, India. Nine factors that influence groundwater occurrence and recharge - lithology, precipitation, geomorphology, slope, soil thickness, soil, land use/land cover, distance to rivers, and lineament density - were analyzed. Weights were assigned to the factors based on their relative importance using AHP. The weighted factors were then overlaid in GIS to produce a map of groundwater potential zones for the study area, which was classified into five classes - very good, good, moderate, poor, and very poor. The model was validated using depth to
RIVER INTERLINKING (BY CANAL AND TUNNELS)IRJET Journal
1) The document discusses a proposal to link rivers in Maharashtra, India to address uneven water supply through inter-basin water transfers.
2) Specifically, it proposes diverting water from the Par River basin which experiences flooding, to the Girna River basin which faces water shortages.
3) This would be accomplished by building dams on the Par River connected by tunnels and pipelines to store and transport water eastward to the Godavari basin for irrigation and other uses.
Delineation of Groundwater Recharge Potential Zones Using Geo- Spatial TechniqueIRJET Journal
This document describes a study that used geospatial techniques to delineate groundwater recharge potential zones in a 120 square kilometer watershed area in Pune district, Maharashtra, India. The researchers created thematic layers for geomorphology, soil, land use/land cover, slope, drainage density and rainfall from satellite imagery and topographic maps. These layers were assigned weights and ranks based on their influence on groundwater occurrence and movement. A multi-criteria analysis was performed in GIS to integrate the thematic layers and generate a map showing zones of good, moderate and poor groundwater recharge potential. The results were verified against field conditions and it was concluded that the geospatial approach provided an efficient, low-cost
Mp gw applying aquifer modification techniques like hydrofraking, bore blast...hydrologywebsite1
The document provides a final report on a groundwater study using hydrofracking in the Rohini watershed area of Madhya Pradesh, India. It details the pre-investigation activities including the local geology, hydrology, and existing groundwater problems. The objectives of the study were to assess hydrofracking's applicability, develop an optimal abstraction methodology, gain expertise in the technique, increase awareness of it among farmers, and test it on 15 borewells. The methodology section explains hydrofracking principles, procedures, testing done before and after, and factors controlling its success or failure. Results, analyses, evaluations, recommendations and conclusions are presented.
Mh sw optimisation of g&d stations network of maharashtrahydrologyproject0
This document discusses optimizing the streamgauge and raingauge network for the Upper Bhima Basin in India. It provides background on hydrological information systems and networks in India. The Hydrology Project aims to improve India's capabilities for collecting and analyzing hydrological data. This study was conducted as part of the Hydrology Project to review and optimize the existing hydrometric network in Maharashtra state, which includes streamgauges and raingauges. The goal is to ensure the network is collecting the necessary data to facilitate optimal water resources use and management in the Upper Bhima Basin.
The Hydrology Project has been running in India since 1995 and has significantly improved the availability and reliability of hydro-meteorological data in the country. It has established networks for instrumenting, processing, and applying hydrological data across nine states and six central agencies. The project focuses on building blocks like instrumentation, data processing, dissemination and specific applications like river basin planning tools, flood management tools, and studies. While the project has achieved a lot, further development is still needed to ensure sufficient high quality data for optimal water resources management in India according to the National Water Policy.
Objectives:
Develop a replicable integrated model (methodology) for evaluating the extent and development potential of renewable (non-renewable) groundwater resources in arid lands, with the Eastern Desert of Egypt as a pilot site.
The model will be replicable for similar arid areas; North of Sudan, Tibesty, Yemen, and Saudi Arabia.
Building national capacities.
The document summarizes several UK-India collaborative projects between British Geological Survey and Indian partners on water resources and groundwater under the Newton Bhabha initiative. It describes the Hydroflux project which integrated climate, land use, surface water and groundwater models in northern India's Ganga river basin and the UPSCAPE project which is modeling interventions and their impacts across scales in the Cauvery river basin in peninsular India. It emphasizes the importance of stakeholder engagement and collaboration between researchers, government, and other groups to ensure research outputs and impacts.
Ganga river corridor mapping, pollution impact assessment in the Haridwar Dis...IRJET Journal
This document discusses using drone technology and remote sensing to map pollution levels in the Ganga River in Haridwar, India. Researchers used drones to capture aerial images of the river, which were then processed using GIS software to identify pollution hotspots. This allowed them to quickly and accurately locate patches of wet and dry pollution from sources like sewage and solid waste. Identifying these pollution sources is an important first step towards cleaning the river in a targeted manner. The study demonstrates how new technologies like drones can help monitor river pollution at a low cost and with high spatial resolution.
- The document discusses progress updates on various hydrology projects in Madhya Pradesh, India. It summarizes work done on replacing and installing piezometers, water quality lab equipment, data centers, and conducting in-well boring and hydrofracturing. It also discusses upcoming work including installing a multi-channel resistivity meter. Major project achievements to date and proposed physical inputs for 2014-15 are highlighted. Purpose driven studies on Shahpura Lake water quality impacts and hydrofracking techniques are also summarized.
Dam Break Analysis of Peringalkuthu Dam, Thrissur Using HEC-RASIRJET Journal
This document summarizes a study that performed dam break analysis of the Peringalkuthu Dam in Thrissur, Kerala, India using the HEC-RAS software. The study collected data on the dam's reservoir capacity and layout. It then modeled dam failure scenarios in HEC-RAS to map flood depth, velocity, and water surface elevation downstream. The study found maximum flood depths of 15-18 meters near the dam, with velocities of 10-15 m/s. It identified populations at risk and produced inundation maps to help emergency response planning.
The document discusses Dryland Systems staffing and research methods testing at ICRISAT in West Africa. It outlines that the Dryland Systems team is composed of 9+ scientists from ICRISAT and partner institutions covering two action transects. It also describes testing of methods for biomass assessments, household surveys, and options for intensification pathways that were conducted in 2012 to establish baselines and protocols for the Dryland Systems research.
Similar to SyQwest Bathy-2010 Sub Bottom Profiler used in Tarbela Reservoir Study (20)
HydroBox HD™ Hydrographic Echosounder ManualSyQwest Inc.
The HydroBox HD™ is a portable, low power, high-resolution, and water-resistant marine hydrographic echosounding instrument capable of delivering cm resolution for bottom depth measurements. When used with SyQwest’s survey grade transducers the instrument provides depth measurement accuracy that meets all of the IHO requirements. It is designed exclusively for inshore and coastal hydrographic marine survey up to 1,000 meters of water depth and operates at either 33, 50, or 210kHz. An simultanious dual channel dual frequency option is also available for dual frequency surveys.
Stratabox HD™ CHIRP Marine Geophysical Instrument ManualSyQwest Inc.
Stratabox HD™ CHIRP Marine Geophysical Instrument istallation, operation and maintenance manual.
The Stratabox HD™ is a portable, low power, high-resolution, and water-resistant marine sediment imaging instrument capable of delivering 6 cm of marine sediment strata resolution with bottom penetration of up to 40 meters. It is designed exclusively for inshore and coastal geophysical marine survey up to 150 meters of water depth and operates at 10 kHz.
IODP uses SyQwest's Bathy 2010 3.5 khz Chirp Profiler to conduct geo physical...SyQwest Inc.
Integrated Ocean Drilling Program (IODP) Expedition 324 had long transits from Yokohama, Japan, to Shatsky Rise; between the five sites; and from Shatsky Rise to Townsville, Australia. In all, transits took approximately one-third of the entire time allotted for the expedition. Underway geophysical data were collected in international
waters during transit and between drill sites. Bathymetry and magnetic data were collected using a 3.5 kHz CHIRP/echosounder and marine magnetometer, respectively (Fig. F1). A gyrocompass and a Global Positioning System (GPS) navigation system were used for positioning the bathymetric and magnetic data.
Shell Offshore Conducts Seismic Survey Using SyQwest Strata Box 3.5 khzSyQwest Inc.
Shell Offshore collected marine seismic data in the Chukchi and Beaufort seas in support of potential future oil and gas leasing and development. Deep seismic acquisition for SOI was conducted by WesternGeco using the Gilavar, a source vessel that towed an airgun array as well as hydrophone streamers, and the Syqwest StrataBox to record reflected seismic data. Site clearance and shallow hazard surveys were conducted in the Beaufort Sea from the Henry Christoffersen (Henry C.) and Alpha Helix. The Alpha Helix also assisted the Cape Flattery with shallow hazards surveys in the Chukchi Sea.
Gowanus Canal Survey Report - Single Beam Echo SoundersSyQwest Inc.
The document is a bathymetric survey report of the Gowanus Canal in Brooklyn, New York. It was conducted in January 2010 by CR Environmental, Inc. for HDR Architecture and Engineering. The survey mapped seabed elevations using sonar equipment on boats. Elevations in the Canal ranged from -0.13 to -38 feet NAVD88. Access to some areas was limited by ice. The quality of the bathymetric data met US Army Corps of Engineers and International Hydrographic Organization guidelines for accuracy. Further surveys were recommended to map areas with limited access and locate debris.
Current Ms word generated power point presentation covers major details about the micronuclei test. It's significance and assays to conduct it. It is used to detect the micronuclei formation inside the cells of nearly every multicellular organism. It's formation takes place during chromosomal sepration at metaphase.
The debris of the ‘last major merger’ is dynamically youngSérgio Sacani
The Milky Way’s (MW) inner stellar halo contains an [Fe/H]-rich component with highly eccentric orbits, often referred to as the
‘last major merger.’ Hypotheses for the origin of this component include Gaia-Sausage/Enceladus (GSE), where the progenitor
collided with the MW proto-disc 8–11 Gyr ago, and the Virgo Radial Merger (VRM), where the progenitor collided with the
MW disc within the last 3 Gyr. These two scenarios make different predictions about observable structure in local phase space,
because the morphology of debris depends on how long it has had to phase mix. The recently identified phase-space folds in Gaia
DR3 have positive caustic velocities, making them fundamentally different than the phase-mixed chevrons found in simulations
at late times. Roughly 20 per cent of the stars in the prograde local stellar halo are associated with the observed caustics. Based
on a simple phase-mixing model, the observed number of caustics are consistent with a merger that occurred 1–2 Gyr ago.
We also compare the observed phase-space distribution to FIRE-2 Latte simulations of GSE-like mergers, using a quantitative
measurement of phase mixing (2D causticality). The observed local phase-space distribution best matches the simulated data
1–2 Gyr after collision, and certainly not later than 3 Gyr. This is further evidence that the progenitor of the ‘last major merger’
did not collide with the MW proto-disc at early times, as is thought for the GSE, but instead collided with the MW disc within
the last few Gyr, consistent with the body of work surrounding the VRM.
hematic appreciation test is a psychological assessment tool used to measure an individual's appreciation and understanding of specific themes or topics. This test helps to evaluate an individual's ability to connect different ideas and concepts within a given theme, as well as their overall comprehension and interpretation skills. The results of the test can provide valuable insights into an individual's cognitive abilities, creativity, and critical thinking skills
Unlocking the mysteries of reproduction: Exploring fecundity and gonadosomati...AbdullaAlAsif1
The pygmy halfbeak Dermogenys colletei, is known for its viviparous nature, this presents an intriguing case of relatively low fecundity, raising questions about potential compensatory reproductive strategies employed by this species. Our study delves into the examination of fecundity and the Gonadosomatic Index (GSI) in the Pygmy Halfbeak, D. colletei (Meisner, 2001), an intriguing viviparous fish indigenous to Sarawak, Borneo. We hypothesize that the Pygmy halfbeak, D. colletei, may exhibit unique reproductive adaptations to offset its low fecundity, thus enhancing its survival and fitness. To address this, we conducted a comprehensive study utilizing 28 mature female specimens of D. colletei, carefully measuring fecundity and GSI to shed light on the reproductive adaptations of this species. Our findings reveal that D. colletei indeed exhibits low fecundity, with a mean of 16.76 ± 2.01, and a mean GSI of 12.83 ± 1.27, providing crucial insights into the reproductive mechanisms at play in this species. These results underscore the existence of unique reproductive strategies in D. colletei, enabling its adaptation and persistence in Borneo's diverse aquatic ecosystems, and call for further ecological research to elucidate these mechanisms. This study lends to a better understanding of viviparous fish in Borneo and contributes to the broader field of aquatic ecology, enhancing our knowledge of species adaptations to unique ecological challenges.
The ability to recreate computational results with minimal effort and actionable metrics provides a solid foundation for scientific research and software development. When people can replicate an analysis at the touch of a button using open-source software, open data, and methods to assess and compare proposals, it significantly eases verification of results, engagement with a diverse range of contributors, and progress. However, we have yet to fully achieve this; there are still many sociotechnical frictions.
Inspired by David Donoho's vision, this talk aims to revisit the three crucial pillars of frictionless reproducibility (data sharing, code sharing, and competitive challenges) with the perspective of deep software variability.
Our observation is that multiple layers — hardware, operating systems, third-party libraries, software versions, input data, compile-time options, and parameters — are subject to variability that exacerbates frictions but is also essential for achieving robust, generalizable results and fostering innovation. I will first review the literature, providing evidence of how the complex variability interactions across these layers affect qualitative and quantitative software properties, thereby complicating the reproduction and replication of scientific studies in various fields.
I will then present some software engineering and AI techniques that can support the strategic exploration of variability spaces. These include the use of abstractions and models (e.g., feature models), sampling strategies (e.g., uniform, random), cost-effective measurements (e.g., incremental build of software configurations), and dimensionality reduction methods (e.g., transfer learning, feature selection, software debloating).
I will finally argue that deep variability is both the problem and solution of frictionless reproducibility, calling the software science community to develop new methods and tools to manage variability and foster reproducibility in software systems.
Exposé invité Journées Nationales du GDR GPL 2024
ESR spectroscopy in liquid food and beverages.pptxPRIYANKA PATEL
With increasing population, people need to rely on packaged food stuffs. Packaging of food materials requires the preservation of food. There are various methods for the treatment of food to preserve them and irradiation treatment of food is one of them. It is the most common and the most harmless method for the food preservation as it does not alter the necessary micronutrients of food materials. Although irradiated food doesn’t cause any harm to the human health but still the quality assessment of food is required to provide consumers with necessary information about the food. ESR spectroscopy is the most sophisticated way to investigate the quality of the food and the free radicals induced during the processing of the food. ESR spin trapping technique is useful for the detection of highly unstable radicals in the food. The antioxidant capability of liquid food and beverages in mainly performed by spin trapping technique.
The binding of cosmological structures by massless topological defectsSérgio Sacani
Assuming spherical symmetry and weak field, it is shown that if one solves the Poisson equation or the Einstein field
equations sourced by a topological defect, i.e. a singularity of a very specific form, the result is a localized gravitational
field capable of driving flat rotation (i.e. Keplerian circular orbits at a constant speed for all radii) of test masses on a thin
spherical shell without any underlying mass. Moreover, a large-scale structure which exploits this solution by assembling
concentrically a number of such topological defects can establish a flat stellar or galactic rotation curve, and can also deflect
light in the same manner as an equipotential (isothermal) sphere. Thus, the need for dark matter or modified gravity theory is
mitigated, at least in part.
ESPP presentation to EU Waste Water Network, 4th June 2024 “EU policies driving nutrient removal and recycling
and the revised UWWTD (Urban Waste Water Treatment Directive)”
The use of Nauplii and metanauplii artemia in aquaculture (brine shrimp).pptxMAGOTI ERNEST
Although Artemia has been known to man for centuries, its use as a food for the culture of larval organisms apparently began only in the 1930s, when several investigators found that it made an excellent food for newly hatched fish larvae (Litvinenko et al., 2023). As aquaculture developed in the 1960s and ‘70s, the use of Artemia also became more widespread, due both to its convenience and to its nutritional value for larval organisms (Arenas-Pardo et al., 2024). The fact that Artemia dormant cysts can be stored for long periods in cans, and then used as an off-the-shelf food requiring only 24 h of incubation makes them the most convenient, least labor-intensive, live food available for aquaculture (Sorgeloos & Roubach, 2021). The nutritional value of Artemia, especially for marine organisms, is not constant, but varies both geographically and temporally. During the last decade, however, both the causes of Artemia nutritional variability and methods to improve poorquality Artemia have been identified (Loufi et al., 2024).
Brine shrimp (Artemia spp.) are used in marine aquaculture worldwide. Annually, more than 2,000 metric tons of dry cysts are used for cultivation of fish, crustacean, and shellfish larva. Brine shrimp are important to aquaculture because newly hatched brine shrimp nauplii (larvae) provide a food source for many fish fry (Mozanzadeh et al., 2021). Culture and harvesting of brine shrimp eggs represents another aspect of the aquaculture industry. Nauplii and metanauplii of Artemia, commonly known as brine shrimp, play a crucial role in aquaculture due to their nutritional value and suitability as live feed for many aquatic species, particularly in larval stages (Sorgeloos & Roubach, 2021).
The technology uses reclaimed CO₂ as the dyeing medium in a closed loop process. When pressurized, CO₂ becomes supercritical (SC-CO₂). In this state CO₂ has a very high solvent power, allowing the dye to dissolve easily.
2. S. Munir et al.
157
1. Introduction
Data collected through hydrographic surveying play a pivotal role in decision making for short term and long
term planning, operation and management of the reservoir [1]. Generally, in water resources engineering and
management projects in Indus Basin the traditional methods of hydrographic surveying are adopted, although
these methods served the purpose to a large extent in the past. But now, water resources are under immense
pressure due to various factors and need a variety of information in order to take timely and informed decisions
for efficient management of water. The traditional methods do not have the capacity to deal with such data in an
efficient way.
In case of Tarbela Reservoir, the traditional method of hydrographic surveying consists of a large set of heavy
and complicated equipment. The equipment consists of mainly echosounders, printers, time tagging machine,
wireless communication sets, mini rangers, power batteries and theodolites, etc. [2]. Accordingly, a large crew is
required onboard in order to mount and operate the equipment.
This is not the case only with Tarbela Reservoir, but almost in every major water project in Indus Basin the
same approach is adopted. The situation with Provincial Irrigation Departments (PIDs) in Indus Basin, which are
the backbone of agricultural production in the country, is even worse. The PIDs have been practicing century old
hydrographic surveying techniques. These techniques mainly consist of sounding rod, sounding probe with very
crude distance/depth measuring techniques. These techniques are outdated now and in no way are capable of
meeting the demands of an accurate hydrographic surveying.
Difficulties and limitations in hydrographic data collection with traditional and some outdated practices make
the need of introducing some efficient techniques for these surveys. In this paper an effort is made to introduce
and evaluate an integrated approach of hydrographic surveying. This approach will address most of the above
mentioned deficiencies up to a large extent. Furthermore, the new approach is compared with the traditional
methods in several ways in order to understand the efficiency of the new approach. The main parameters of
comparison are the time, accuracy and ease of operation. At the end of the paper, variety and sophistication in
the output from this approach is discussed.
2. Methods and Approach
2.1. Hydrology of Tarbela Dam
Tarbela Dam was constructed in 1974 in Indus River at Tarbela, Haripur District, Pakistan. It is located about
100 km away from Islamabad in the North-west direction. The dam is located at 34˚5'16.61"N, 72˚41'55.56"E.
The main dam is an earth core rock fill type with a length of 2743 meters and 148 meters high [3]. The reservoir
is about 100 km long, but analysis is confined up to 15 km upstream of the dam. Figure 1 shows layout of the
Tarbela Reservoir.
Figure 1. Layout of Tarbela Reservoir with study area.
3. S. Munir et al.
158
Length of Indus River upstream of Tarbela Dam is about 1100 km with a basin area of about 169,645 km2
.
Most of the upper Indus Basin area consists of snow covered high mountains, whereas monsoon area of the ba-
sin covers only 10,360 km2
just above Tarbela [4]. Indus River carries enormous amounts of sediments, which
deposits in the reservoir and is the main reason of decrease in storage volume. Sedimentation reduces the capac-
ity of reservoir over time, which is monitored through hydrographic surveying and the annual buildup of sedi-
ments is computed. Figure 1 presents an overview of Trabela Reservoir.
2.2. New Integrated Approach
The new integrated approach of hydrographic surveying, under discussion, consists of meaningful combination
of hardware, software and human. It mainly consists of Differential Global Positioning System (DGPS), echo-
sounder with transducer, field computer [5] and reliable power supply. Two softwares are mainly used; one is
for collecting bathymetric data, the bathy 2010 Software, and the other is Hypack. Hypack Software, in this ap-
proach played central role and involved in all stages of surveying from in-house survey planning to produce the
sophisticated end products.
Reservoir sounding data including sub-bottom profiling was collected using 3.5 kHz Chirp sub-bottom pro-
filer. The transducer was connected with Bathy 2010 Echosounder. The 3D positioning data were collected
through differential GPS. Differential corrections were received in real time through geostationary satellite
(OmniStar). SyQwest Echsounder was operated through Bathy 2010 Software. All position and sounding data
were stored in Bathy 2010 Software. From Bathy 2010 Software, data were exported to Hypack. Hypack then
stored all the data and guided in maintaining the survey vessel position. Figure 2 shows a field setup of inte-
grated hydrographic surveying approach.
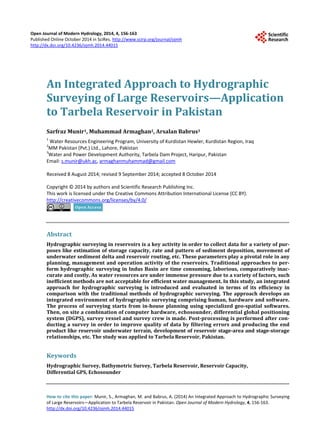
2.3. Pre-Survey Planning
In order to conduct an accurate and efficient survey, there are some pre-survey planning steps [6], which need to
be taken before the actual survey as shown in Figure 3. The pre-survey planning mainly includes acquisition of
the background image of the study area, which may be obtained from Google Earth, through remote sensing or
aerial photography, and then importing the image to Hypack Software for geo-referencing. After geo-referencing,
the image is used for drawing the survey paths as shown in Figure 4.
2.4. Performing Hydrographic Survey
In hydrographic surveying with this approach, generally a crew of three members is involved, one is the boat-
man to operate and maintain the survey vessel’s position on planned survey paths. Second member is to operate
Figure 2. Field setup of integrated hydrographic surveying approach.
4. S. Munir et al.
159
Figure 3. Step by step hydrographic surveying proce-
dure.
Figure 4. Planned survey paths prepared in Hypack 2012 Software.
the equipment and the third member may be required for equipment mounting and/or as boat helper. The trans-
ducer is mounted on one side of the boat, with DGPS antenna directly above it. Survey is performed on the
planned survey paths, as decided in the in-house planning. The echosounder and DGPS start data acquisition
simultaneously, using Bathy 2010 Software and Hypack 2012 Software, in this case. The survey vessel is maneu-
vered on the pre-defined survey paths. Data collection interface with Bathy 2010 Software is shown in Figure 5.
Pre Survey Planning
Through Hypack Software
● Importing background image of reservoir
● Georeferencing the image
● Drawing survey lines/paths
● as described in Figure 2.
Performing survey
PostSurvey Processing
Using Hypack Software
● Removing errors through filtering, smoothing
and erasing
● Filling missing values manually or through
interpolations
● Preparing cross sections
● Preparing elevation contours
● Calculating surface areas
● Calculating reservoir volumes
● Developing stage-storage and stage-area
curves
● Data exporting to other common formats
5. S. Munir et al.
160
Figure 5. Bathymetric and sub-bottom profiling data collection with Bathy 2010 Software.
2.5. Post Processing
Post processing is the most important part of hydrographic surveying. It is mainly performed in order to improve
the quality of collected data by removing errors and filling gaps for missing data. After improving the quality,
the data are used to produce the end products. Raw bathymetric data are processed and analyzed in Hypack
Software in order to filter multiple return acoustic signals, soundings with random errors and noise, GPS error
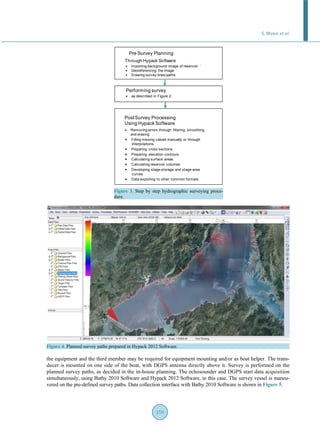
and remaining gap near shore for inaccessible areas with the boat. The Raw data are viewed, corrected and
saved in edit files as shown in Figure 6.
In order to determine the reservoir area and reservoir volume from survey data, a variety of options is avail-
able in the Hypack Software including Triangular Irregular Network (TIN). A TIN is a vector data structure that
partitions geographic space into contiguous, non-overlapping triangles. The vertices of each triangle are sample
data points with X, Y, and Z values [7]. These sample points are connected by lines to form Delaunay triangles.
TINs are used to store and display surface models (ESRI). A digitized polygon enclosing the collected data can
be developed such that interpolation is not allowed to come outside the boundary.
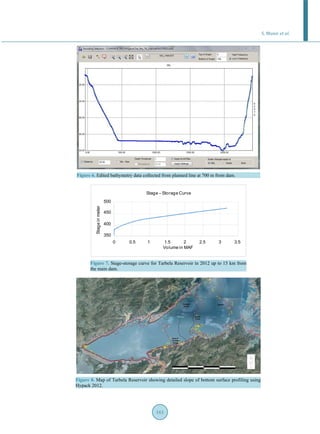
3. Results and Discussion
A variety of options is available in the Hypack Software to present the survey results and to produce the final
products.
After the collection of bathymetric data of Tarbela cross section, the X, Y, and Z data were imported in Hy-
pack 2012. The cross-section data were combined into a single point dataset. Contour lines and TIN model of
the bottom surface were generated [8] from the resulting profiles for the generation of a final bathymetric map.
A stage-storage relationship was developed by calculating storage volumes on different elevations of reser-
voir, and presented in Figure 7. There are several methods available for determining the reservoir volume but
the most accurate is TIN surface model [9] [10]. TIN is most suitable model due to dense spatial data and ir-
regular shape of the reservoir. The calculated storage volume in Tarbela reservoir is 3.83 BCM (3.1 MAF) in 15
km reservoir area from the main dam.
In Figure 8, the pivot point, foreset slope, bottomset slope and the topset slope are very much evident. The
pivot point on left side of the reservoir is close to the dam as compared to right side. In 2012 the pivot point was
located about 8.4 km to 9.6 km from the intakes and from 7.5 to 9.1 km from the center line of the main dam.
During 2012 bathymetric survey, the deepest bed surface was observed to be 104 m, near the intake of the dam.
The depth of the Tarbela reservoir reduces gradually towards the upstream of reservoir and tributaries.
6. S. Munir et al.
161
Figure 6. Edited bathymetry data collected from planned line at 700 m from dam.
Figure 7. Stage-storage curve for Tarbela Reservoir in 2012 up to 15 km from
the main dam.
Figure 8. Map of Tarbela Reservoir showing detailed slope of bottom surface profiling using
Hypack 2012.
Stage – Storage Curve
Stageinmeter
500
450
400
350
Volume in MAF
0 0.5 1 1.5 2 2.5 3 3.5
7. S. Munir et al.
162
Comparison with Traditional Approach
Table 1 presents a comparison of traditional survey method and the modern approach of hydrographic surveying.
It is evident from facts that the modern approach is much efficient and accurate for conducting hydrographic
surveys. The end products like computation of stage-storage relationship (Figure 7), development of 3D reser-
voir surface (Figure 9) and creation of contour map (Figure 10), etc. make it evident that the modern approach
produces much better products from the survey, as compared with the traditional method.
4. Conclusion
In this paper an integrated approach of hydrographic surveying was introduced, elaborated and compared with
the traditional approaches. It has been found that the new integrated approach is more efficient in terms of saving
resources (humans and time), improving accuracy, ease of operation of the equipment, automatic analytical fa-
cilities and a large variety of end products. End products for a reservoir mainly include accurate stage-areas and
stage-storage relationships, generation of 3D reservoir surface, creation of contour map of the reservoir eleva-
tions, etc. In comparison with conventional approaches the integrated approach reduces the survey crew to about
three persons instead of 15 in conventional approaches. Survey can be performed in much less time as compared to
Table 1. Comparison of traditional survey and modern approach of hydrographic surveying.
Sr. No. Item Traditional Method Integrated Approach
1 Main equipment
Multi-frequency single beam echosounder, digital
printer data (tabular), time tagging machine, mini
rangers, theodolites, power batteries, wireless
radio, control station (Burgee)
Multi-frequency single beam echosounder,
Differential GPS, Power source
2 Software Hypack®, Bathy 2010
3 Survey crew About 15 persons 3 persons
4 Time Six weeks required covering whole reservoir One week
5
Post processing/
Calculations
Eight weeks One week
6
Preparation of maps
and other products
Twelve weeks after completion of survey One week after completion of survey
7 Product’s type
Contour map of reservoir surface, stage-storage
relationship, reservoir capacity
Reservoir’s under water terrain, storage
capacity, stage storage relationship, three
dimensional reservoir surface
Figure 9. Generated 3D surface of the reservoir in 2012 up to 15 km from the main dam.
8. S. Munir et al.
163
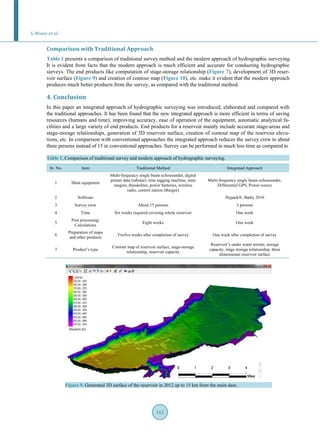
Figure 10. Reservoir surface elevation contour map with 20 m interval.
traditional approaches, as in case of Tarbela Reservoir it can be performed in one week, instead of four weeks in
old approach. Similarly, data analysis and interpretation can be performed in one week with a large variety of
end products, instead of two to three months in traditional approaches, with limited variety of end products.
Acknowledgements
Authors acknowledge the cooperation of WAPDA on facilitating with survey and providing the previous data.
Authors also are grateful for the help of colleagues Mr. Muhammad Ahmad Khan, Mr. Waqas Sikandar and Mr.
Zahoor Ahmed helping in conducting this research.
References
[1] Melvin, J.U. and Rockville, M.D. (1976) Hydrographic Manual Forth Edition. USA Department of Commerce, National
Oceanic and Atmospheric Administration (NOAA), Nation Ocean Service (NOS), Washington DC, 1-13.
[2] Barry, W.M. and Dale, H. (1989) Technical Report HL-89-21 Small Boat Survey System. Survey and Mapping Research
and Development Program, Department of the Army, Waterways Experiment Station, Corps of Engineer, Vicksburg,
9-15.
[3] Marta, R. (2012) Tarbela Dam in Pakistan. Case Study of Reservoir Sedimentation. River Flow 2012: Proceedings of the
International Conference on Fluvial Hydraulics, San José, 5-7 September 2012, 1-9.
http://eprints.hrwallingford.co.uk/567/
[4] Pakistan Space and Upper Atmosphere Research Commission (2013) Estimation of Snow Cover for Year 2013 (In-
dus Basin).
[5] Ronald, L.F. (2009) Clear Lake 2007 Hydrographic Survey. Technical Report No. SRH-2009-36, USA Department of
Interior Bureau of Reclamation Technical Service Center Water and Environmental Resources Division Sedimentation
and River Hydraulics Group Denver, Colorado, 4-11.
[6] Ronald, F. and Kent, C. (2008) Erosion and Sedimentation Manual—Reclamation and Managing Water in the West,
USA Department of the Interior Bureau of Reclamation, Washington DC, 7- 41.
[7] Kennedy, H. (2001) Dictionary of GIS Terminology Redlands. Environmental System Research Institute, Inc., Red-
lands, 116.
[8] Sorin, D.G., Romania, C.C. and Nicolae, J. (2007) Trend of Standards for Hydrographic Survey. Proceedings of the
5th IASME/WSEAS International Conference on Heat Transfer, Thermal Engineering and Environment, Athens, 25-27
August 2007, 256-262.
[9] Oklahoma Water Resources Board (2005) Hydrographic Survey of Dave Boyer (Walters) Lake. Oklahoma Water Re-
sources Board, Oklahoma City, 4-22.
[10] The Water Agency (2009) Final report: Hydrographic Survey of W.R. Holway Reservoir. Oklahoma Water Resources
Board, Oklahoma City, 5-27.