Downloaded 340 times
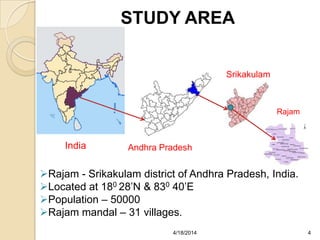
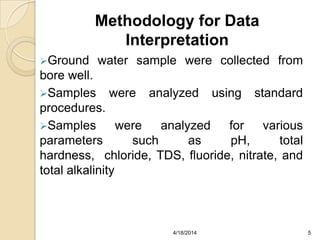
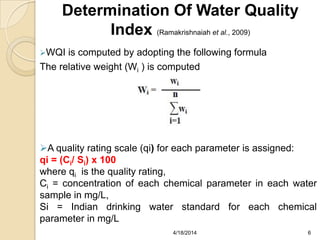
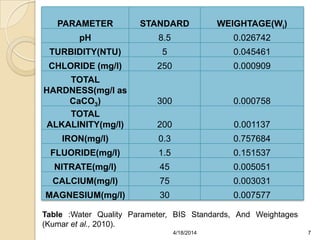
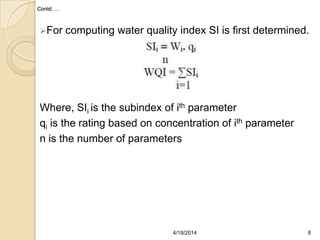
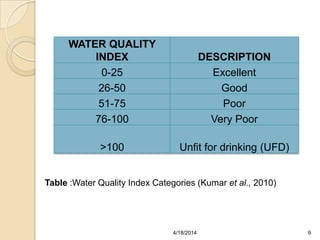
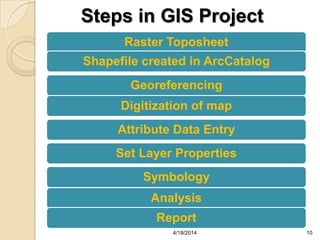
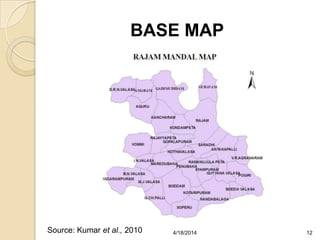
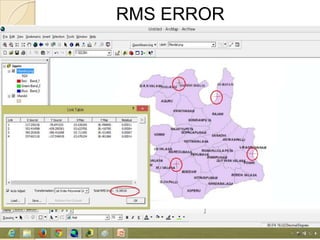

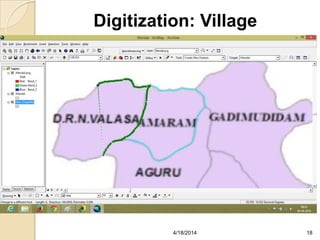
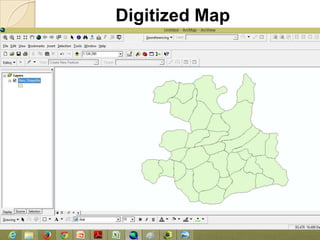
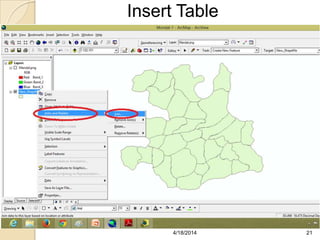
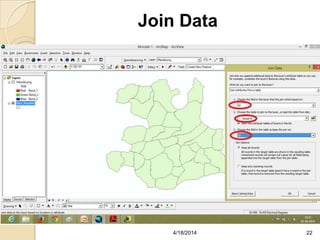
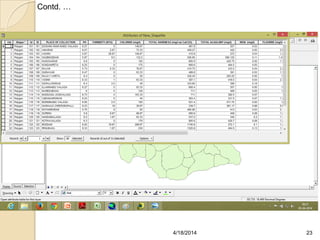
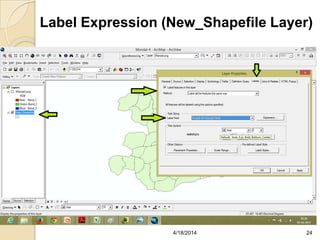
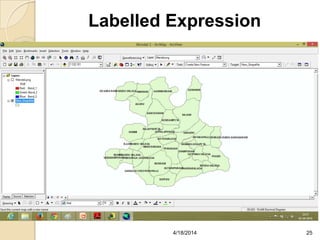
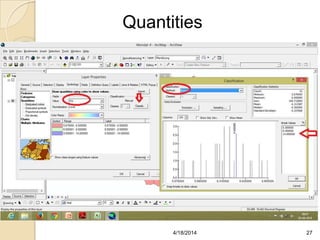
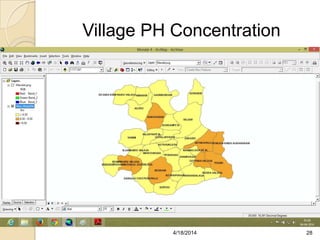
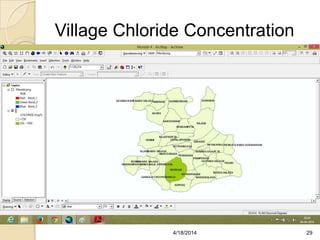
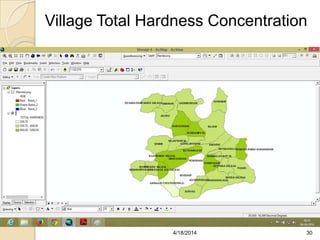
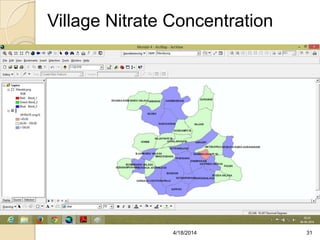
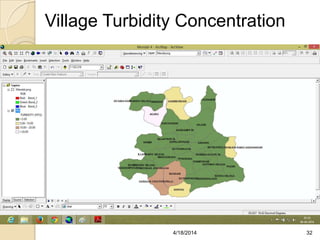
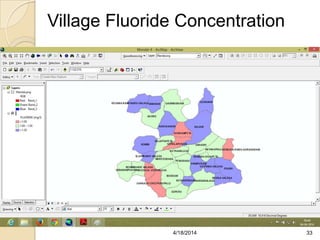

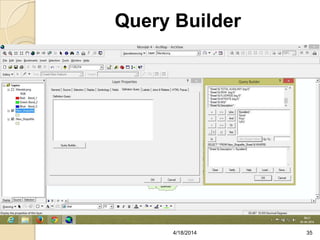
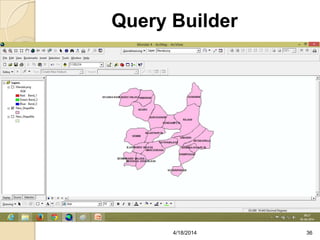
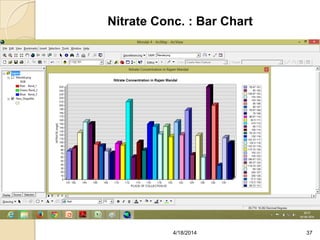
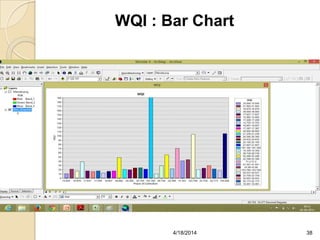
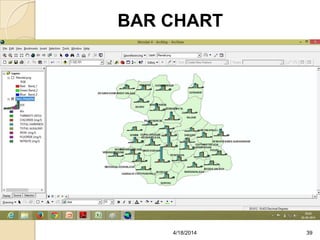
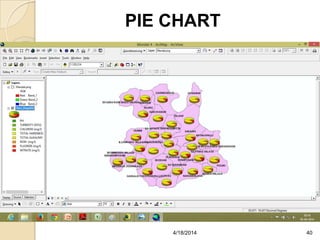
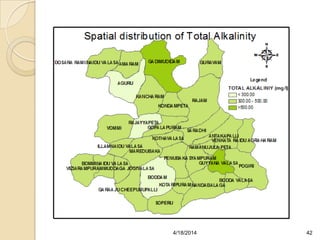
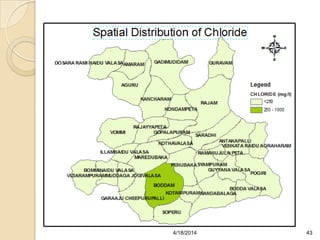
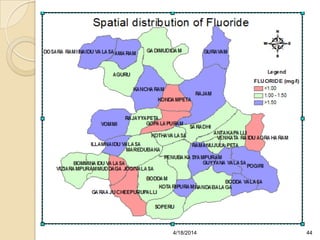
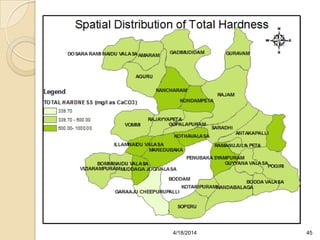
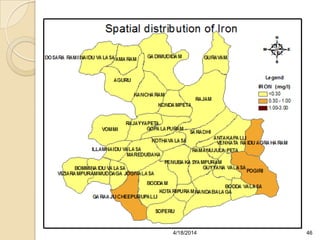
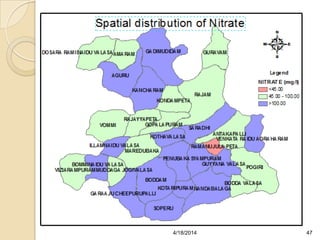
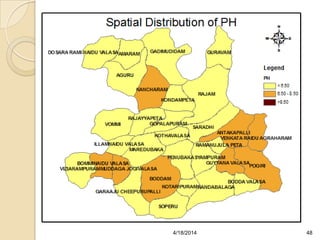
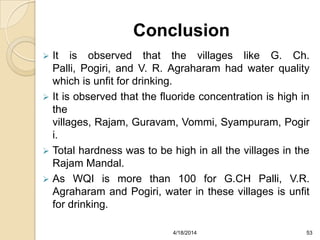

This document presents a study that uses GIS to map groundwater quality in the Rajam area of Andhra Pradesh, India. Water samples were collected from 31 villages and analyzed for various parameters. A water quality index (WQI) was calculated based on the parameters. The WQI values were then mapped in a GIS to produce a groundwater quality map of the study area and identify villages where water quality was poor or unfit for drinking. Maps in the GIS showed concentrations of different parameters like pH, chloride, and nitrates across villages. The study found high fluoride in some villages and poor water quality in 3 villages based on their WQI over 100.


