
More Related Content
What's hot
What's hot (20)
Similar to Nih sw hydrological assessment of ungauged catchments (small catchments) mahanadi sub-basin
Similar to Nih sw hydrological assessment of ungauged catchments (small catchments) mahanadi sub-basin (20)
More from hydrologyproject2
More from hydrologyproject2 (10)
Recently uploaded
Recently uploaded (20)
Nih sw hydrological assessment of ungauged catchments (small catchments) mahanadi sub-basin
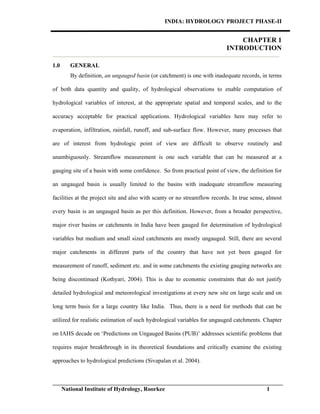
- 1. INDIA: HYDROLOGY PROJECT PHASE-II ______________________________________________________________________________ National Institute of Hydrology, Roorkee 1 CHAPTER 1 INTRODUCTION 1.0 GENERAL By definition, an ungauged basin (or catchment) is one with inadequate records, in terms of both data quantity and quality, of hydrological observations to enable computation of hydrological variables of interest, at the appropriate spatial and temporal scales, and to the accuracy acceptable for practical applications. Hydrological variables here may refer to evaporation, infiltration, rainfall, runoff, and sub-surface flow. However, many processes that are of interest from hydrologic point of view are difficult to observe routinely and unambiguously. Streamflow measurement is one such variable that can be measured at a gauging site of a basin with some confidence. So from practical point of view, the definition for an ungauged basin is usually limited to the basins with inadequate streamflow measuring facilities at the project site and also with scanty or no streamflow records. In true sense, almost every basin is an ungauged basin as per this definition. However, from a broader perspective, major river basins or catchments in India have been gauged for determination of hydrological variables but medium and small sized catchments are mostly ungauged. Still, there are several major catchments in different parts of the country that have not yet been gauged for measurement of runoff, sediment etc. and in some catchments the existing gauging networks are being discontinued (Kothyari, 2004). This is due to economic constraints that do not justify detailed hydrological and meteorological investigations at every new site on large scale and on long term basis for a large country like India. Thus, there is a need for methods that can be utilized for realistic estimation of such hydrological variables for ungauged catchments. Chapter on IAHS decade on ‘Predictions on Ungauged Basins (PUB)’ addresses scientific problems that requires major breakthrough in its theoretical foundations and critically examine the existing approaches to hydrological predictions (Sivapalan et al. 2004).
- 2. INDIA: HYDROLOGY PROJECT PHASE-II ______________________________________________________________________________ National Institute of Hydrology, Roorkee 2 However, a major dilemma facing hydrologists is how best to predict hydrologic variables in ungauged basins where little or no information is available. The primary cause of difficulty with such predictions is the high degree of heterogeneity of the land surface condition, soils, vegetation, land use, flood producing mechanisms e.g. snow fed or rain fed, and space- time variability of the climate inputs. Though a lot of advances have been made in developing methods for delineating homogeneous and heterogeneous regions on basis of specific hydrologic variables, but there remain numerous basic problems that still need to be resolved before these methods can be used universally. One of the drawbacks is that the existing method for estimating the degree of heterogeneity requires sufficient field data at regional scales, which is generally not available. Also, in cases where sufficient data is available, representation of hydrologic processes resulting due from the heterogeneities of landscape properties and climatic change is difficult (Nagesh and Maity, 2004). Given the above discussed limitations, the present practice of predictions in ungauged catchments in regard to streamflow variable, which is the interest of this study, is discussed in the section that follows. MAHANADI RIVER The river traverses Cuttack district in an east-west direction. Just before entering Cuttack city, it gives off a large distributary called the Kathjori. The city of Cuttack stands on the spit separating the two channels. The Kathjori then throws off many streams like the Kuakhai, Devi and Surua which fall into the Bay of Bengal after entering Puri district. The Kathjori itself falls into the sea as the Jotdar. Other distributaries of Mahanadi include the Paika, Birupa, Chitroptala iver, Genguti and Nun. The Birupa then goes on to join the Brahmani River at Krushnanagar and enters the Bay of Bengal at Dhamra. The Mahanadi proper enters the sea via several channels near Paradeep at False Point, Jagatsinghpur. The combined Delta of the Mahanadi's numerous distributaries and the Brahmani is one of the largest in India.
- 3. INDIA: HYDROLOGY PROJECT PHASE-II ______________________________________________________________________________ National Institute of Hydrology, Roorkee 3 An average annual surface water potential of 66.9 km³ has been assessed in this basin. Out of this, 50.0 km³ is utilisable water. Culturable area in the basin is about 80,000 km², which is 4% of the total culturable area of the country .Present use of surface water in the basin is 17.0 km³. Live storage capacity in the basin has increased significantly since independence. From just about 0.8 km³ in the pre-plan period, the total live storage capacity of the completed projects has increased to 8.5 km³. In addition, a substantial storage quantity of over 5.4 km³ would be created on completion of projects under construction. Additional storage to the tune of over 11.0 km³ would become available on execution of projects under consideration. The hydropower potential of the basin has been assessed as 627 MW at 60% load factor. At its peak during the monsoon, the Mahanadi has a discharge rate of 2 million cubic ft. per second, almost as much as the much larger Ganges. However owing to its seasonal nature the river is mostly a narrow channel flanked by wide sand banks for most of the year. The Mahanadi was notorious for its devastating floods for much of recorded history. However the construction of the Hirakud Dam has greatly altered the situation. Today a network of canals, barrages and check dams keep the river well in control. However heavy rain can still cause large scale flooding as evidenced in September, 2008 when 16 people died as the river breached its banks. In 2011, September heavy down pour of rain caused flash flood and many mud dwellings in more than 25 villages above Hirakud Dam which were never got affected before; both in Chhattisgarh and Orissa have melted down due to back water, which could not pass through the river.
- 4. INDIA: HYDROLOGY PROJECT PHASE-II ______________________________________________________________________________ National Institute of Hydrology, Roorkee 4 1.1 STATUS For many small catchments, the stream flow data are limited, and for ungauged basins it is not available. Under such circumstances, regional unit hydrograph and regional food frequency methods along with regional empirical formula developed using the data of gauged catchments in the region are used to arrive at design flood for the ungauged catchment. Regional unit hydrographs for such regions are derived using their physical, hydrological and storm characteristics. Research Designs and Standard Organization (RDSO) and Central Water Commission (CWC) documented a report in 1980 recommending regional hydrograph parameters and SUH relationships. This covers a part of the study area (proposed for this project) i.e. Mahanadi sub-zone (3d). In addition to this, the CWC has recommended criteria to be adopted for estimation of design flood for waterways of rail and road bridges in North Bengal, which doesn’t cover the present study area. In India regional flood frequency studies have been carried out using conventional methods such as USGS method, regression based methods. For some typical regions attempts have been made to study application of the new approaches in the studies conducted at some of the Indian research institutions and academic organizations. National Institute of Hydrology, Roorkee and IIT, Roorkee has brought out a state of art report on ‘Regionalization of Hydrological parameters’ that covers the status of the rational and empirical methods practices in India for regional analysis of flood. From the report it is inferred that no systematic study of this nature has been conducted in the proposed study area. Kumar et al., (1997) carried out a detailed regional flood frequency studies for zone-3, where a part of the present study area (3d) was included. Similarly, no systematic study has so far been attempted for development regional flow duration curves in the proposed study area.
- 5. INDIA: HYDROLOGY PROJECT PHASE-II ______________________________________________________________________________ National Institute of Hydrology, Roorkee 5 Under the present practices, synthetic unit hydrographs, regional unit hydrograph, regional food frequency methods along with regional empirical formula developed using the data of gauged catchments in the region are used to arrive at design flood for the ungauged catchment. Synthetic unit hydrographs (SUH) are derived using the well established empirical formula which relates the hydrograph parameters with the physiographic characteristics of a catchment. These parameters are than used to derive the complete shape of the unit hydrograph through some trial procedures; so in a way this involves some subjectivity. Regional unit hydrographs for a region are derived using their physical, hydrological and storm characteristics and in the process both SUH approach and physical based models are used. Similarly, in regional food frequency methods the parameters of a probability distribution function that is valid for a hydrological homogeneous are regionalized to be used for an ungauged catchment in the region. In addition to the above mentioned methods, sometime simple empirical formulae are derived for a region where the flow characteristics are related to the physical properties of a catchment. These formulae are used to compute certain flow characteristics (like peak discharge, time to peak of a UH) of a ungauged catchment. Research Designs and Standard Organization (RDSO) and Central Water Commission (CWC) documented a report in 1980 (Goel and Subhash Chander, 2002; CWC, 1980, 1982) recommending regional hydrograph parameters and SUH relationships. This covers a part of the study area (proposed for this project) i.e. Mahanadi sub-zone (3d). In addition to this, the CWC has recommended criteria to be adopted for estimation of design flood for waterways of rail and road bridges in North Bengal, which doesn’t cover the present study area. Some of the popular methods adopted in recent times for design flood estimation in ungauged catchments are describes in the following section.
- 6. INDIA: HYDROLOGY PROJECT PHASE-II ______________________________________________________________________________ National Institute of Hydrology, Roorkee 6 1.1.1 FLOW DURATION CURVE ( FDC ) The flow-duration curve provides a convenient means for studying the flow characteristics of streams and for comparing or°, basin with another. Various uses of the flow- duration curve A flow-duration curve (FDC) represents the relationship between the magnitude and frequency of daily, weekly, monthly (or some other time interval of) streamflow for a particular river basin, providing an estimate of the percentage of time a given streamflow was equaled or exceeded over a historical period. An FDC provides a simple, yet comprehensive, graphicalview of the overall historical variability associated with streamflow in a river basin. An FDC is the complement of the cumulative distribution function ( cdf) of daily streamflow. Each value of discharge Q has a corresponding exceedance probability p, and an FDC is simply a plot of Qp, the pth quantile or percentile of daily stream flow versus exceedance probability p, where p is defined by p = 1 -P{Q :s; q} (la) p = 1- FQ(q) (lb) The quantile Qp is a function of the observed streamflows, and since this function depends upon empirical observations, it is often termed the empirical quantile function. Statisticians term the complement of the cdf the "survival” distribution function. The 'term survival results from the fact that most applications involve survival data that arise in various fields. 1.1.2 Regional Flow Duration Curve (RFDC) Regional estimation of flow duration characteristics is important for water resources development at the small catchment scale. Regional analyses often fail to adequately represent
- 7. INDIA: HYDROLOGY PROJECT PHASE-II ______________________________________________________________________________ National Institute of Hydrology, Roorkee 7 the variability of the flow regime in small catchments (<50 km2 ), especially in remote mountainous regions where the calibration data are sparse and refer to much larger catchment scales. This study suggests an approach in which regional data are combined with actual instantaneous flow data to construct a representative daily flow duration curve for small catchments. A regional dimensionless flow duration curve (FDC) is developed for a hydrologically homogeneous region in Western–Northwestern Greece and used to estimate the FDC in two small mountainous catchments within the region. A number of instantaneous flow measurements available at the two sites are used in a statistical representation of the flow regime from which an estimate of the mean annual flow at the sites is made, allowing the construction of the FDC from the regional curve. Results obtained are in good agreement with observed data and show significant estimation improvement over other methods commonly employed in the study region. A sensitivity analysis using Monte Carlo simulation is performed to establish reasonable sampling requirements for small ungauged catchments in the study area and similar mountainous areas in the Mediterranean region. 1.1.3 Hydrograph A hydrograph is a graph showing the rate of flow (discharge) versus time past a specific point in a river, or other channel or conduit carrying flow. The rate of flow is typically expressed in cubic meters or cubic feet per second (cumecs or cfs). It can also refer to a graph showing the volume of water reaching a particular outfall, or location in a sewerage network, graphs are commonly used in the design of sewerage, more specifically, the design of surface water sewerage systems and combined sewers. In surface water hydrology, a hydrograph is a time record of the discharge of a stream, river or watershed outlet. Rainfall and/or snowmelt is typically the main driver of watershed
- 8. INDIA: HYDROLOGY PROJECT PHASE-II ______________________________________________________________________________ National Institute of Hydrology, Roorkee 8 discharge; a hydrograph records how a watershed responds to these and other drivers of watershed hydrology. A watershed's response to rainfall depends on a variety of factors which affect the shape of a hydrograph: a) Watershed topography and dimensions b) Soil permeability and thickness c) Geology (e.g., bedrock permeability and transmissivity) d) The area of a basin receiving rainfall e) Land use and land cover (e.g., vegetation types and density, impervious areas) f) Drainage density and other river geometrics g) Duration and intensity of precipitation, and form of precipitation (rain vs. snow) h) Temperature, wind speed, time of year, and other effects on precipitation type and rates of evapo-transpiration i) Initial conditions (e.g., the degree of saturation of the soil and aquifers) j) Storage opportunities in the drainage network (e.g., lakes, reservoirs, wetlands, channel and bank storage capacity). For example Fig 1a Figure 1a Stream hydrograph. Increases in stream flow follow rainfall or snowmelt.
- 9. INDIA: HYDROLOGY PROJECT PHASE-II ______________________________________________________________________________ National Institute of Hydrology, Roorkee 9 1.1.4 Unit Hydrograph A unit hydrograph (UH) is the hypothetical unit response of a watershed (in terms of runoff volume and timing) to a unit input of rainfall. It can be defined as the direct runoff hydrograph (DRH) resulting from one unit (e.g., one cm or one inch) of effective rainfall occurring uniformly over that watershed at a uniform rate over a unit period of time. A unit hydrograph (UH) is a hydrograph of direct surface runoff resulting at a given location on a stream from a unit rainfall excess amount occurring in unit time uniformly over the catchment area up to that location. The excess rainfall (ER) excludes losses i.e. hydrological abstractions, infiltration losses from total rainfall and unit rainfall excess volume equals one mm may be considered as a standard value since rainfall is measured in mm. However, in certain cases UH is derived for one cm ER. The selection of unit time depends on the duration of storm and size of the catchment area. For example, for small catchments, periods of 1 or 2 hours can be assumed and for larger catchments, 3, 4, 6, or even 12 hours can be adopted. CWC has recommended the following for practical uses: A unit hydrograph can be interpreted as a multiplier that converts rainfall excess to direct surface runoff. The direct surface runoff (DSRO) is the streamflow hydrograph excluding base- flow contribution. Since, a unit hydrograph depicts the time distribution of flows, its multiplying effect varies with time. In real-world application, the unit hydrograph is applied to each block of rainfall excess and the resulting hydrographs from each block are added for computing direct surface runoff hydrographs, to which base-flows are further added to obtain total flood hydrographs.
- 10. INDIA: HYDROLOGY PROJECT PHASE-II ______________________________________________________________________________ National Institute of Hydrology, Roorkee 10 1.1.5 Synthetic Unit Hydrographs Synthetic unit hydrographs (SUH) are of great significance in determination of flood peak and runoff volume, especially from ungauged watersheds. Singh (1988) provided a good review of several methods dealing with the SUH derivation. The qualifier ‘synthetic’ denotes that the unit hydrographs (UH) are obtained without using watershed’s rainfall-runoff data. These synthetic or artificial unit hydrographs can be characterized by their simplicity and ease in construction. These require fewer amounts of data and yield a smooth and single valued shape corresponding to unit runoff volume, which is essential for UH derivation. In practice, an SUH is derived from few salient points of the unit hydrograph by fitting a smooth curve manually. The methods of Snyder (1938) and Espey (1974) are a few examples among others. These utilize empirical equations to estimate salient points of the hydrograph, such as peak flow (Qp), lag time (tL), time base (tB), UH widths at 0.5Qp and 0.75Qp. 1.1.6 Regional Unit Hydrograph Regional unit hydrographs are used for a catchment where sufficient flood data is not available to derive a UH. In such cases the physical and storm characteristics are used to derive the UH. The procedure used for this purpose involve the derivation of the parameters that describes the unit hydrograph for the gauged catchment and then the development of regional relationship between the unit hydrograph parameters with the pertinent physiographic and storm characteristics of the catchment. The catchments considered for such regional study has to be within a hydrologically homogeneous region. Regional parameters for the UH are developed using the information of catchments response characteristics like soil, geology and land-use based on the data available for the gauged catchments in nearby hydro- meteorologically similar regions for modeling their hydrological response. Regionalization of the parameters is, however, a very tedious task to accomplish since the hydrological behavior of many nearby catchments
- 11. INDIA: HYDROLOGY PROJECT PHASE-II ______________________________________________________________________________ National Institute of Hydrology, Roorkee 11 have to be ascertained before being confident about the values of the parameters. Generally the sequential steps that is followed to develop a regional unit hydrograph are : selection of a catchment, split sample test for the region, derivation of UH for the gauged catchments in the region, derivation of representative UH for the region, split sample test for the regional UH, development of regional UH relationships. Both physical processes based approach such as O’Kelly’s approach (1955), Nash’s approach (1960) , and Clark’s approach (1945) and empirical or regression approach such as Snyder’s approach (1938), Gray’s approach (1961), SCS method (1958), and Espey’s approach (1974) are used to develop regional UH relationships. 1.1. 7 Flood Frequency Analysis Flood frequency analyses are used to predict design floods for sites along a river. The technique involves using observed annual peak flow discharge data to calculate statistical information such as mean values, standard deviations, skewness, and recurrence intervals. These statistical data are then used to construct frequency distributions, which are graphs and tables that tell the likelihood of various discharges as a function of recurrence interval or exceedence probability. In many problems in hydrology, the data consists of measurements on a single random variable; hence we must deal with univariate analysis and estimation. The objective of univariate analysis is to analyze measurements on the random variable, which is called sample information, and identify the statistical population from which we can reasonably expect the sample measurements to have come. After the underlying population has been identified, one can make probabilistic statements about the future occurrences of the random variable, this represents univariate estimation. It is important to remember that univariate estimation is based on the assumed population and not the sample, the sample is used only to identify the population.
- 12. INDIA: HYDROLOGY PROJECT PHASE-II ______________________________________________________________________________ National Institute of Hydrology, Roorkee 12 Hydrologic processes such as rainfall, snowfall, floods, droughts etc. are usually investigated by analyzing their records of observations. Many characteristics of these processes may not represent definite relationship. For example, if you plot instantaneous peak discharges from each year for a river, a rather erratic graph is obtained. The variation of peak discharge from one year to another can not be explained by fitting a definite relationship, which we call as deterministic relationship. For the purpose of hydrologic analysis, the annual peak discharge is then considered to be a random variable. Methods of probability and statistics are employed for analysis of random variables. In this chapter, some elementary probability distributions are presented, which are used for frequency analysis in hydrology. The purpose of the frequency analysis is to estimate the design flood for desired recurrence interval assuming the sample data follow a theoretical frequency distribution. It is assumed that the sample data is a true representative of the population. It is generally seen that minimum 30 to 40 years of records are needed in order to carry out flood frequency analysis to the at site data for estimating the floods in extrapolation range, somewhat, within the desired accuracy. In case the length of records is too short, it represents inadequate data situation and at site flood frequency analysis fails to provide the reliable and consistent flood estimates. The regional flood frequency curves together with at site mean is generally able to provide more reliable and consistent estimates of floods under the inadequate data situation. For ungauged catchment, the regional flood frequency analysis approach is the only way to estimate the flood, for desired recurrence interval for which a regional relationship between mean annual peak flood and catchment characteristics is developed along with the regional frequency curves. The estimation of flood frequency curves in ungauged basins is an important field of application of advanced research concerning the knowledge on physical processes and the
- 13. INDIA: HYDROLOGY PROJECT PHASE-II ______________________________________________________________________________ National Institute of Hydrology, Roorkee 13 development of statistical tools. Regional statistical analysis and physically-consistent derivation of probability density functions (pdf) are the key fields to rely on for providing robustness to estimation of flood quantiles, and for transferring hydrological information between basins. In this context, physically consistent reasoning applied to the regional statistical analysis can be closely connected with some basis of a geomorphoclimatic approach for derivation of the flood pdf 1.1. 8 Regional Flood Frequency Approach The methods that have been outlined in section 1.2.1 and 1.2.2 uses short-term rainfall- runoff data of gauged catchments to derive a UH, and subsequently these are used to develop a regional UH. Finally, the design flood is estimated using the computed UH with the corresponding probable maximum precipitation or storm characteristics of that catchment. An alternate approach for the estimation of design flood is by statistical flood frequency analysis using the annual maximum flow data series or annual maximum series (AMS) of a catchment. In this approach, at site data together with regional data is utilized to provide most consistent and reliable flood estimates for the gauged sites with limited data records. And for ungauged sites with no record, only regional data is used for flood frequency analysis. As such there are essentially two types of models generally used in flood frequency analysis literature: (i) annual flood series (AFS) or AMS models and (ii) partial duration series (PDS) models. Regional flood frequency method explicitly incorporates a homogeneity test in the process of selecting the collection of stations that comprise the region for an ungauged site. In India regional flood frequency studies have been carried out using conventional methods such as USGS method (or index flood method), and regression based methods. Very few attempts have been made to study application of the new approaches in the studies.
- 14. INDIA: HYDROLOGY PROJECT PHASE-II ______________________________________________________________________________ National Institute of Hydrology, Roorkee 14 1.1.9 Partial Duration Series (PDS) or Peak Over Threshold (POT) Method The AMS model considers the annual maximum flood of each year in a series that has as many elements as there are years in the data record, notwithstanding that the secondary events in one year may exceed the annual maxima of other years. In some regions, annual maximum floods observed in dry years may be very small, and inclusion of these events can significantly alter the outcome of the extreme value analysis. In contrast, the PDS model avoids all these drawbacks by considering all flood peaks above a certain threshold level; hence it is also referred to as peak over threshold (POT) method. Clearly in the PDS model, more than one flood per year may be included, and exceptionally low annual maximum values that may cause problems in parameter estimation are not included. In AMS model the observed flood frequency of the annual number of exceedances are fitted with a single probability distribution function (pdf) which is eventually used to estimate recurrence flood at higher return periods. Whereas in PDS models, two distribution functions are used; one to count the number of times the flood peaks are above a pre defined threshold, and the other pdf is used to fit the flood exceedances. In the limit, when the threshold is increased, recurrence interval of large events computed using AMS and PDS models tend to converge. The PDS models are often used for flood frequency analysis (FFA) when there is a paucity of data (Madsen et al., 1994; 1995; 1997; Birikunadavyi and Rousselle, 1997; Lang, 1999; Onoz and Bayazit, 2001). 1.2 Use of Remote Sensing Techniques for Information Remote sensing can be defined as any process whereby information is gathered about an object, area or phenomenon without being in contact with it. Thus, a remote sensing device records response which is based on many characteristics of the land surface, including natural and artificial cover. An interpreter uses the element of tone, texture, pattern, shape, size, shadow, site and association to derive information about land cover. The generation of remotely sensed
- 15. INDIA: HYDROLOGY PROJECT PHASE-II ______________________________________________________________________________ National Institute of Hydrology, Roorkee 15 data/images by various types of sensor flown aboard different platforms at varying heights above the terrain and at different times of the day and the year does not lead to a simple classification system. It is often believed that no single classification could be used with all types of imagery and all scales. To date, the most successful attempt in developing a general purpose classification. The basis of using remote sensing data for change detection is that changes in land cover result in changes in radiance values which can be remotely sensed. Techniques to perform change detection with satellite imagery have become numerous as a result of increasing versatility in manipulating digital data and increasing computer power. The sun synchronous satellites have a synoptic coverage. The ground area covered by the satellite’s passes can be obtained by referring to its path and row. Sensors are devices used for making observations to operate and produce outputs, which are either representative of the observed area It has been noted over time through series of studies that Landsat Thematic Mapper is adequate for general extensive synoptic coverage of large areas. As a result, this reduces the need for expensive and time consuming ground surveys conducted for validation of data. Generally, satellite imagery is able to provide more frequent data collection on a regular basis unlike aerial photographs which although may provide more geometrically accurate maps, is limited in respect to its extent of coverage and expensive; which means, it is not often used. The procedure adopted in this project work forms the basis for deriving statistics of land use dynamics and subsequently in the overall, the findings. Remote sensing technology in recent years has proved to be of great importance in acquiring data for effective resources management and hence could also be applied to coastal environment monitoring and management (Ramachandran, 1993, Ramachandran et.al., 1997, 1998). Further, the application of GIS (Geographical Information System) in analyzing the trends and estimating the changes that have occurred in different themes helps in management decision making process.
- 16. INDIA: HYDROLOGY PROJECT PHASE-II ______________________________________________________________________________ National Institute of Hydrology, Roorkee 16 For the study, satellite images of Mahanadi sub-zones in Orissa and Madhya Pradesh states were acquired for three Epochs; 2001 and 2008. All these were obtained from National Remote Sensing Centre, Department of Space under Government of India. The images has the following format Satellite IRS-1C and Sensor LISS-3, Satellite: IRS-P6 and Sensor: LISS-3. These were used with the corresponding area toposheets some acquired from Survey of India, Dehradun and few i.e. restricted ones were used from the RS Lab, NIH Roorkee. All the details are given in the following chapters. 1.2.1 Application of Remote Sensing Technique in Hydrology I. Soil moisture estimation: Soil moisture is an integral quantity in hydrology that represents the average conditions in a finite volume of soil. In this paper, a novel regression technique called Support Vector Machine (SVM) is presented and applied to soil moisture estimation using remote sensing data. II. Drainage basin mapping and watershed modeling: A drainage basin is an extent or an area of land where surface water from rain and melting snow or ice converges to a single point, usually the exit of the basin, where the waters join another water body, such as a river, lake, reservoir, estuary, wetland, sea, or ocean. Other terms that are used to describe a drainage basin are catchment, catchment area, catchment basin, drainage area, river basin and water basin III. Measuring snow thickness: Snow is a form of precipitation, but, in hydrology it is treated somewhat differently because of the lag between when it falls and when it produces runoff, groundwater recharge, and is involved in other hydrologic processes. The hydrologic interest in snow is mostly in mid- to higher latitudes and in mountainous areas where a seasonal accumulation of a snowpack is followed by an often lengthy melt period that sometimes lasts
- 17. INDIA: HYDROLOGY PROJECT PHASE-II ______________________________________________________________________________ National Institute of Hydrology, Roorkee 17 months. During the accumulation period there is usually little or no snowmelt. Precipitation falling as snow (and sometimes rain) is temporarily stored in the snowpack until the melt season begins. The hydrologist generally wants to know how much water is stored in a basin in the form of snow. The hydrologist will also be concerned with the areal distribution of the snow, its condition and the presence of liquid water in it IV. River /delta change detection: Information about change is necessary for updating land cover maps and the management of natural resources. The information may be obtained by visiting sites on the ground and/ or extracting it from remotely sensed data. For many of the physical and cultural features on the landscape there are optimal time periods during which these features may best be observed. Remotely sensed data acquired at the fixed time interval becomes an important factor. Many researches have been undertaken to develop methods of obtaining change information. Change detected from different temporal images usually reflect natural and human activity impact each other and then can be used to study how to form the regional geographic feature. V. River and lake ice monitoring: Presence and thickness of lake ice has a significant impact on fish ecology, particularly in terms of over-wintering habitats for certain species. The Lake Ice Service team of Hatfield Consultants Ltd. will be focusing its efforts on studying the dynamics of the ice in lakes and rivers of two study sites in Ungava Bay, Northern Quebec. The Payne River on the west and George River on the eastern side of the bay are two of the main habitats for Arctic Char (Salvelinus alpinus) in the region, providing nutrition and livelihoods to local Inuit communities.
- 18. INDIA: HYDROLOGY PROJECT PHASE-II ______________________________________________________________________________ National Institute of Hydrology, Roorkee 18 VI. Flood mapping and monitoring: A constant watch was kept on the flood situation in the country through hydrological and meteorological information from various sources. Major flood/cyclones are mapped and monitored with the satellite data from optical and microwave satellites. Flood maps showing Flood Inundation information at state, district and detailed levels are generated. Flood damage statistics like district-wise flood inundated area, submerged roads & railways and submerged crop area are also estimated. VII. Irrigation canal leakage detection: Remote sensing has shown promise as a tool for quick and cost-effective detection of leaks in aqueducts (Nells,1982; Pickerill and Malthus, 1998). One limitation is the resolution which is required (within a few meters at most) in order to detect canal leakage. Earth-observing satellite systems are limited in the spatial resolution. VIII. Determining snow-water equivalent: Snow Water Equivalent (SWE) is a common snowpack measurement. It is the amount of water contained within the snowpack. It can be thought of as the depth of water that would theoretically result if you melted the entire snowpack instaneously. To determine the depth of snow using snow water equivalent and density, use the following formula: [SWE] ÷ [Density] = Snow Depth (Density must be in decimal form. For example: 25% = 0.25) IX. Snow pack monitoring / delineation of extent: Areas of the Canadian high plains, the Montana and North Dakota high plains, and the steppes of central Russia have been studied in an effort to determine the utility of space borne microwave radiometers for monitoring snow depths in different geographic areas. Significant regression relationships between snow depth and microwave brightness temperatures were developed for each of these homogeneous areas. In each of the study areas investigated in this paper, Nimbus-6 (0.81 cm) ESMR data produced
- 19. INDIA: HYDROLOGY PROJECT PHASE-II ______________________________________________________________________________ National Institute of Hydrology, Roorkee 19 higher correlations than Nimbus-5 (1.55 cm) ESMR data in relating microwave brightness temperature to snow depth. It is difficult to extrapolate relationships between microwave brightness temperature and snow depth from one area to another because different geographic areas are likely to have different snowpack conditions. 1.3 PARAMETER ESTIMATION USING OPTIMIZATION METHODS The procedure proposed here for estimating the parameters of models used for this study is a combination of regression and an iterative procedure. During the last two decades, the tools that engineers and scientists work with have improved significantly. The rapid growth of computing power has enabled the researchers to develop effective modeling tools. An improved parameter estimation procedure has been developed by using optimization techniques and applied to estimate the parameters of the probability distribution function (pdf) and the cumulative distribution function (cdf). As a result, an improved estimation method was found. These approaches are generally used for calibrating fold frequency analysis for calculating return period flood and sometimes in ungauged and partially gauged basins when we use peak over threshold methods. Though distributions with more parameters can better fit data sets of different patterns, the associated parameter estimates often have large standard errors which result in wide confidence intervals for the quantile estimates. Furthermore, such distribution function may be difficult to express in a close inverse form of the cumulative distribution function, giving rise to problem in parameter estimation by maximum likelihood (ML) and probability weighted moment (PWM) methods. The analytical expressions of variance of the T- year event estimates using method of moments (MOM), method of maximum likelihood, and probability weighted moment estimation methods are checked using Monte Carlo experiments and optimization techniques by minimizing both the relative root average square error.
- 20. INDIA: HYDROLOGY PROJECT PHASE-II ______________________________________________________________________________ National Institute of Hydrology, Roorkee 20 In case of unit hydrograph derivation for flood computing analysis, most of the available methods for synthetic unit hydrograph (SUH) derivation involve manual, subjective fitting of a hydrograph through few data points. Because of cumbersome trials involved, the generated unit hydrograph is often left unadjusted for unit runoff volume. Two approaches are generally followed for deriving a UH from recorded flood hydrograph and simultaneous rainfall records. The first one is a non-parametric approach based on a discretization technique, i.e., determination of a model at a finite number of discrete points. This includes the least square method (Snyder, 1955), matrix inversion (Eagleson et al., 1966), linear programming (Collins, 1939), non-linear programming (Mays and Taur, 1982), and recently Yang and Han (2006) used a transfer function method for this purpose. The second one is a parametric approach that fits some prescriptive functional curves with limited number of parameters, and these parameters are estimated by means of optimization using an objective function. For instance, Nash (1959) derived an IUH based on the concept of n-linear reservoirs of equal storage coefficient, and showed that the shape of IUH can be represented by a two-parameter Gamma distribution (2PGD). This study uses three methods viz, non-linear optimization, Neuro-Fuzzy and Neural networks for estimating the parameters. 1.4 GAPS Several methods for synthetic unit hydrographs are available in the literature. Some of them like Snyder (1938), Gray (1961), and SCS (1957) involve manual, subjective fitting of a hydrograph through few data points. Because it is difficult, the generated unit hydrograph is often left unadjusted for unit runoff volume. Some probability distribution functions (pdf) has the flexibility in shape (skew on both sides) similar to an UH, and area under its curve is unity which are pre requisite for any UH. In spite of these properties, very few studies are found in literature that have focused and explored the potentiality of probability distribution functions
- 21. INDIA: HYDROLOGY PROJECT PHASE-II ______________________________________________________________________________ National Institute of Hydrology, Roorkee 21 (pdf) to develop a synthetic unit hydrograph. In some cases theses might yield more SUH more conveniently and accurately than the popular methods. The procedure of developing a regional unit hydrograph is similar to that adopted for a SUH, the only difference being the former is a used universally and the later is for a region; hence a regional unit hydrograph can be used for an ungauged catchment in a hydrologically homogeneous region for which it is developed. Different approaches are followed for regional UH development such as Snyder’s approach (1938), Gray’s approach (1961), SCS method (1958), Espey’s approach (1974), O’Kelly’s approach (1955), Nash’s approach (1960) , and Clark’s approach (1945). The first four approaches are purely synthetic methods where the flow data of all the gauging sites in the region are analyzed in order to evolve suitable relationship between UH parameters and catchment characteristics. Though the relationships for these synthetic methods were initially developed for a specific region (Viessman et al., 1989), they are universally used in spite of the inbuilt errors they carry in predicting the overall shape of the UH. In methods given by O’Kelly, Nash, and Clark, the parameters of the corresponding conceptual models are determined for gauged basins in the region and subsequently relationships established between parameters and catchment characteristics. In applying these methods, it is always necessary to validate these relationships for a new time period and for additional gauged catchments which are not considered for their development. Keeping these constraints in view, there is need for improving the accuracy of the results by including latest conceptual models for SUH derivation and also to simplify the parameter estimation technique of these models for a region, which will permit their unique definition from basin characteristics and eliminates the need for model calibration with streamflow records.
- 22. INDIA: HYDROLOGY PROJECT PHASE-II ______________________________________________________________________________ National Institute of Hydrology, Roorkee 22 Regional flood frequency is advantageous when the sites forming a region have similar frequency distribution. In practice, however, available sample size is usually not large enough to unequivocally identify the frequency distribution. Therefore, most regional flood frequency analysis procedures fit to the data a distribution whose form is specified apart from a finite number of undetermined parameters. Over the years, researchers world wide have suggested the use of regional regression to improve the estimation of normalized flood quantiles used in the IF method. Zrinji and Burn (1994) and Burn et al. (1997) presented a framework for regional flood frequency analysis using region of influence (ROI) that is applicable for estimating extreme flow quantiles at ungauged catchments. However, in heterogeneous regions, when a particular site has substantially different characteristics from the rest of the region or in circumstances where the record length of data is short at gauge of individual sites, ROI is difficult to apply. Further, in areas where there are few gauged sites, it may be difficult to identify enough homogeneous sites to apply regional flood frequency methods. Partial duration series (PDS) or Peak over threshold (POT) models generally employ a Poisson distribution (PD) to count for the number of annual flood exceedances above threshold, and a generalized pareto distribution (GPD) which has the exponential distribution (ED) as a special case is used to fit the flood exceedances (e.g., Davison and Smith, 1990; Rosbjerg et al., 1992; Madsen et al., 1994; 1995; 1997). However, a criticism against use of PD for estimating the number of floods exceeding a threshold is that the number of peaks occurring each year was not a Poisson variate since its variance was significantly greater than its mean which violates the basic assumption of PD (NERC, 1975; Cunnane, 1979). Onoz and Bayazit (2001) observed that in certain cases the variance of observed number of exceedances is significantly different, usually larger than the mean. In most cases the annual number of occurrences of peaks above a threshold has a variance larger than its mean. Similarly the advantage of ED over other
- 23. INDIA: HYDROLOGY PROJECT PHASE-II ______________________________________________________________________________ National Institute of Hydrology, Roorkee 23 distributions in fitting the flood exceedances is that it has a single parameter that is to be estimated, and in some cases, it gives a more precise prediction of the T-year return period event (Rosbjerg et al., 1992) ,however the demerit is its inability to accommodate its shape to provide a good fit across many data sets due to the single parameter and its lack of memory property that makes the distribution insensitive in the upper tail (Montgomery and Runger, 1994). Though distributions with more parameters can better fit to the data set of any shape, the associated parameter estimates often have large standard errors which result in wide confidence intervals for the quantile estimates. Furthermore, the distribution function is difficult to estimate in a close (inverse) form giving rise to problem in parameter estimation. 1.5 OBJECTIVES 1. To calibrate and validate an event based model based on unit hydrograph approach analyzing the available data of flood events for the gauged catchments in the region. 2. To identify few robust flood frequency distributions that may be used for the computation of return period flood for the gauged catchments in the region. 3. To develop regional flood formulae using statistical correlation of the observed peak characteristics with important catchment and storm characteristics, for the estimation of the peak, and time to peak for the ungauged catchments in the region. 4. To develop regional unit hydrograph, and regional flood frequency analysis procedures utilizing the available data and methodologies. 5. To develop methodology for the regionalization of the hydrological parameters for the computation of the water availability for the ungauged catchments in the region.
- 24. INDIA: HYDROLOGY PROJECT PHASE-II ______________________________________________________________________________ National Institute of Hydrology, Roorkee 24 CHAPTER 2 STUDY AREA AND STREAM MORPHOLOGY 2.0 MAHANADI RIVER SYSTEM Mahanadi is a major sedimentary basin located along the east coast of India. Mahanadi sub zone 3(d) (CWC, 1997) is located between22 800 25'N - 870 E longitude 190 15'- 230 35'N latitude. It extends over an area of 141,589 km which is nearly 4.3% of total geographical area of the country. Mahanadi River rises from the district of Madhya Pradesh and flows about 851 km before it joins the Bay of Bengal (Fig 2.1a). The Mahanadi River flows slowly for 560 miles (900 km) and has an estimated drainage area of 51,000 square miles (132,100 square km). The area of the drainage basin is 141,464 km². The interior coastal plain has a relatively low elevation. The average elevation of the drainage basin is 426 m, with a maximum of 877 m and a minimum of 193 m. The average elevation of the drainage basin is 426 m, with a maximum of 877 m and a minimum of 193 m. The bulk of the precipitation is in the July to September period [800 to over 1200 mm] with January to February precipitation of less than 50 mm. The average discharge 2,119 m3 /s (74,832 cu ft/s) - max 56,700 m3 /s (2,002,342 cu ft/s). It deposits more silt than almost any other river in the Indian subcontinent. The Mahanadi river basin lies north-east of Deccan plateau. Mahanadi basin is bounded on the North by the Central India hills, on the South and east by the Eastern Ghats and on the west by the Maikala range. The upper basin is a saucer shaped depression known as Chhattisgarh. The basin is circular in shape with a diameter of about 400 km and an exit passage of about 160 km long and 60 km wide. There are four well defined physical regions in the basin viz.: (i) The Northern plateau, (ii) The Eastern Ghats, (iii) The Coastal plains and (iv) The Erosional plains of the Central table Land. The Northern plateau and Eastern Ghats are well forested hilly regions. The coastal plains stretching over the districts of Cuttack and Puri cover
- 25. INDIA: HYDROLOGY PROJECT PHASE-II ______________________________________________________________________________ National Institute of Hydrology, Roorkee 25 the large delta formed by the river Mahanadi and is a fertile area well suited for intensive cultivation. The erosional plains of the Central Table Land are traversed by the river Mahanadi and its tributaries. Figure 2.1a Showing the area covered by Mahanadi Basin The Mahanadi is one of the major peninsular rivers of India draining into Bay of Bengal. It rises in a pool, 6 km from Pharsiya village near Nagri town in Raipur district of Chhattisgarh State at an elevation of 457 m. The Mahanadi splits into several streams just before falling into the Bay of Bengal. The total length of the river is about 851 km out of which 357 km is in Chhattisgarh and 494 km is in Orissa. The important tributaries of river Mahanadi are: (i) Sheonath, (ii) Jonk, (iii) Hasdeo, (iv) Mand, (v) Ib, (vi) Tel, and (vii) Ong. The drainage area of the Mahanadi is 141589
- 26. INDIA: HYDROLOGY PROJECT PHASE-II ______________________________________________________________________________ National Institute of Hydrology, Roorkee 26 Figure 2.1b River system and Observatory sites under Hydrology project in Mahanadi basin. km 2 extending in Madhya Pradesh (107 km 2 ), Chhattisgarh (75229 km 2 ), Orissa (65889 km 2 ), Maharashtra (238 km 2 ) and Jharkhand (126 km 2 ) States. The proposed Mahanadi region study
- 27. INDIA: HYDROLOGY PROJECT PHASE-II ______________________________________________________________________________ National Institute of Hydrology, Roorkee 27 pertains to the basin that is inside the state of Orissa. The catchment area of the Mahanadi up to Nimapara observatory site is 65628 km 2 . Figure 2.1c River system and Observatory sites under Hydrology project in Brahmani basin.
- 28. INDIA: HYDROLOGY PROJECT PHASE-II ______________________________________________________________________________ National Institute of Hydrology, Roorkee 28 Figure 2.1d River system and Observatory sites under Hydrology project in Rushikulya basin. 2.1 Mahandi-Brahmani-Rushukulya River Basin The Brahmani is formed by the confluence of the rivers South Koel and Sankh near the major industrial town of Raurkela at 22 15'N and 84 47' E.. It is the second largest river in Orissa. The Brahmani Basin lies between latitude 20° 28' to 23° 35' N and longitude 83° 52' to 87° 30' E in the in the states of Orissa, Chhattisgarh, and Jharkhand .Both of these sources are in the Chota Nagpur Plateau. Brahmani basin is situated between Mahanadi Basin (on the right) and Baitarani Basin (on the left). It then passes the town of Bonaigarh in Angul district before
- 29. INDIA: HYDROLOGY PROJECT PHASE-II ______________________________________________________________________________ National Institute of Hydrology, Roorkee 29 being dammed at Rengali. A large reservoir of the same name is created as a consequence. It then flows through the cities of Talcher and Dhenkanal before splitting up into two streams. The branch stream called Kimiria receives the waters of the Birupa (a distributary of the Mahanadi, Kelo and Genguti before re joining the main stream at Indupur. A distributary called Maipara branches off here to join the Bay of Bengal. At about 480 km long, the Brahmani is the second longest river in Orissa after the Mahanadi. However if its constituent rivers are included its length extends to about 799 km, 541 of which is in Orissa. It has a catchment area of about 39,033 km2 in Orissa. The river system and observatory sites are given in Figure 2.1 b. The Rushikulya rises from the Rushyamala hills of the Eastern Ghats in Kandhamal district and flows in the south east direction and falls into the Bay of Bengal near Chatrapur. It has no delta in its mouth and the total catchment area: 8,963 Km2 . There are several streams between the river Mahanadi and Rushikulya flowing east and draining into Chilika Lake i.e. lake under Bay of Bengal. The basin is roughly fan shaped and is undulating and sloping hillocks and eroded mounds. The entire area can be grouped under flat plains with isolated hills and long ridges. There are several streams flowing between Mahanadi and Rushikulya river systems and draining into the Chilika Lake. The important streams are: (i) Todinala, (ii) Dultal dhara nadi, (iii) Kharia or Khaljhor nadi, (iv) Kusumi nadi, (v) Salia nadi and (vi) Khalhor nadi. The river system and observatory sites are given in Figure 2.1 c. 2.1.1 Topography Mahanadi is a major sedimentary basin located along the east coast of India (Figure 2.1a), and rises from the district of Madhya Pradesh and flows about 851 km before it joins the Bay of Bengal. The area that is covered in the state of Orissa is 65628 km 2 . The length of the stream along Orissa is 494 km and the Mahanadi River system i.e. Mahanadi, Brahmani,
- 30. INDIA: HYDROLOGY PROJECT PHASE-II ______________________________________________________________________________ National Institute of Hydrology, Roorkee 30 Baitarani and Dhamara rivers with a sediment load to the basin of the order of 7.10 x 10⁹ kg/yr (Subramanian, 1978). Mahanadi River Delta encompasses an area of 0.1 km, which counts nearly 4.3% of the total geographical area of the country. The geography of Mahanadi River is credited for irrigating a fertile valley where crops of rice, oilseed, and sugarcane are grown. 2.1.2 Geology Geographically, the delta of River Mahanadi can be divided into four zones, namely, the Northern Plateau, the Eastern Ghats, the Coastal Plain and the Erosional Plains of Central Table Land. The first two zones are the hilly regions, while the coastal plain is the central interior region of the delta, which is traversed by the river and its tributaries. The main soil types found in the basin are red and yellow soils, mixed red and black soils, laterite soils and deltaic soils. Mahanadi basin predominantly consists of Archaean rocks represented by folded Khondalites, Granite gneisses and Charnockite. They are inter banded and the first two appear to grade into one another. Field relationship of these rocks is complex and it is difficult to assign any age relationship. It is generally agreed that the rocks were deposited during Archaean era (2000 - 2500 Million years) and were folded and metamorphosed by at least two tectonic activities. The rocks have experienced metamorphic conditions of amphibolites to granulate fancies. Magmatization appears to have played a major role in resulting present State of rocks. The area has been reported to have experienced block faulting during Gondwana times and area upstream of Badmul appears to be a Graben. The area of the basin covering the streams between Mahanadi and Rushikulya mostly comprises of consolidated gneiss rock formation and semi- consolidated tertiary sedimentary. Alluvium is also found in the catchment. Alluvial track extends almost to entire length of coastal area. Groundwater is available in the region of alluvium in the confined and unconfined aquifers below 300 m.
- 31. INDIA: HYDROLOGY PROJECT PHASE-II ______________________________________________________________________________ National Institute of Hydrology, Roorkee 31 2.1.3 Hydrogeology Annual, seasonal, monthly and daily variation in the water and sediment discharge in the Mahanadi River is as follows: the water discharge varies from 9.61 to 1809.71 m3 s−1 and the total suspended matter varies from 130 to 806 mg l−1 . The smaller tributaries upstream carry higher sediment concentration. No yearly cyclic pattern in the water flow in the basin is noticed. More than 95% of the sediment discharge takes place in the monsoon, of which the discharge during July, August and September is 90% of the annual total. On certain days of the year, the sediment discharge accounts for 10–15% of the total annual load. Water discharge, rainfall, geology of the basin and the smaller tributaries upstream seem to control the bulk of the sediment discharge. The Mahanadi annually delivers 15.74 million tonnes of sediment to the Bay of Bengal and more than 80% of the sediment load is carried in the coarse silt fraction. Bulk of suspended sediment is carried in fine fraction. Its mineralogy is characterized by clay minerals illite, kaolinite, smectite and chlorite in addition to quartz and felspar. The river annually transports a cumulative load of 33.59 million tons into the Bay of Bengal. The dissolved load constitutes less than 25% of the total. Present study reveals that Mechanical load is strongly correlated with discharge, elevation and area while a weak correlation exists between bed slope and mechanical load. The ratio of mechanical to chemical erosion rate an index of erodibility of the basin seems to be related to rock type in the catchment area. Higher values of erodibility index correspond to higher elevations, lesser area and hard silicate rocks of sub basins. On the other hand, sub-basins with low to moderate elevation and chemically active sedimentary rocks are characterized by low values. The river has registered 14% decrease in sediment load transport over a decade due to anthropogenic activities.
- 32. INDIA: HYDROLOGY PROJECT PHASE-II ______________________________________________________________________________ National Institute of Hydrology, Roorkee 32 2.1.4 Climate The Mahanadi River Basin is located in the monsoon region of India, and its mean annual flow is 66,640 million m3 . An earlier study revealed that the surface air temperature over the basin has increased at a rate of 1.1 C° per century, which is highly significant, however, there has been no considerable change in the precipitation regime, though a slight decreasing trend is observed. In this study, an analysis of the trends in the runoff of the upper catchment and the whole catchment gauged sites is presented. The results show a steady decrease in the river flows at some locations during the 30 year period of the study; this is significant statistically at the 1 per cent level. In order to increase confidence in this result, the time series of these indices also show a clear declining trend during the period 1901–80. The main result obtained here is that climate warming that occurred over the basin, without being offset by an increase in precipitation (in fact a slight decrease in precipitation was observed), has resulted in a gradual decrease of river flows of the upper catchment as well as of the entire basin during the period 1970–1998. Nevertheless, it is hoped that recent efforts toward development of nested regional climate models may soon make it possible to have acceptable climate simulations for regions and sub regions of this scale. The results of this article may be useful at that stage in hydrological forecasting studies for the basin. About 90% of the annual rainfall is received during the monsoon period, i.e. from July to October. The average maximum and minimum temperatures are 29 °C and 21°C respectively. The temperature at Raipur varies from 12-42 °C and Cuttack is 14 – 40 °C. The monthly mean relative humidity data of the basin (for five IMD stations) show that the maximum and minimum values of humidity are 95% and 9% during monsoon and summer seasons respectively. The maximum and minimum wind velocities are 16.1 km/hr and 1.0 km/hr respectively at Cuttack and Puri districts. Usually the maximum cloud cover is observed during the months of July or
- 33. INDIA: HYDROLOGY PROJECT PHASE-II ______________________________________________________________________________ National Institute of Hydrology, Roorkee 33 August whereas minimum cloud cover is observed during December. The monthly average coefficients of sunshine vary from 0.469 and 0.736. The monthly average evaporation at Cuttack varies from 3.0 cm (in December) to 7.5 cm (in May). 2.1.5 Rainfall Besides the raingauge stations maintained by IMD, there are about 200 observatory stations maintained by state and Hydrology Project within whole Mahandi basin. Salient raingauges available recently for the upper and lower Mahanadi region is given in Table 2.1. The normal annual rainfall of the Mahanadi catchment is 141.7 cm. The maximum, minimum and the average annual weighted rainfall values are computed to be 3669.8 mm (Bulandarpara in 1944), 660.0 mm and 1458 mm respectively for the period from 1901 to 2008. Figure 3.1(a-c) in the next chapter discuss in details about the number of rain gauge stations that exist in and around Mahanadi maintained by IMD, CWC and state observatory. 2.1.6 Gauging and Discharge (GD) Sites in Mahanadi, Brahmani and Rushukulya basins Given the large size of the Mahanadi basin and plenty of available water, it is natural that a number of projects have been constructed for utilization of these resources. For this study three types of runoff data are used: (i) monthly runoff series, (ii) Annual maximum series (AMS), and (iii) short –term (hourly) data. Monthly data is used for water balance, consistency check, and rainfall-runoff modeling and the annual maximum data are used for return period flood estimations using AMS modeling. All the runoff (daily, monthly average) were collected from CWC and some of the dat was also collected during tours from state hydrometry (Director of Hydrometry, Water Resources Department, Govt. of Orissa). The salient floods in thirty nine gauging sites attempted in this study is briefly given in Table 2.2 (a-b).
- 34. INDIA: HYDROLOGY PROJECT PHASE-II ______________________________________________________________________________ National Institute of Hydrology, Roorkee 34 Table 2.1 Rain gauge stations in Mahanadi Zone (R/F is daily mean rainfall in MM) STATION R/F STATION R/F STATION R/F STATION R/F Upper Mahanadi Basin Ambabehna Dharmjaygarh 8.2 Kurubhatta 10.6 Sankara 1.4 Ambikapur 0.0 Ghatora 12.2 Laikera 46.0 Saradihi 43.8 Andhiyokore Ghorari 25.8 Manedragarh 3.8 Seorinarayan 2.6 Baikanthapur 0.0 Hemgir 14.0 Mahupalli 19.2 Simga 17.8 Bamandini 0.8 Jagadalpur 6.2 Nandaghat 3.0 Sundergarh 31.6 Bangodam 4.2 Jamadarpalli 24.8 Nuapara Surajgarh 10.6 Bargaon 16. Jamankira 22.6 Paramanpur 6.8 Tarapur 0.0 Basantpur 8.0 Jharsuguda 4.6 Pendraraoad 0.6 Thettang 3.8 Boranda 8.2 Kelo 4.0 Raipur 23.6 Champua Korba 0.2 Rajim 6.2 Deogan 6.0 Kuchinda 23.6 Rampur 2.6 Lower Mahanadi Basin Alipingal 63.6 Daspalla 38.4 Mundali 40.0 Salebhatta 16.2 Armpur 37.2 Dunguripali Naraj 43.0 Sambalpur 18.2 Athagarh 68.0 Gop 31.0 Naringhpur 33.0 Sohela Athamalik 30.4 Harabhanga 19.0 Nayagarh 51.0 Sonepur 15.0 Baliguda 18.0 Hirakud 14.6 Nimapara 46.2 Tangi 38.0 Banapur 37.0 Jaipatna 35.0 Padmapur Tikabali 43.0 Khandapada 71.0 Junagarh 56.0 Padmavati 86.4 Tikarpara 53.0 Barmul 29.6 Kakatpur 68.0 Paikamal Titilagarh 3.4 Belgaon 16.4 Kantamal 22.0 Paradeep 162.0 Pipiii 4.2 Bhawanipatna 48.0 Kendrapara 75.0 Patnagarh Bhubaneshwar 50.6 Kesinga 12.6 Jatamundai 94.0 Bijepur Kairmal 15.1 Phulbani 15.2 Bolangir 34.0 Khriar 43.0 Puri 48.8 Boudhraj 20.0 Komna 98.6 Rairakhol 19.0 Burla 14.6 Lanjgarh 105.0 R.K.Nagar 22.6 Cuttack 37.8 M.Rampur 112.0 Ranpur 34.4 In spite of water management through various dams, diversion works like weirs and channels, flooding is caused primarily due to the Mahanadi River so far as Orissa is concerned. The entire deltaic region of Mahanadi River beyond Munduli Barrage intercepting a catchment of 48700 sq km (Mishra and Behera, 2009) gets affected by medium to severe flood almost every year causing immense loss to life and property. In addition, a study on historic flood events in Mahanadi Delta (1969 to 2011) reveals that 69% major floods are caused due to contribution from downstream uncontrolled catchment beyond Hirakud reservoir.
- 35. INDIA: HYDROLOGY PROJECT PHASE-II ______________________________________________________________________________ National Institute of Hydrology, Roorkee 35 Table 2.2a Gauging Discharge sites maintained by CWC on Mahanadi basin and nearby regions. Sr. N. District Cat. Area (sq Km) River Name / Tributary Type Period Latitude/ Longitude Length of Stream (Km.) 1 Anandpur Keonjhar 8570 Baitarani 1972-2009 21 12 40-86 07 21 76 2 Altuma Dhenkanal 830 Brahmani / Ramiyal 1990-2009 20 55 01-85 31 08 265 3 Champua Keonjhar 1710 Baitarani 1990-2009 22 03 57-85 40 56 76 4 Gomlai Sundargarh 21950 Brahmani 1979-2009 21 48 00-84 57 30 52 5 Jaraikela Sundargarh 9160 Brahmani/ Kelo 1972-2009 22 19 08-85 06 19 49 6 Jenapur Jaipur 33955 Brahmani 1980-2009 22 55 00-86 00 00 276 7 Pamposh Sundargarh 19448 Brahmani 2000-2009 22 10 00-84 50 00 89 8 Talcher Angul 29750 Brahmani 1986-1996 20 57 00-85 15 00 174 9 Kantamal Boudh 19600 Mahanadi / Tel 1990-2009 20 38 49-83 43 45 115 10 Kesinga Kalahandi 11960 Mahanadi / Tel 1979-2009 20 11 15-83 13 30 94 11 Salebhata Bolangir 4650 Mahanadi / Ong 1973-2009 20 59 00-83 32 30 49 12 Sundargarh Sundargarh 5870 Mahanadi / IB 1972-2009 22 15 45-84 03 00 142 13 Sukuma Bolangir 1365 Mahanadi / Tel / Suktel 1989-2003 20 48 30-83 30 00 14 Tikerpada Bolangir Mahanadi / Tel 2000-2009 89 Table 2.2b Details of the 25 small catchments taken from CWC (1997) report Sl. No. Bridge No. Name of Stream Name of Section Period Location Catchment Area (Sq. Km.) Latitude/ Longitude 1 7 Bhadon Jharsuguda – Titlagarh 1957-1986 21 47 06-84 02 00 3108 2 121 Kelo Jharsuguda – Bilaspur 1966-1986 21 57 45-83 18 18 1150 3 489 Karo Bondamunda – Ranchi 1967-1986 22 58 24-84 56 36 0823 4 12 Lilagar Kharagpur – Nagpur 1958-1989 22 02 00-82 20 00 0666 5 195 Jira Sambalpur - Titlagarh 1977-1986 21 16 00-83 38 18 0615 6 235 Ranjhor Sambalpur - Titlagarh 1976-1989 21 07 48-83 35 12 0312 7 332 (ii) Parri Raipur – Nagpur 1965-1986 21 06 36-81 03 48 0225 8 385 Sandur Raipur – Viziram 1966-1989 20 04 36-83 21 00 0194 9 69 Borai Jharsuguda – Bilaspur 1977-1989 22 00 36-82 58 42 0173 10 59 (B) Karwar Kharagpur – Nagpur 1967-1989 22 01 00-82 53 42 0136 11 698 Bisra Bondamunda – Nagpur 1965-1989 22 15 18-84 57 12 0113 12 48 Barajhor Nergundi – Talchir 1957-1989 20 41 00-85 35 12 0109 13 79 Kisindajh Nergundi – Talchir 1957-1986 20 49 06-85 17 24 0067 14 37 Barajhor Nergundi – Talchir 1967-1989 20 34 36-85 43 48 0064 15 154 Aherajhor Kharagpur – Nagpur 1968-1986 21 51 38-83 41 35 0058 16 59 (S) Dungajhor Kharagpur – Nagpur 1957-1989 22 08 13-84 25 37 0047 17 139 Karo Rajkharaswar – Gua 1957-1989 22 15 10-85 25 00 0374 18 90 Phaljhor Bhilai – Dhallirajhare 1975-1986 20 50 12-8117 00 0193 19 332 (i) Pitakalia Kharagpur – Walter 1966-1989 21 14 48-86 38 24 0175 20 66 (K) Hailania Bilaspur - Katni 1958-1986 22 40 00-81 56 00 0154 21 478 Gokana Bilaspur – Raipur 1957-1989 22 03 12-82 08 24 0144 22 25 Nun Kharagpur – Puri 1957-1986 20 03 30-85 45 00 0132 23 40 (K) Sargood Bilaspur - Katni 1966-1989 22 32 54-81 56 42 0115 24 176 Sildana Raipur - Vizanagram 1957-1986 20 50 48-85 32 24 0066 25 42 Barjhor Nergundi - Talchir 1970-1989 20 37 10-85 39 00 0049
- 36. INDIA: HYDROLOGY PROJECT PHASE-II ______________________________________________________________________________ National Institute of Hydrology, Roorkee 36 2.1.7 Major Projects and Previous Studies In the context of flood scenario, the Mahanadi system can be broadly divided into two distinct reaches: (i) Upper Mahanadi (area upstream of Mundili barrage, intercepting a catchment of 132100 sq km) (Mishra and Behera, 2009, which does not have any significant flood problem (ii) Lower Mahanadi (area downstream of Mundili barrage, intercepting a catchment of 9304 sq km). The key area downstream of Hirakud up to Munduli intercepting a catchment of 48700 sq km is mainly responsible for flood havoc in the deltaic area of Mahanadi. Figure 1 shows the details of catchments of Mahanadi Basin inside and outside of Orisssa and Figure 2 shows the schematic diagram of Mahanadi lower reach beyond Munduli up to Bay of Bengal respectively. Catchment degradation in its various forms continues without effective control measures due partly to uncertainty regarding the adverse effects on water resources. This uncertainty again arises from lack of adequate hydrological data that should enable quantification of effects of specific land use practices on quality and quantity of water resources. In addition, floods and droughts occur with frequencies and magnitudes that are poorly defined in Mahanadi basin because of lack of relevant hydrological data. Lack of adequate hydrological data introduces uncertainty in both the design and management of water resources systems. Much of Mahanadi sub-basins i.e. has as a result of low conversion of rainfall to runoff a precarious balance between available water resources and water
- 37. INDIA: HYDROLOGY PROJECT PHASE-II ______________________________________________________________________________ National Institute of Hydrology, Roorkee 37 Figure 2.1e Details of Catchments of Mahanadi System inside and outside of Orissa (Source: Parhi et al. 2009) demand. Given below (Table 2.2.) briefly gives the small catchments and gauging sites that are being maintained and some data are available for further studies. These have been considered for this study with additional data collected from Director of Hydrometry, Government of Orissa. The major existing/ ongoing projects in the Mahanadi basin while in the upper Mahanadi-basin the existing projects are mostly of medium and small in size except two major projects. The major project in the upper Mahandi basin is Hirakud and Ravishankar Sagar dams. The Saroda and Indravati storage reservoir forms a part of the lower sub-basin also. The details rather in brief are summarized here below. Hirakud Dam Hirakud is one of the earliest and prestigious major multi-purpose river valley projects in India after independence. Commissioned in 1957, the reservoir is situated a little downstream of the confluence of Mahanadi with its tributary Ib, 15 km upstream of Sambalpur town. Situated
- 38. INDIA: HYDROLOGY PROJECT PHASE-II ______________________________________________________________________________ National Institute of Hydrology, Roorkee 38 within the geographical ordinates of 21° 30' and 21° 50' N, and 83° 30' and 84° 05' E, the reservoir has a water spread area of 719.63 km2 at FRL. The 1,248 m long masonry dam is 61 m high and this, along with the earthen dams, has a combined length of 25.8 km. At the dam site, the maximum annual runoff was 91,900 Mm3 while the minimum annual runoff was 12,400 Mm3 . The total catchment area up to the dam is 83,400 km2 . With gross storage capacity of 5,818 Mm3 , this is one of the biggest reservoirs. The spillway capacity at FRL is 41,428 cumec. The average annual rainfall in the region is 152 cm. More than 65% of the vast catchment area stretching over the central Indian plateau is fertile land area. The project has been designed to serve three purposes, namely flood control, irrigation and power. In addition it was planned to supplement supplies to the old irrigation system in the Mahanadi delta. Now, the reservoir serves the irrigation needs of 2,640.38 km2 of land. The water released through power house irrigates further 4,360 km2 of CCA in Mahanadi delta. A hydropower plant at the dam has 307.5 MW of installed capacity. Besides, the reservoir produces a fish crop of 350 ton every year. The reservoir space is also used to provide flood protection to 9,500 km2 of delta area in district of Cuttack and Puri. Table 2.3 Salient features of Hirakud reservoir Elevation at FRL 192.024 m Elevation at DSL 179.830 m Gross storage capacity 8,136 Mm3 Live storage capacity 5,818 Mm3 Dead storage capacity 2,318 Mm3 Water spread area at FRL 719.63 km2 Length of the masonry dam 1,248 m Number of sluices 64 Number of crest gates 34 Crest level of spillway dam 185.928 m Maximum spillway capacity 41,428 cumec
- 39. INDIA: HYDROLOGY PROJECT PHASE-II ______________________________________________________________________________ National Institute of Hydrology, Roorkee 39 Ravishankar Sagar The Ravishankar Sagar project (RSP) dam was constructed in 1978 on the Mahanadi River, at 20° 38' N, 81° 34' E. RSP is about 92 km south of the city of Raipur. It is a multi- purpose reservoir which serves irrigation, hydro-electric power-generation and the industrial requirements of the Bhilai Steel Plant. At the FRL of 348.7 m, the reservoir surface area is 95.40 km2 . The total catchment area is estimated at 3,620 km2 , of which 625 km2 is intercepted by the upstream dam, Dudhawa and 486 km2 by Murumsilli reservoir. At full level, the reservoir storage capacity is 909 Mm3 . The maximum depth of the reservoir is about 32 m. The off-taking channels carry water in the order of 11,000 to 30,000 cumec in the peak season. However, the outlets are rarely completely closed. Water level fluctuates by 3 to 5 m in a year. The sediments of Ravishankar Sagar are poor in nutrients and organic matter. Dudhawa Reservoir The Dudhawa reservoir is situated at 81° 45' 21" E longitude and 20° 18' 1" N latitude across Mahanadi River near Dudhawa village about 21 km west of Sihawa near the origin of Mahanadi river and 29 km east of Kanker. The reservoir is in Dhamtari district of Chhattisgarh state. The construction of the project started in 1953-54 and it was commissioned in 1963-64. This reservoir is designed to supply water to Ravishankar Sagar Project complex thereby increasing its irrigation potential. Water will also be provided to additional culturable areas under the command of the existing Mahanadi Tandula canal system. The maximum height of this earthen dam is 24.53 m and length is 2,906.43 m. Two subsidiary bunds of the dam have heights of 6.61 m and 2.83 m and lengths 568.42 and 426.70 m, respectively. The catchment area of the reservoir is 625.27 km2 and gross command area is 566.80 km2 . At the Full Reservoir Level (FRL), the submergence area of the reservoir is 44.80 km2 .
- 40. INDIA: HYDROLOGY PROJECT PHASE-II ______________________________________________________________________________ National Institute of Hydrology, Roorkee 40 Figure 2.2 Projects status on Mahanadi Basin Sondur Reservoir The Sondur reservoir is constructed at 82° 6' E longitude and 20° 14' N latitude across Sondur River a tributary of Mahanadi. Located near Gram Machka, Nagri block, Dhamtari district of Chhattisgarh state, the dam was constructed in the year 1988. The catchment area of Sondur River up to the dam site is 518 km2 . Major portion of the catchment lies in Dhamtari district of Chhattisgarh and Koraput district of Orissa state. Sondur project comprises of a 3.33 km long composite dam. This consists of a 191.25 m long masonry dam at the center which
- 41. INDIA: HYDROLOGY PROJECT PHASE-II ______________________________________________________________________________ National Institute of Hydrology, Roorkee 41 includes overflow and non overflow portions; the rest is earthen dam at both the flanks. The spillway has 5 radial gates of size 15m 10m each. Irrigation sluice is provided at the left flank. The project is also designed to supply water to RSP complex through Dudhawa reservoir thereby augmenting the irrigation potential of RSP complex for irrigation. It would also provide irrigation to about 122.60 km2 of Kharif and Rabi crops in Sihawa Nagri block. The designed rate of sedimentation in gross storage is 0.357 mm /year. Anicuts built on Mahanadi and Baitarani Systems are functional as part of Orissa Canal system, which currently irrigates 3,500 km2 in Mahanadi and Baitarani basins mostly and also in Brahmani basin by exporting water from Mahanadi. Two of the canals of “Orissa Canal System” starting from Birupa weir (on Birupa River, a branch of Mahanadi River) namely Kendrapara and Pattamundai canals start from the right of the river and proceed to irrigate to the right of Birupa. The third, High Level Canal, Range I originating from the Left of the weir crosses Birupa-Brahmani watershed to enter the Brahmani basin. Two tributaries, namely Ong and Tel, join Mahanadi downstream of Hirakud dam. Both these carry large volumes of flow during monsoons. The average monsoon runoff at Tikarpara site is 65,636.00 MCM. In absence of any large storage dam lot of flow of Mahanadi goes to the sea and a small portion is utilized in Mahanadi delta. There is an imperative need for construction of a large terminal storage to conserve the precious resource and utilize it to meet the reasonable needs of the basin and transfer the surplus to water short areas. A dam site at Manibhadra dam has been identified and investigated but no progress seems to have been made. Opposition to the proposed dam is on account of large population displacement and other reasons. Live storage capacity of the proposed dam is 6,000 Mm3 . Studies have shown that Mahanadi has surplus water (Govt. of Orissa has not agreed with this conclusion) that is proposed to be transferred from Manibhadra reservoir to the Dowlaiswaram barrage on the
- 42. INDIA: HYDROLOGY PROJECT PHASE-II ______________________________________________________________________________ National Institute of Hydrology, Roorkee 42 Godavari. In fact, the proposed Manibhadra dam is the starting point of the peninsular component of NWDA’s ILR proposal. Hasdeo Bango Minimata Hasdeo Bango is a multipurpose storage reservoir on Hasdeo River, tributary of Mahanadi River, 70 km from Korba, in Korba District, Chhatisgarh. The catchment area at the dam is 6,730 km2 . The masonry gravity dam is 87 m high. The FRL and the MDDL of the reservoir are 359.66 m and 329.79 m and it has a live storage capacity of 3,040 MCM. Mean annual inflow to the reservoir is 3,540 MCM. The power house has 3 units of 40 MW each and a firm power of 20 MW. Tandula This is an important project of Chattisgarh state. The dam is located in Balod tehsil of Durg district at about 5 km from the Balod city. A dam was completed on the confluence of Sukha Nala and Tandula River in 1921, with a catchment area of 827.2 sq. km. The gross, live, and dead storage capacities of the reservoir are 312.25 MCM, 302.28 MCM and 99.67 MCM respectively. For the reservoir, the highest flood level, the FRL, and MDDL are 333.415 m, 332.19 m, and 320.445 m. A canal takes of from the dam to provide irrigation to 68,219 ha of Kharif crop. Main canal and distributaries run for about 110 km and the length of minors is 880 km. The monsoon rainfall in the command is about 1,293 mm. In the 1950s, it was realized that the Tandula reservoir is unable to meet the demands of the command and hence a reservoir, named Gondali reservoir, was created on Jujhara Nala in 1957 and a supplementary canal of 9 km length was constructed to supply water from Gondali
- 43. INDIA: HYDROLOGY PROJECT PHASE-II ______________________________________________________________________________ National Institute of Hydrology, Roorkee 43 reservoir to Tandula reservoir. After construction of Bhilai Steel Plant in 1956, water is being supplied to this plant from the Gondali reservoir and supply for irrigation has been stopped.
- 44. INDIA: HYDROLOGY PROJECT PHASE-II ______________________________________________________________________________ National Institute of Hydrology, Roorkee 44 CHAPTER 3 PROCESSING AND ANALYSIS OF HYDRO-METEREOLOGICAL DATA 3.1 PROCESSING OF RAINFALL DATA The precipitation on the basin is in the form of rainfall and the intensity of rainfall varies fairly in time and space as observed from the database. The inventory of existing database for the basin and the daily mean rainfall for the year 2008 is given in Table 3.1. Table 3.1 Rain gauge stations in Mahanadi Zone (R/F is daily mean rainfall in MM) STATION R/F STATION R/F STATION R/F STATION R/F Upper Mahanadi Basin Ambabehna Dharmjaygarh 8.2 Kurubhatta 10.6 Sankara 1.4 Ambikapur 0.0 Ghatora 12.2 Laikera 46.0 Saradihi 43.8 Andhiyokore Ghorari 25.8 Manedragarh 3.8 Seorinarayan 2.6 Baikanthapur 0.0 Hemgir 14.0 Mahupalli 19.2 Simga 17.8 Bamandini 0.8 Jagadalpur 6.2 Nandaghat 3.0 Sundergarh 31.6 Bangodam 4.2 Jamadarpalli 24.8 Nuapara Surajgarh 10.6 Bargaon 16. Jamankira 22.6 Paramanpur 6.8 Tarapur 0.0 Basantpur 8.0 Jharsuguda 4.6 Pendraraoad 0.6 Thettang 3.8 Boranda 8.2 Kelo 4.0 Raipur 23.6 Champua Korba 0.2 Rajim 6.2 Deogan 6.0 Kuchinda 23.6 Rampur 2.6 Lower Mahanadi Basin Alipingal 63.6 Daspalla 38.4 Mundali 40.0 Salebhatta 16.2 Armpur 37.2 Dunguripali Naraj 43.0 Sambalpur 18.2 Athagarh 68.0 Gop 31.0 Naringhpur 33.0 Sohela Athamalik 30.4 Harabhanga 19.0 Nayagarh 51.0 Sonepur 15.0 Baliguda 18.0 Hirakud 14.6 Nimapara 46.2 Tangi 38.0 Banapur 37.0 Jaipatna 35.0 Padmapur Tikabali 43.0 Khandapada 71.0 Junagarh 56.0 Padmavati 86.4 Tikarpara 53.0 Barmul 29.6 Kakatpur 68.0 Paikamal Titilagarh 3.4 Belgaon 16.4 Kantamal 22.0 Paradeep 162.0 Pipiii 4.2 Bhawanipatna 48.0 Kendrapara 75.0 Patnagarh Bhubaneshwar 50.6 Kesinga 12.6 Jatamundai 94.0 Bijepur Kairmal 15.1 Phulbani 15.2 Bolangir 34.0 Khriar 43.0 Puri 48.8 Boudhraj 20.0 Komna 98.6 Rairakhol 19.0 Burla 14.6 Lanjgarh 105.0 R.K.Nagar 22.6 Cuttack 37.8 M.Rampur 112.0 Ranpur 34.4 Figure 3.1(a-c) shows two more nearby basins that is also considered for certain analysis in this project, and they are Brahmani and Rushikulya basins. There are ninety eight rain gauge stations
- 45. INDIA: HYDROLOGY PROJECT PHASE-II ______________________________________________________________________________ National Institute of Hydrology, Roorkee 45 that exist in and around Mahanadi are being maintained by IMD, CWC and state observatory. These data have been used for computing mean rainfall over four sub-basins: (i) Up to Patheria/ Garakota; (ii) Up to Gasiabad, (iii) Up to Daudhan, and (iv) Up to Banda. The temporal variations of annual rainfall for four stations within Mahanadi basin are shown in Figure 3.2(a- b). The distribution of the existing rain gauges in the basin taking into account four specific stations is shown in this Figure The mean rainfall has been calculated using two methods: (i) Arithmetic mean (AM) and (ii) Thiessen Polygon (TP); these are discussed briefly in the subsequent sections in this chapter. Before that, the consistency of the monthly rainfall series of the available rain gauge stations was checked and the results are described in the following section. 3.1.1 Tests for Consistency of Rainfall Series Consistency of a rain gauge station is used to cross check if the conditions relevant to the recording of a rain gauge station have undergone a significant change during the period of record. Then inconsistency would arise in the rainfall data of that station. This inconsistency would be noticed from the time the significant changes have taken place. Some of the common causes for inconsistency of record are: i) Shifting of a rain gauge station to a new location, ii) The neighborhood of the station undergoing a marked change, iii) Occurrence of observational error from a certain date.
- 46. INDIA: HYDROLOGY PROJECT PHASE-II ______________________________________________________________________________ National Institute of Hydrology, Roorkee 46 Figure 3.1a Distribution of the existing rain gauges and observatory sites in Mahandi basin.
- 47. INDIA: HYDROLOGY PROJECT PHASE-II ______________________________________________________________________________ National Institute of Hydrology, Roorkee 47 Figure 3.1b Distribution of the existing rain gauges and observatory sites in Rushikulya basin.
- 48. INDIA: HYDROLOGY PROJECT PHASE-II ______________________________________________________________________________ National Institute of Hydrology, Roorkee 48 Figure 3.1c Distribution of the existing rain gauges and observatory sites in Brahmani basin.
- 49. INDIA: HYDROLOGY PROJECT PHASE-II ______________________________________________________________________________ National Institute of Hydrology, Roorkee 49 0 100 200 300 400 500 600 700 800 1995 1997 1999 2001 2003 2005 2007 2009 YEAR ANNUALRAINFALLINMM Figure 3.2a Temporal variation of rainfall for mean of kakatpur and Kendrapada (1995- 2007) 0 100 200 300 400 500 600 700 1990 1995 2000 2005 2010 YEAR ANNUALRAINFALLINMM Figure 3.2 b Temporal variation of rainfall for mean of Hemgir and Jagadalpur (1994-2007) For this study, the double mass curve technique is used to check the consistency of a rainfall series record. This technique is based on the principle that when each recorded data comes from the same parent population, they are consistent.
- 50. INDIA: HYDROLOGY PROJECT PHASE-II ______________________________________________________________________________ National Institute of Hydrology, Roorkee 50 A group of stations in neighborhood of the index station (for which the consistency test is required) is selected. The data of the annual (or monthly mean) rainfall of the index station X and also the average rainfall of the group of base stations covering a long period is arranged in the reverse chronological order, i.e. the latest record as the first entry and the oldest record as the last entry in the list. The accumulated precipitation of the station X and the accumulated values of the average of the group of base stations are calculated starting from the latest record. Individual values are plotted against cumulative ones for various consecutive time periods. A break in the slope of the resulting plot indicates a change in the precipitation regime of station X. The precipitation values at station X beyond the period of change of regime is corrected by using the following relation, Correction factor = BX AX (3.1) where XA and XB are the interception lengths in y and x-axis respectively. In this way the older records are brought up the new regime of the station. It is apparent that the more homogeneous the base station records are, the more accurate will be the corrected values at station X. A change in slope is normally taken as significant only where it persists for more than five years. Otherwise the records are presumed to be consistent. The double mass curve is also helpful in checking arithmetic errors in transferring rainfall data from one record to another. For the study area, the consistency in monthly rainfall series is checked for all the raingauge stations (Table 3.1). From the results, it is observed that there is significant change in slope for the following eight stations: i) Alipingal ii) Ghatora
- 51. INDIA: HYDROLOGY PROJECT PHASE-II ______________________________________________________________________________ National Institute of Hydrology, Roorkee 51 iii) Sundergarh iv) Laikera v) Jamadarpalli vi) Kuchinda vii) Daspalla viii) Naringhpur The rainfall series for the above eight stations showed inconsistency mainly during the month of September. The corrections for the specific period where these rainfall series show a bend in the double mass curve is done using Eq. (3.1). The monthly data of Sundergarh is used as an example to show the procedure to rectify the inconsistency in the data. The double mass curve using the monthly data for September for this station is shown in Figure 3.3 (a). As observed from Figure3.3 (a), the double mass curve has a bend starting at coordinate X1 = 6680.22, Y1 = 5737.1up to X2 =13643.2, Y2 = 11517.6. The slope i.e., correction factor for this part as per Eq. (3.1) is (Y1-Y2) / (X1-X2) = 1.23. The corrections are applied after (X1, X2) as follows: Corrected cumulative rainfall at index station (Yi) = Yi-1 + (Xi – Xi-1) (correction factor), e.g., the corrected values of monthly rainfall value is: station (Yi) = 5661.19 + (6680.22 – 6473.12) x (0.83) = 6070.37 and the procedure is repeated for the next succeeding values. The corrected double mass curve for Sundergarh for the September month is shown in Figure 3.3. (b). The inconsistency found in two more stations i.e. Kuchinda and Daspalla are reported using double mass curve in Figure
- 52. INDIA: HYDROLOGY PROJECT PHASE-II ______________________________________________________________________________ National Institute of Hydrology, Roorkee 52 Figure 3.3a Double mass curve for Sundergarh raingage in Mahandi basin for September Figure 3.3b Corrected Double mass curve for Sundergarh raingage in Mahandi basin for September 3.4 (a) and (b), respectively. After completing the consistency check and correcting the records, average aerial rainfall was computed. 0 2000 4000 6000 8000 10000 12000 14000 16000 0 5000 10000 15000 20000 0 2000 4000 6000 8000 10000 12000 14000 16000 0 5000 10000 15000 20000
- 53. INDIA: HYDROLOGY PROJECT PHASE-II ______________________________________________________________________________ National Institute of Hydrology, Roorkee 53 Figure 3.4 a Double mass curve for Kuchinda raingage in Mahandi basin for September Figure 3.4 b Double mass curve for Daspalla raingage in Mahandi basin for September 0 2000 4000 6000 8000 10000 12000 14000 0 2000 4000 6000 8000 10000 12000 14000 Cumulative mean monthly rainfall of Mahanadi (except Champua) Cumulativemonthlyrainfallat Daspallainmm 0 1000 2000 3000 4000 5000 6000 7000 8000 0 1000 2000 3000 4000 5000 6000 7000 CumulativemonthlyrainfallatKuchinda inmm Cumulative mean monthly rainfall of Mahanadi (except Champua) in mm
- 54. INDIA: HYDROLOGY PROJECT PHASE-II ______________________________________________________________________________ National Institute of Hydrology, Roorkee 54 3.1.2 Arithmetic Mean (AM) Method In any hydrological analysis the knowledge of the total rainfall over an area is required. However, a rain gauge represents only point sampling of the areal distribution of a storm. Generally three methods are practiced to convert the point rainfall values at various stations into an average value over an area. These are: (i) arithmetic average or mean (AM) method, (ii) isohyetal method, and (iii) Thiessen polygon (TP) method. In the present study, the AM and TP methods have been used to calculate the total rainfall over the study area. In case of arithmetic mean (AM) method, the arithmetic average of the available raingage records is taken to be the rainfall over the basin. Though a detailed analysis using AM method is done for the study area, Figure 3.5 presents the result of AM method for the Mahandi basin up to Champua for the month of July. Table 3.2: Corrections for the inconsistency rainfall records for Champua (Mahanadi basin) for the month of September in 1983 Cumulative Rainfall for the Month of Sept, 1996 at Champua PREVIOUS CORRECTED Y-axis (index station) X-axis(Mean rainfall of rest of the stations) Y-axis (index station) X-axis(Mean rainfall of rest of the stations) 4868.62 5566.89 4868.62 5566.89 4933.94 5745.00 5220.52 5745.00 4940.34 7216.47 5368.35 6020.00 4986.33 7341.34 6589.67 7341.34 5099.39 7443.61 6693.31 7443.61 5216.92 7642.04 6778.20 7642.04 5306.44 7747.89 6942.89 7747.89 5412.31 7827.01 7030.75 7827.01
- 55. INDIA: HYDROLOGY PROJECT PHASE-II ______________________________________________________________________________ National Institute of Hydrology, Roorkee 55 3.1.3 Thiessen Polygon (TP) Method In this method, the rainfall recorded at each station is given a weightage on the basis of an area closest to the station. In this method, Thiessen polygons are drawn around each of the stations by drawing perpendicular bisectors to the lines joining raingage stations. The value of the rainfall at the station is assumed to be acting over that polygon area. Calculation of the average rainfall over the area is done using the following equation: )...( .... 321 332211 n nn AAAA APAPAPAPP (3.2) where, A1, A2,...An are respective areas of Thiessen polygons. 300 350 400 450 500 550 1980 1990 2000 2010 YEAR MEANMONTHLYRAINFAL FORJULYINMM AM TP Figure 3.5 Mean monthly rainfall up to Champua for the month of July using Thiessen polygon (TP) and arithmetic mean (AM) method Since the water availability analysis is to be carried out on monthly basis, the daily data were collected from IMD web site and officially from Department of Water Resources (Govt. of
- 56. INDIA: HYDROLOGY PROJECT PHASE-II ______________________________________________________________________________ National Institute of Hydrology, Roorkee 56 Orissa) and from the earlier reports, were aggregated to monthly data. However, for the purpose of design flood calculations, short term data of four available stations are used separately for the historic periods. This is discussed separately in chapter five. From the data supplied so far, it was observed that the period of availability of data varies for the 21 stations (the length of record is not same for all the stations). Hence to compute the total rainfall for the Mahanadi basin up to fourteen gauging sites, and its sub catchments (given in the table in the nest section in Processing of runoff data) , it was necessary to work on different combinations of rain gauges having concurrent period of data availability. A computer program was developed for estimation of average areal rainfall of the catchment and sub-catchments using the Thiessen polygon method. For each month, the program forms the combination of rain gauges as per data availability and estimates the Thiessen weights for the stations in the combination. Table 3.3 shows an example of the comparison of AM and TP calculation of mean rainfall (July) for Champua gauging sites. These weights are then used along with the rainfall data of the network to estimate the average areal rainfall. The sample results of the program were checked using manual calculations with the help of a spreadsheet. After the results were found satisfactory, the program was used to estimate monthly average areal rainfall for the period 1986-2007 for the Mahandi basin up to its sub catchments Few samples of these combinations and their respective weightages are reported in Table 3.4 for total monthly rainfall up to Anandpur GD site. The results of Thiessen polygon (TP) were compared with the results of the arithmetic mean method and the results show a difference of about ± 10 percent. Further for this analysis the monthly mean rainfall values obtained using the TP method were compared with corresponding values of mean rainfall derived using isohyetal map for
- 57. INDIA: HYDROLOGY PROJECT PHASE-II ______________________________________________________________________________ National Institute of Hydrology, Roorkee 57 some randomly selected periods. The comparison gave fairly good approximation between the two. Thus on basis of the above results and following the recommendations of Tabios-III and Salas (1985), Croley and Hartmann (1985), the TP method was adopted to compute mean rainfall values in this study. Table 3.3 Estimation of average rainfall for Mahanadi basin up to Champua GD site AM TP AM TP AM TP AM TP 340.8 369.2 371.4 349.0 468.5 519.1 421.4 437.2 345.3 379.4 378.8 399.3 474.4 417.5 423.5 434.2 345.8 355.1 340.8 296.9 486 484.3 365.2 361.7 349.1 338.6 365.4 369.0 492.1 465.2 413.1 403.1 356.9 325.1 375.7 315.2 389.6 308.7 298.7 291.2 365.1 368.4 461.2 406.4 402.1 419.7 Table 3.4 Estimation of average rainfall for Mahandi basin up to Anandpur GD site Gauge Name With all data available (e.g., Jul., 1994) With the data of 14 gauges (e.g., Jul., 1995) With the data of 10 gauges (e.g., Sep., 1995) Rainfal l Weight Effective Rainfall Weight Effective Rainfall Weight Effective Ambabehna 209.7 0.0 0.0 168.6 0.0 0.0 120.3 0.0 0.0 Ambikapur 361.0 0.0 0.0 0.0 2.6 0.0 143.1 0.0 0.0 Bamandini 343.7 5.9 21.6 97.8 5.1 5.7 43.9 5.1 2.6 Bargaon 332.7 7.6 32.4 118.6 7.6 10.5 0.0 9.0 0.0 Basantpur 323.5 4.1 16.2 0.0 0.0 0.0 0.0 9.0 0.0 Boranda 295.1 1.8 0.0 144.0 5.4 0.0 83.5 2.0 0.0 Champua 369.6 6.0 28.6 116.2 7.1 9.6 83.3 0.0 9.6 Ghorari 588.3 9.0 68.2 160.3 9.0 16.8 49.6 1.1 5.2 Hemgir 433.1 4.3 16.5 139.4 3.0 4.8 0.0 9.0 0.0 Jharsuguda 466.1 11.5 69.0 90.4 13.3 14.0 36.9 11.4 7.3 Kelo 555.0 3.7 26.3 163.3 2.6 7.0 109.2 7.9 10.0 Sundergarh 225.4 0.0 0.0 180.7 0.0 0.0 0.0 2.5 0.0 Surajgarh 324.3 3.8 15.6 181.5 3.8 7.9 0.0 4.5 0.0 Tarapur 479.4 3.5 10.2 151.7 2.7 2.9 0.0 9.0 0.0 Kantamal 240.9 5.6 17.3 96.6 5.6 6.3 86.1 4.6 10.6 Kendrapara 251.2 1.1 0.0 103.8 0.0 0.0 0.0 0.0 0.0 Kesinga 257.7 0.0 0.0 164.4 2.8 0.0 72.5 0.0 0.0 Burla 206.2 9.9 26.1 165.7 9.9 19.0 100.7 10.1 11.8 Cuttack 589.1 8.1 16.6 200.4 4.2 5.1 84.4 2.2 2.1 Salebhatta 645.5 7.8 64.6 161.9 7.8 14.7 202.3 7.8 18.4 Sambalpur 681.4 5.5 48.0 178.6 6.4 13.3 138.5 6.4 6.4 Avg. rainfall 100.00 477.3 100.00 137.7 100.00 84.1