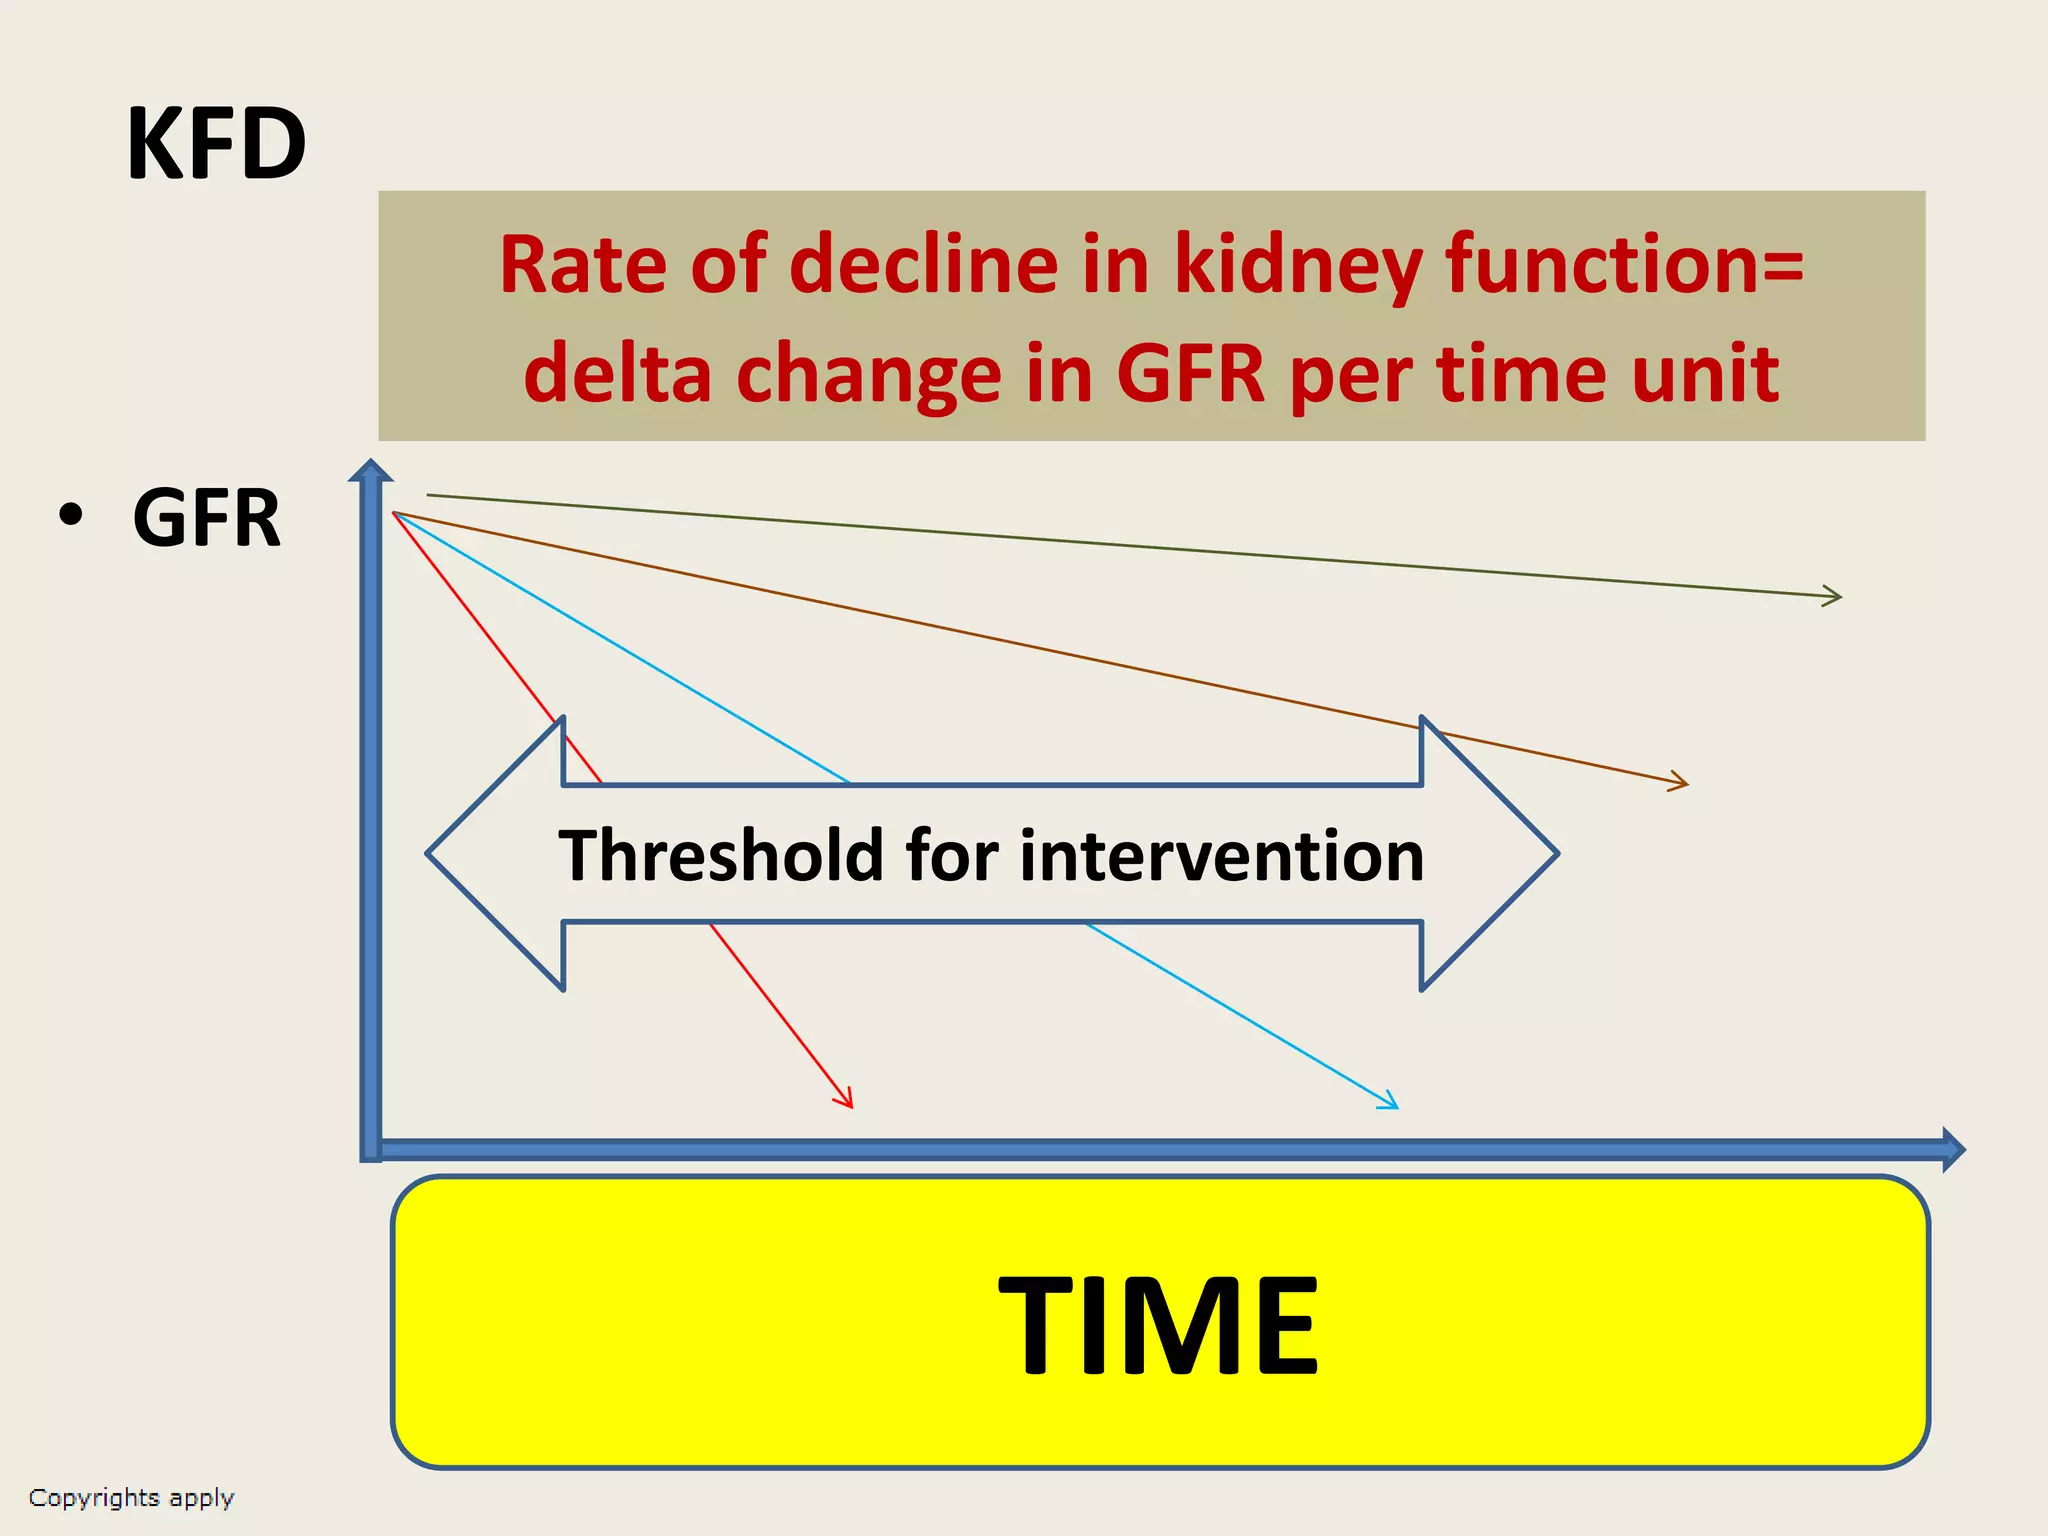
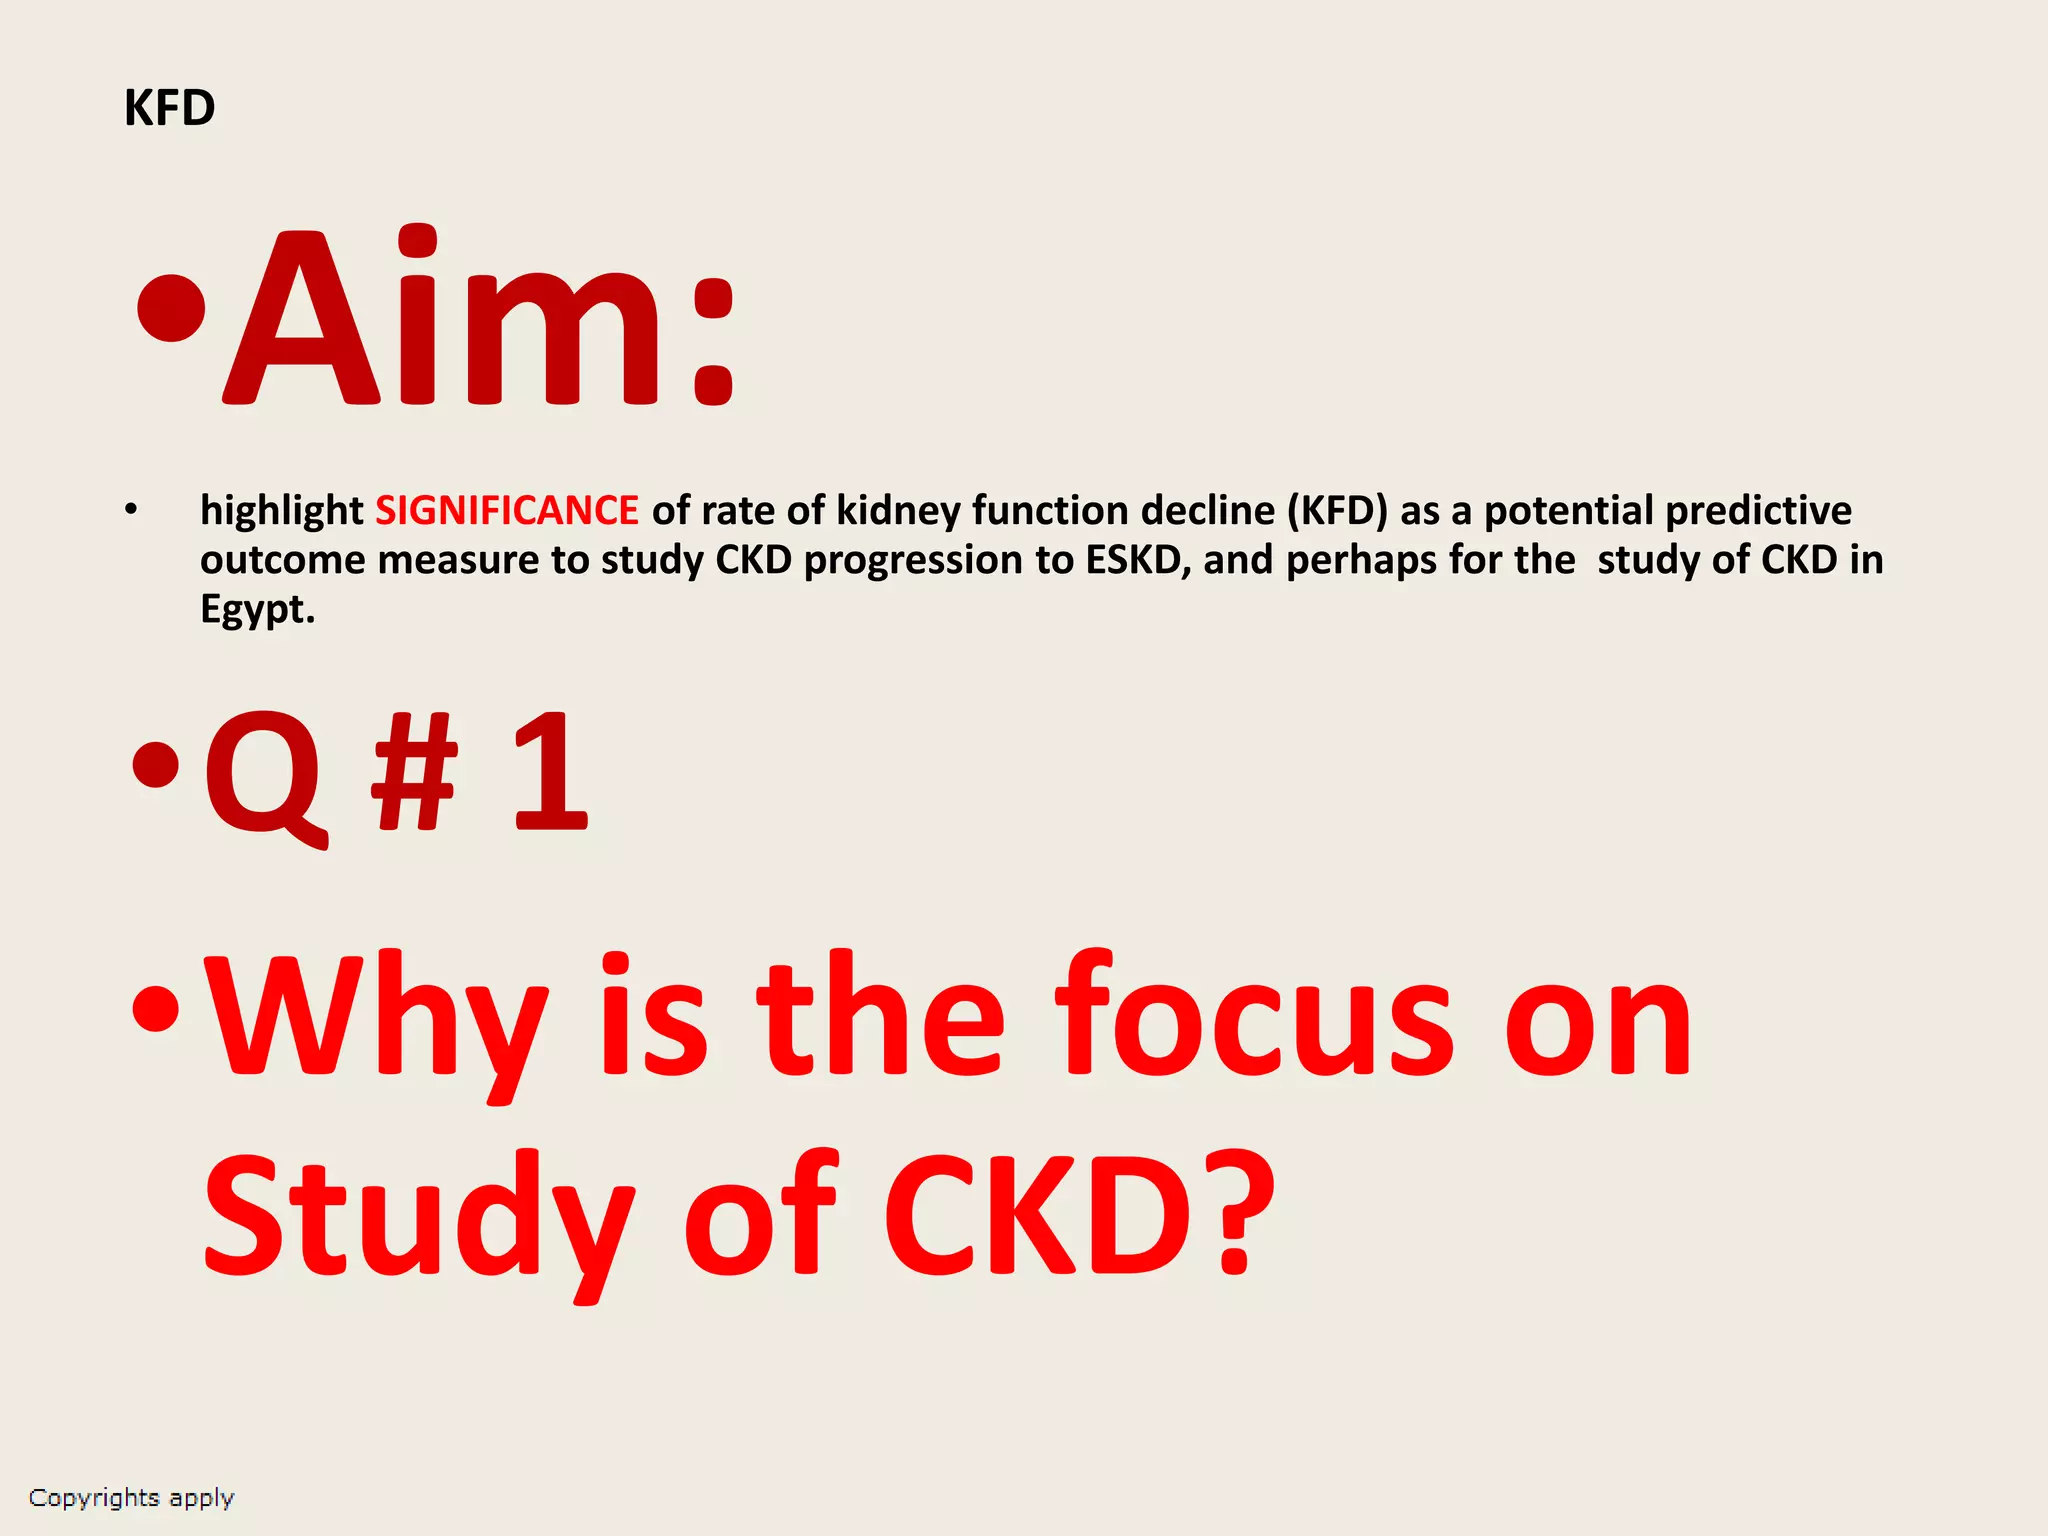
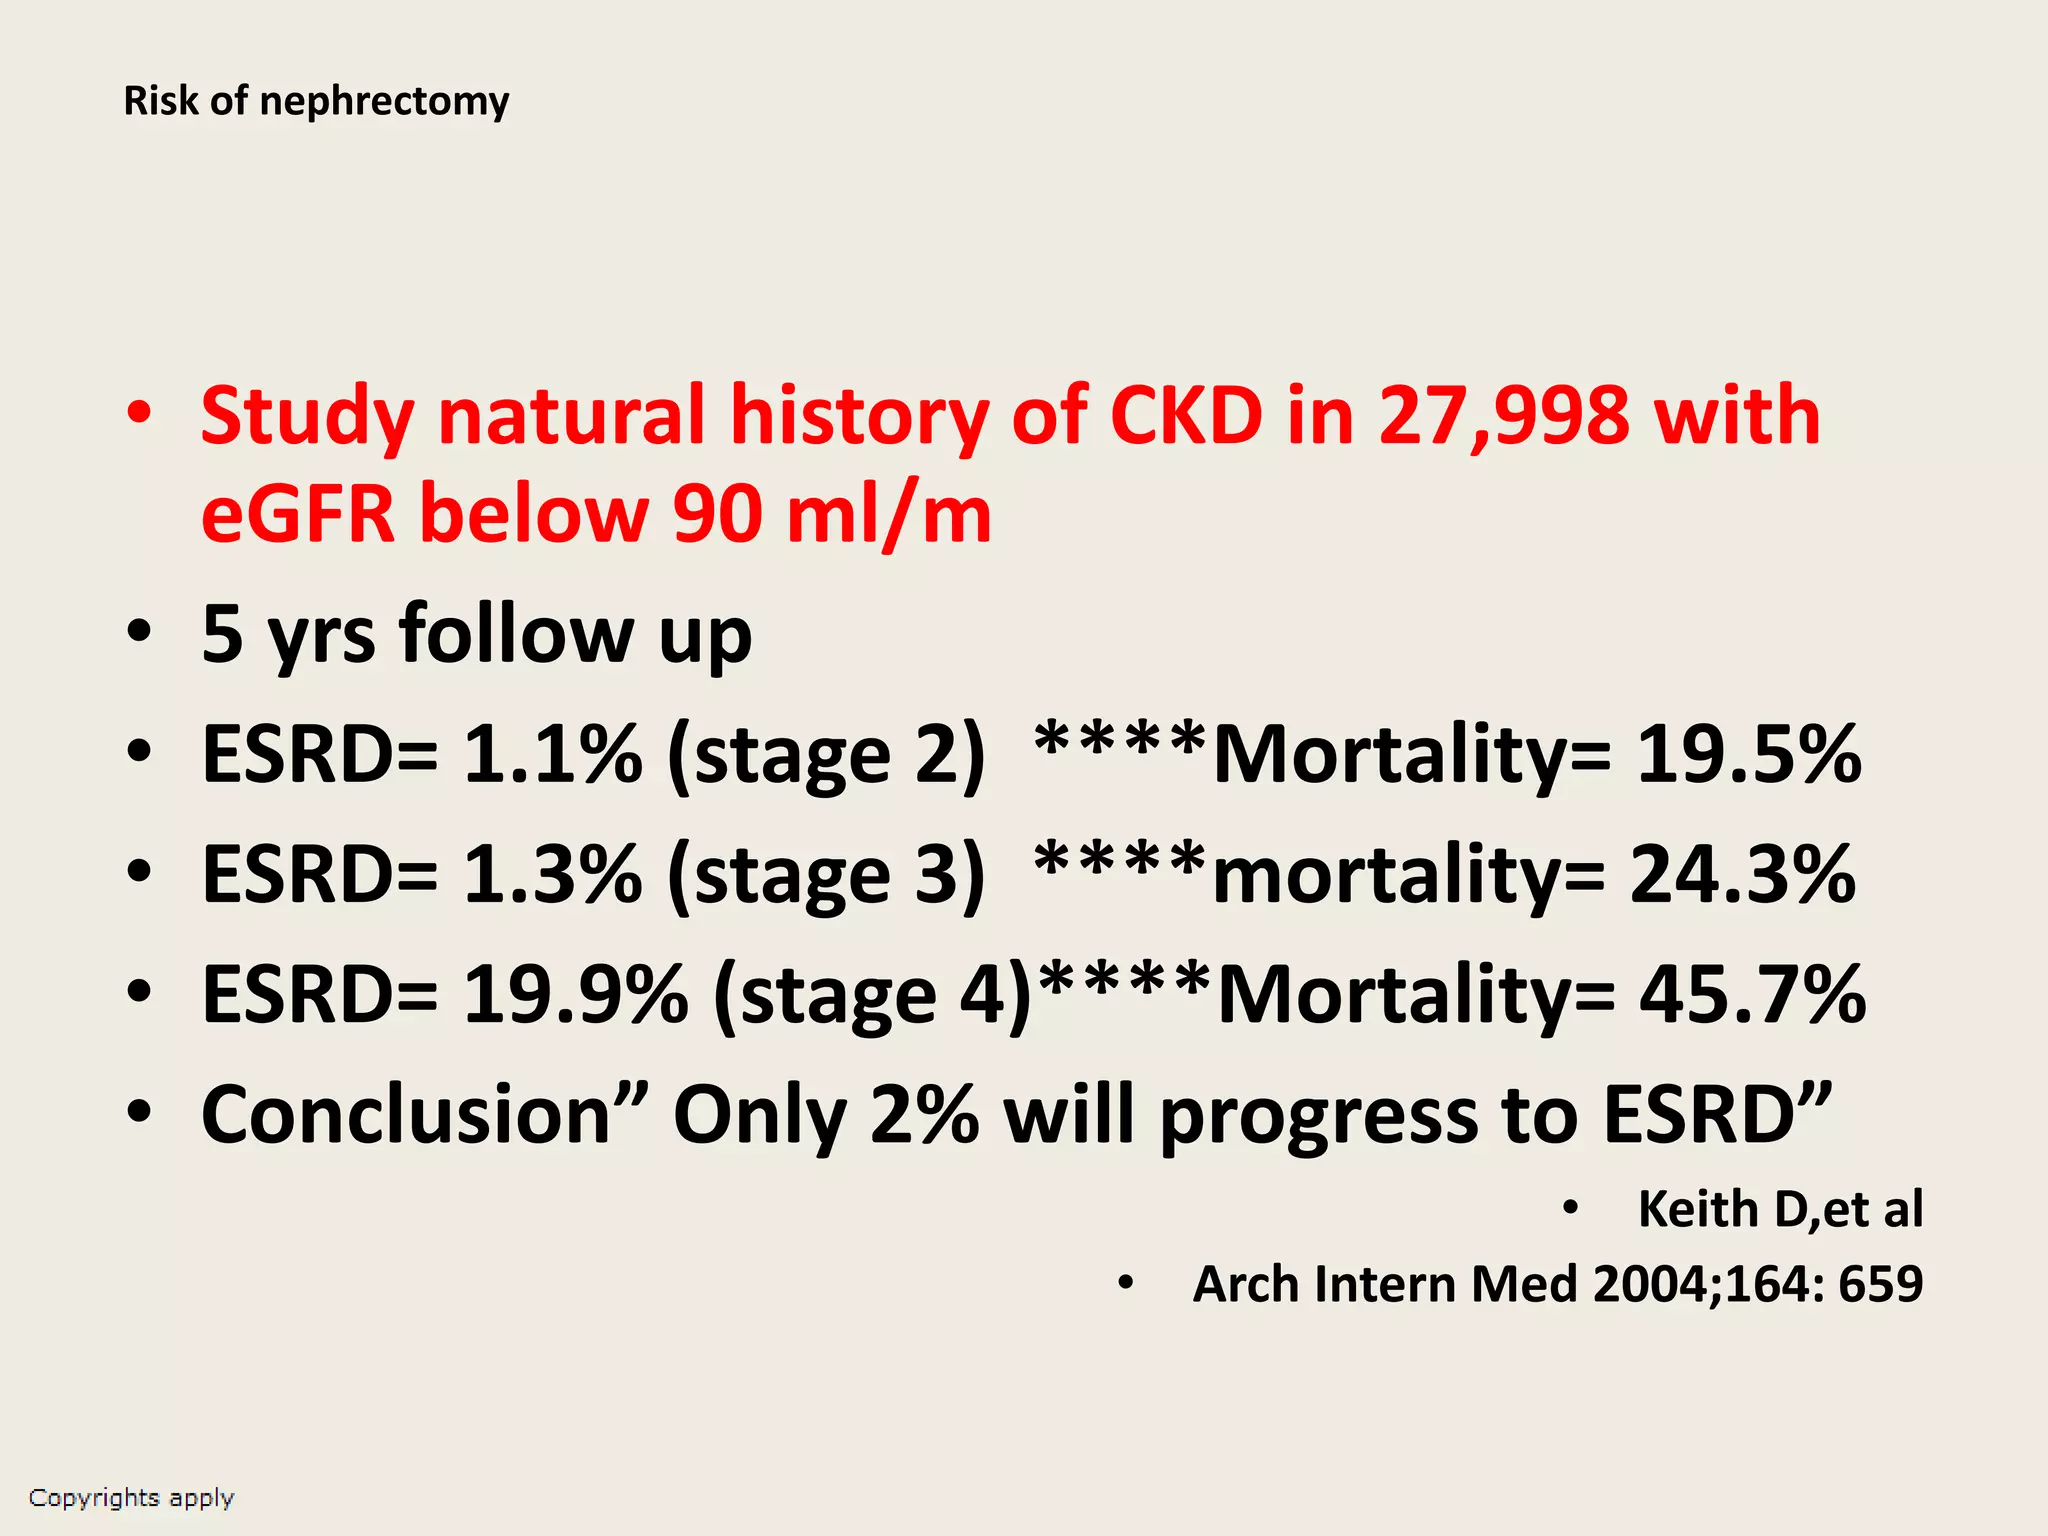
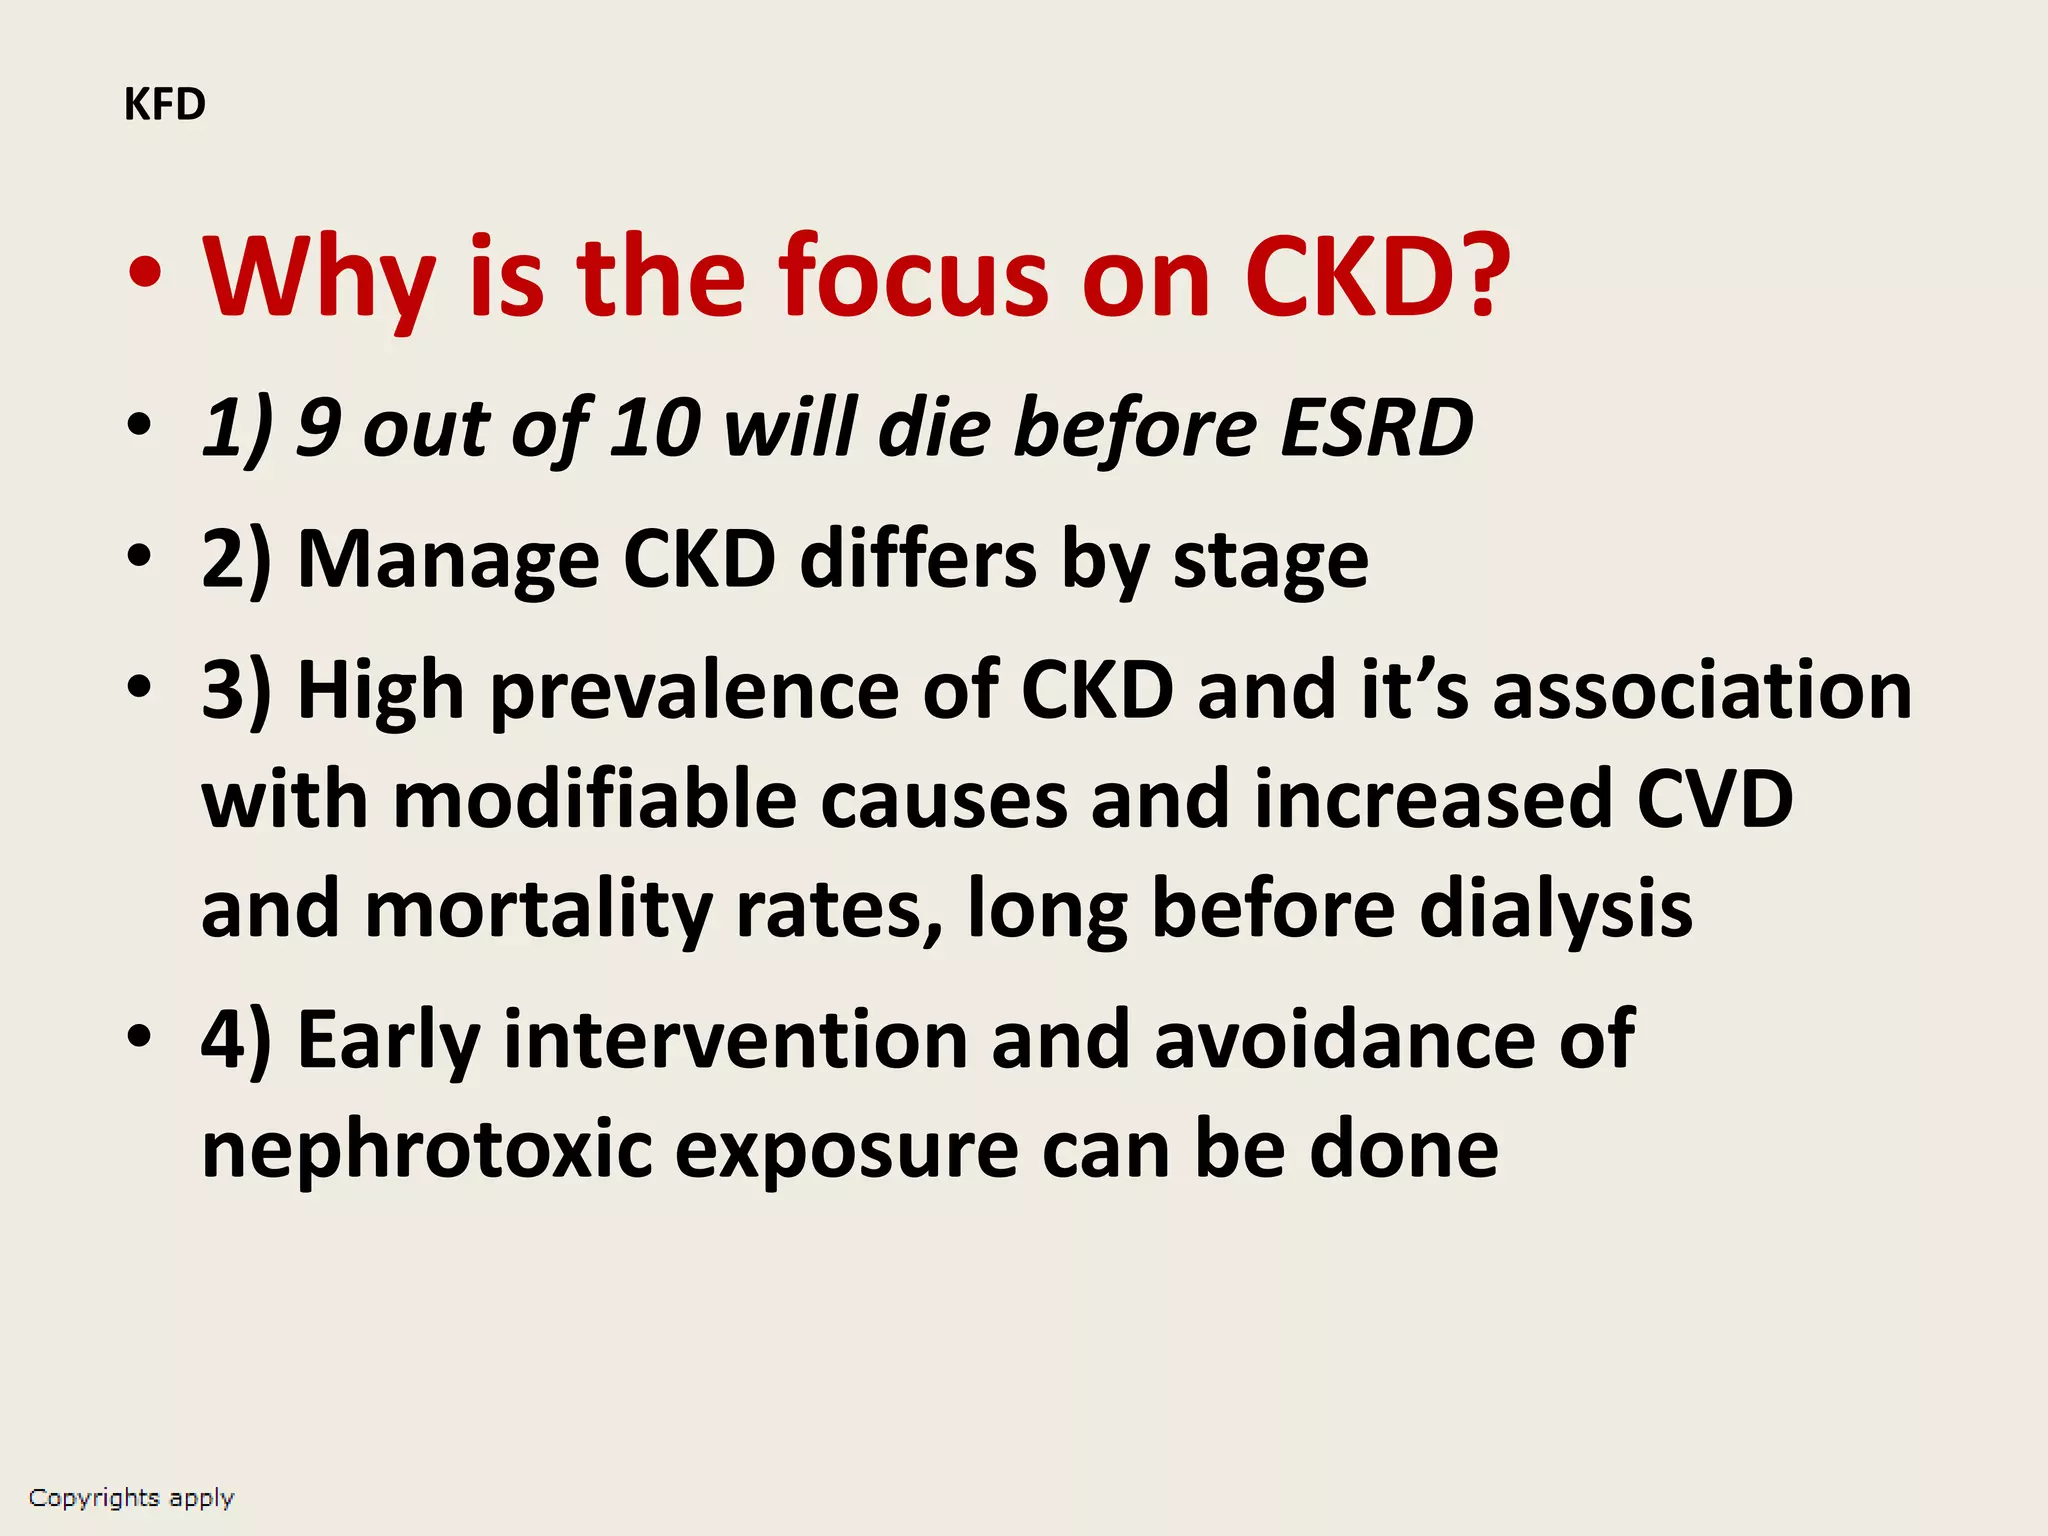
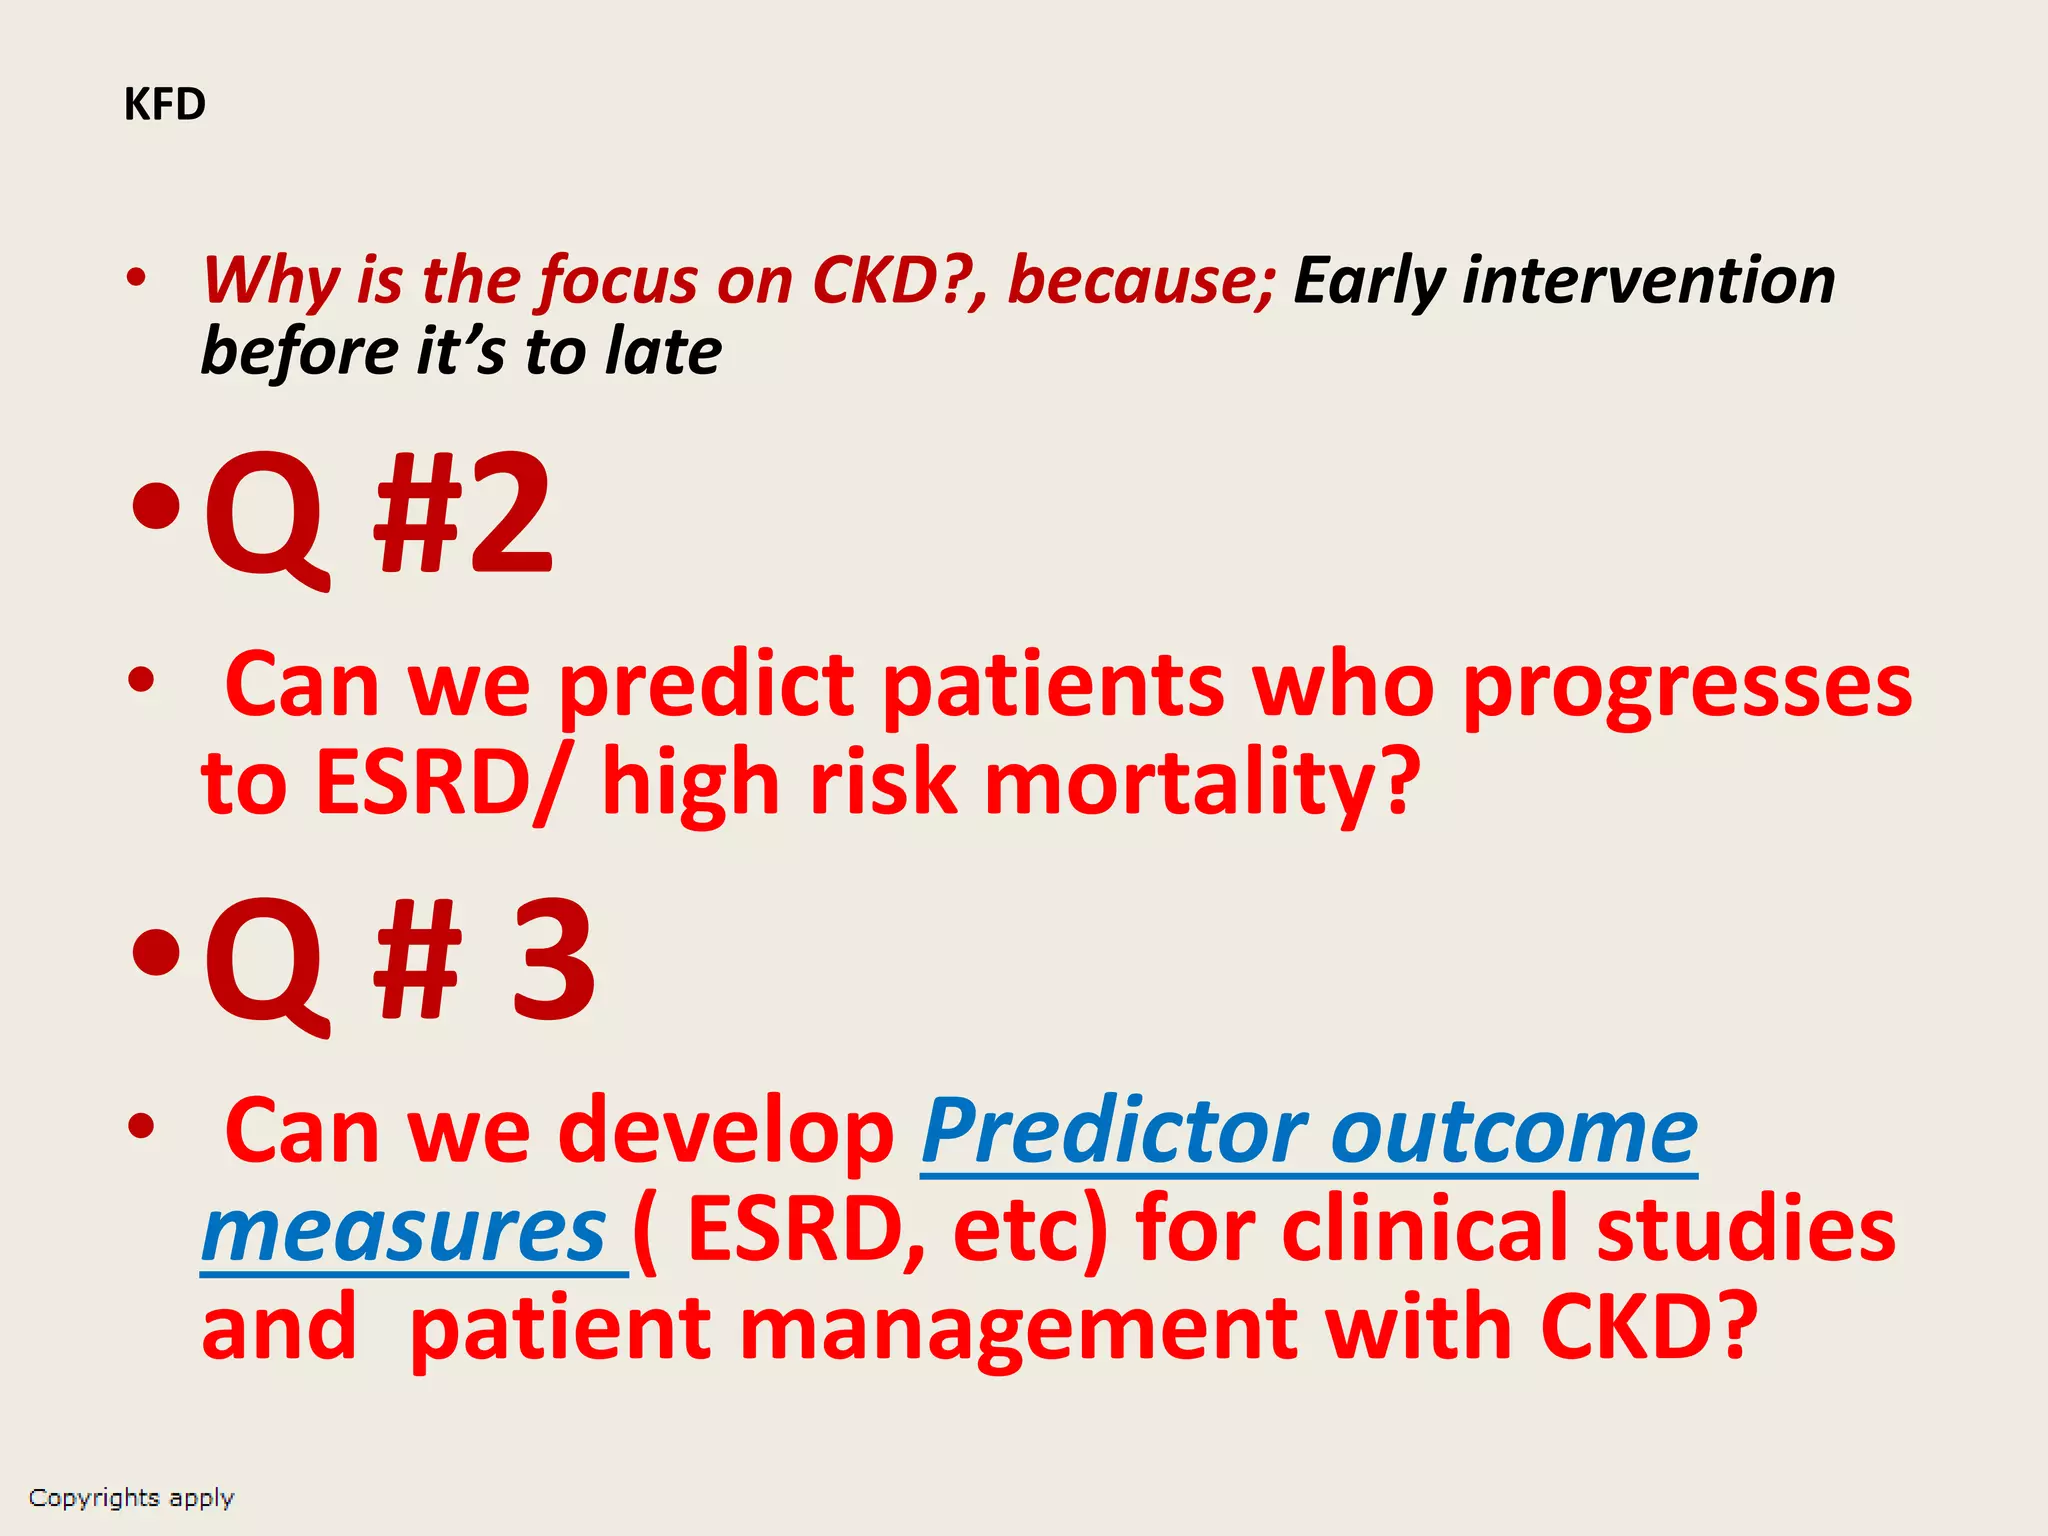
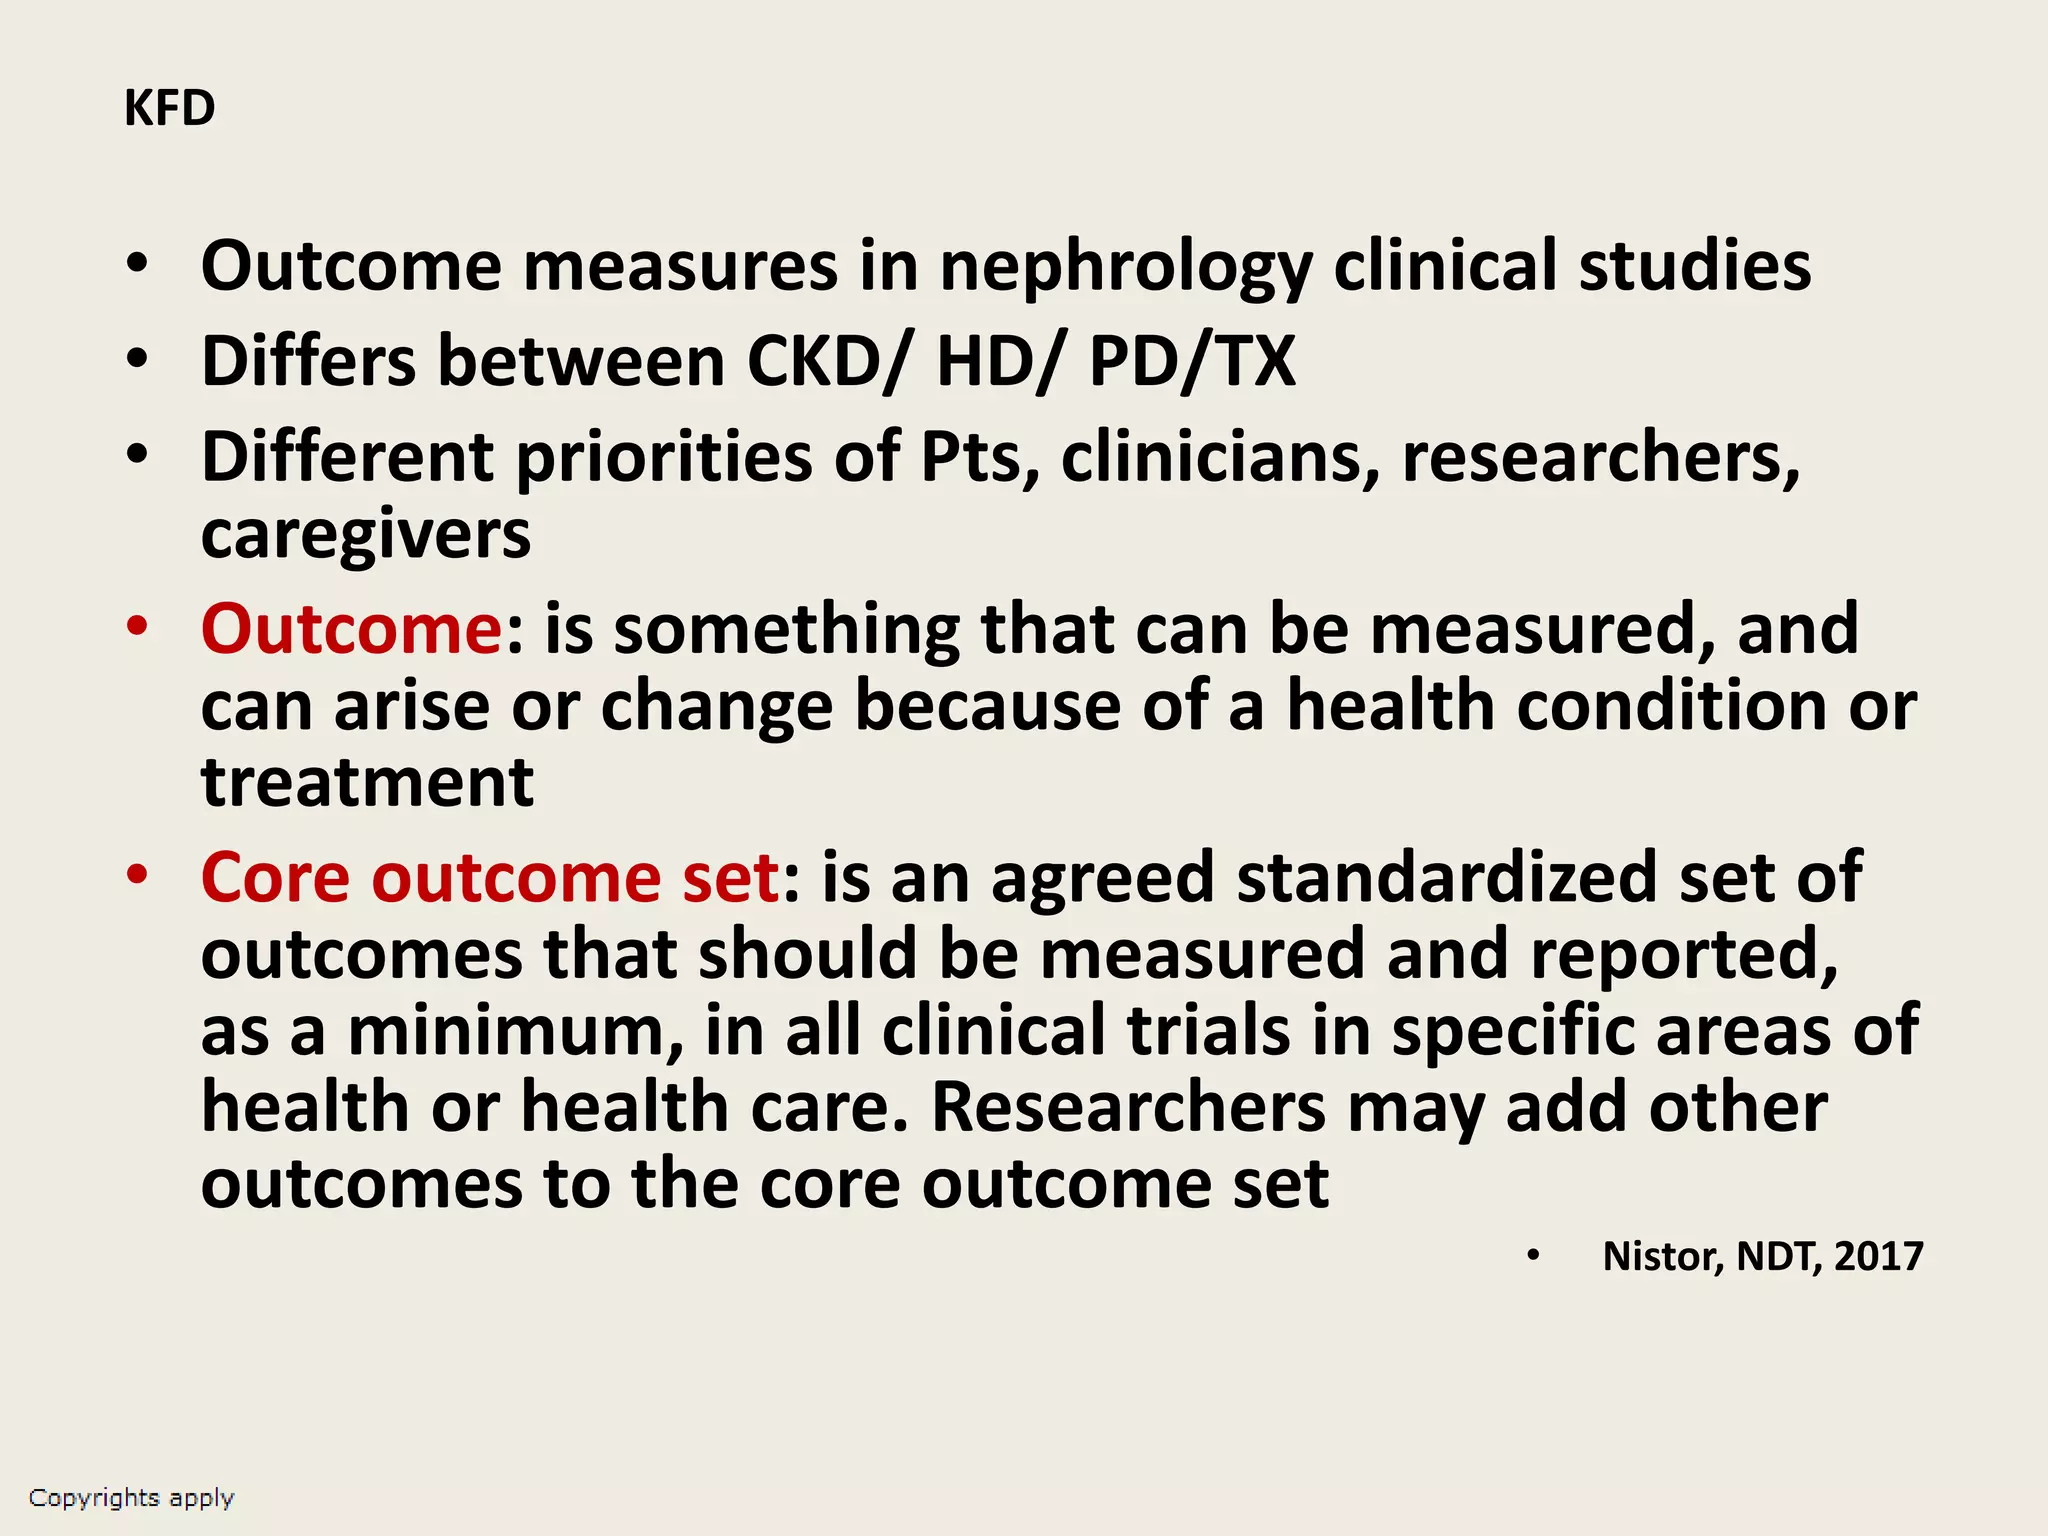
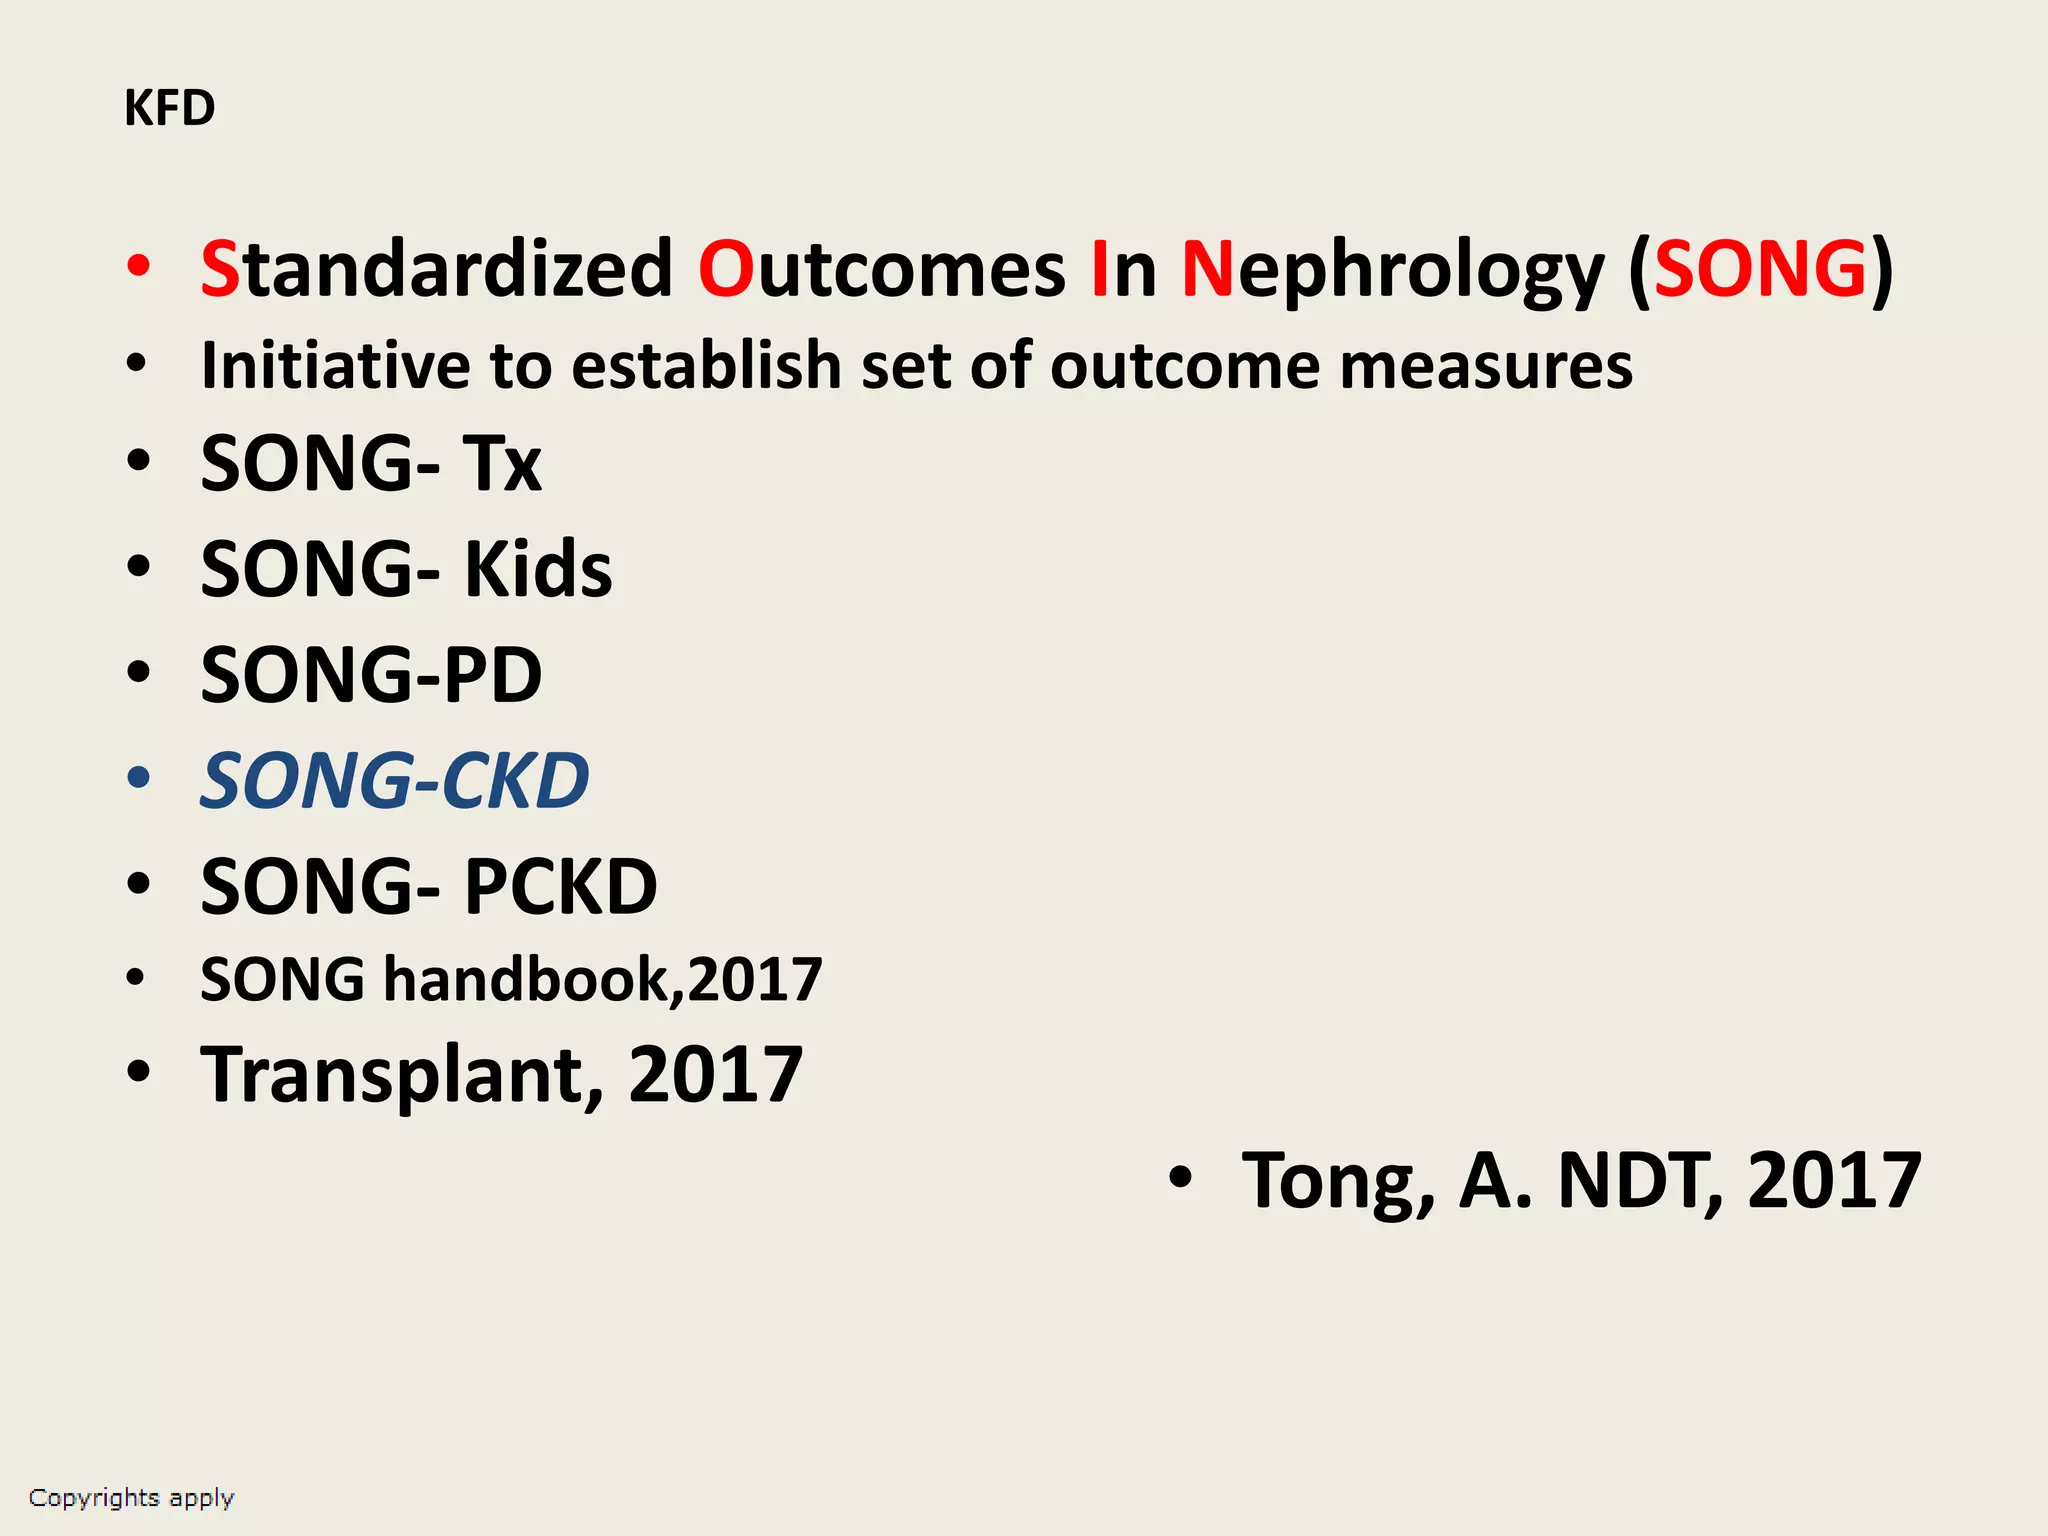
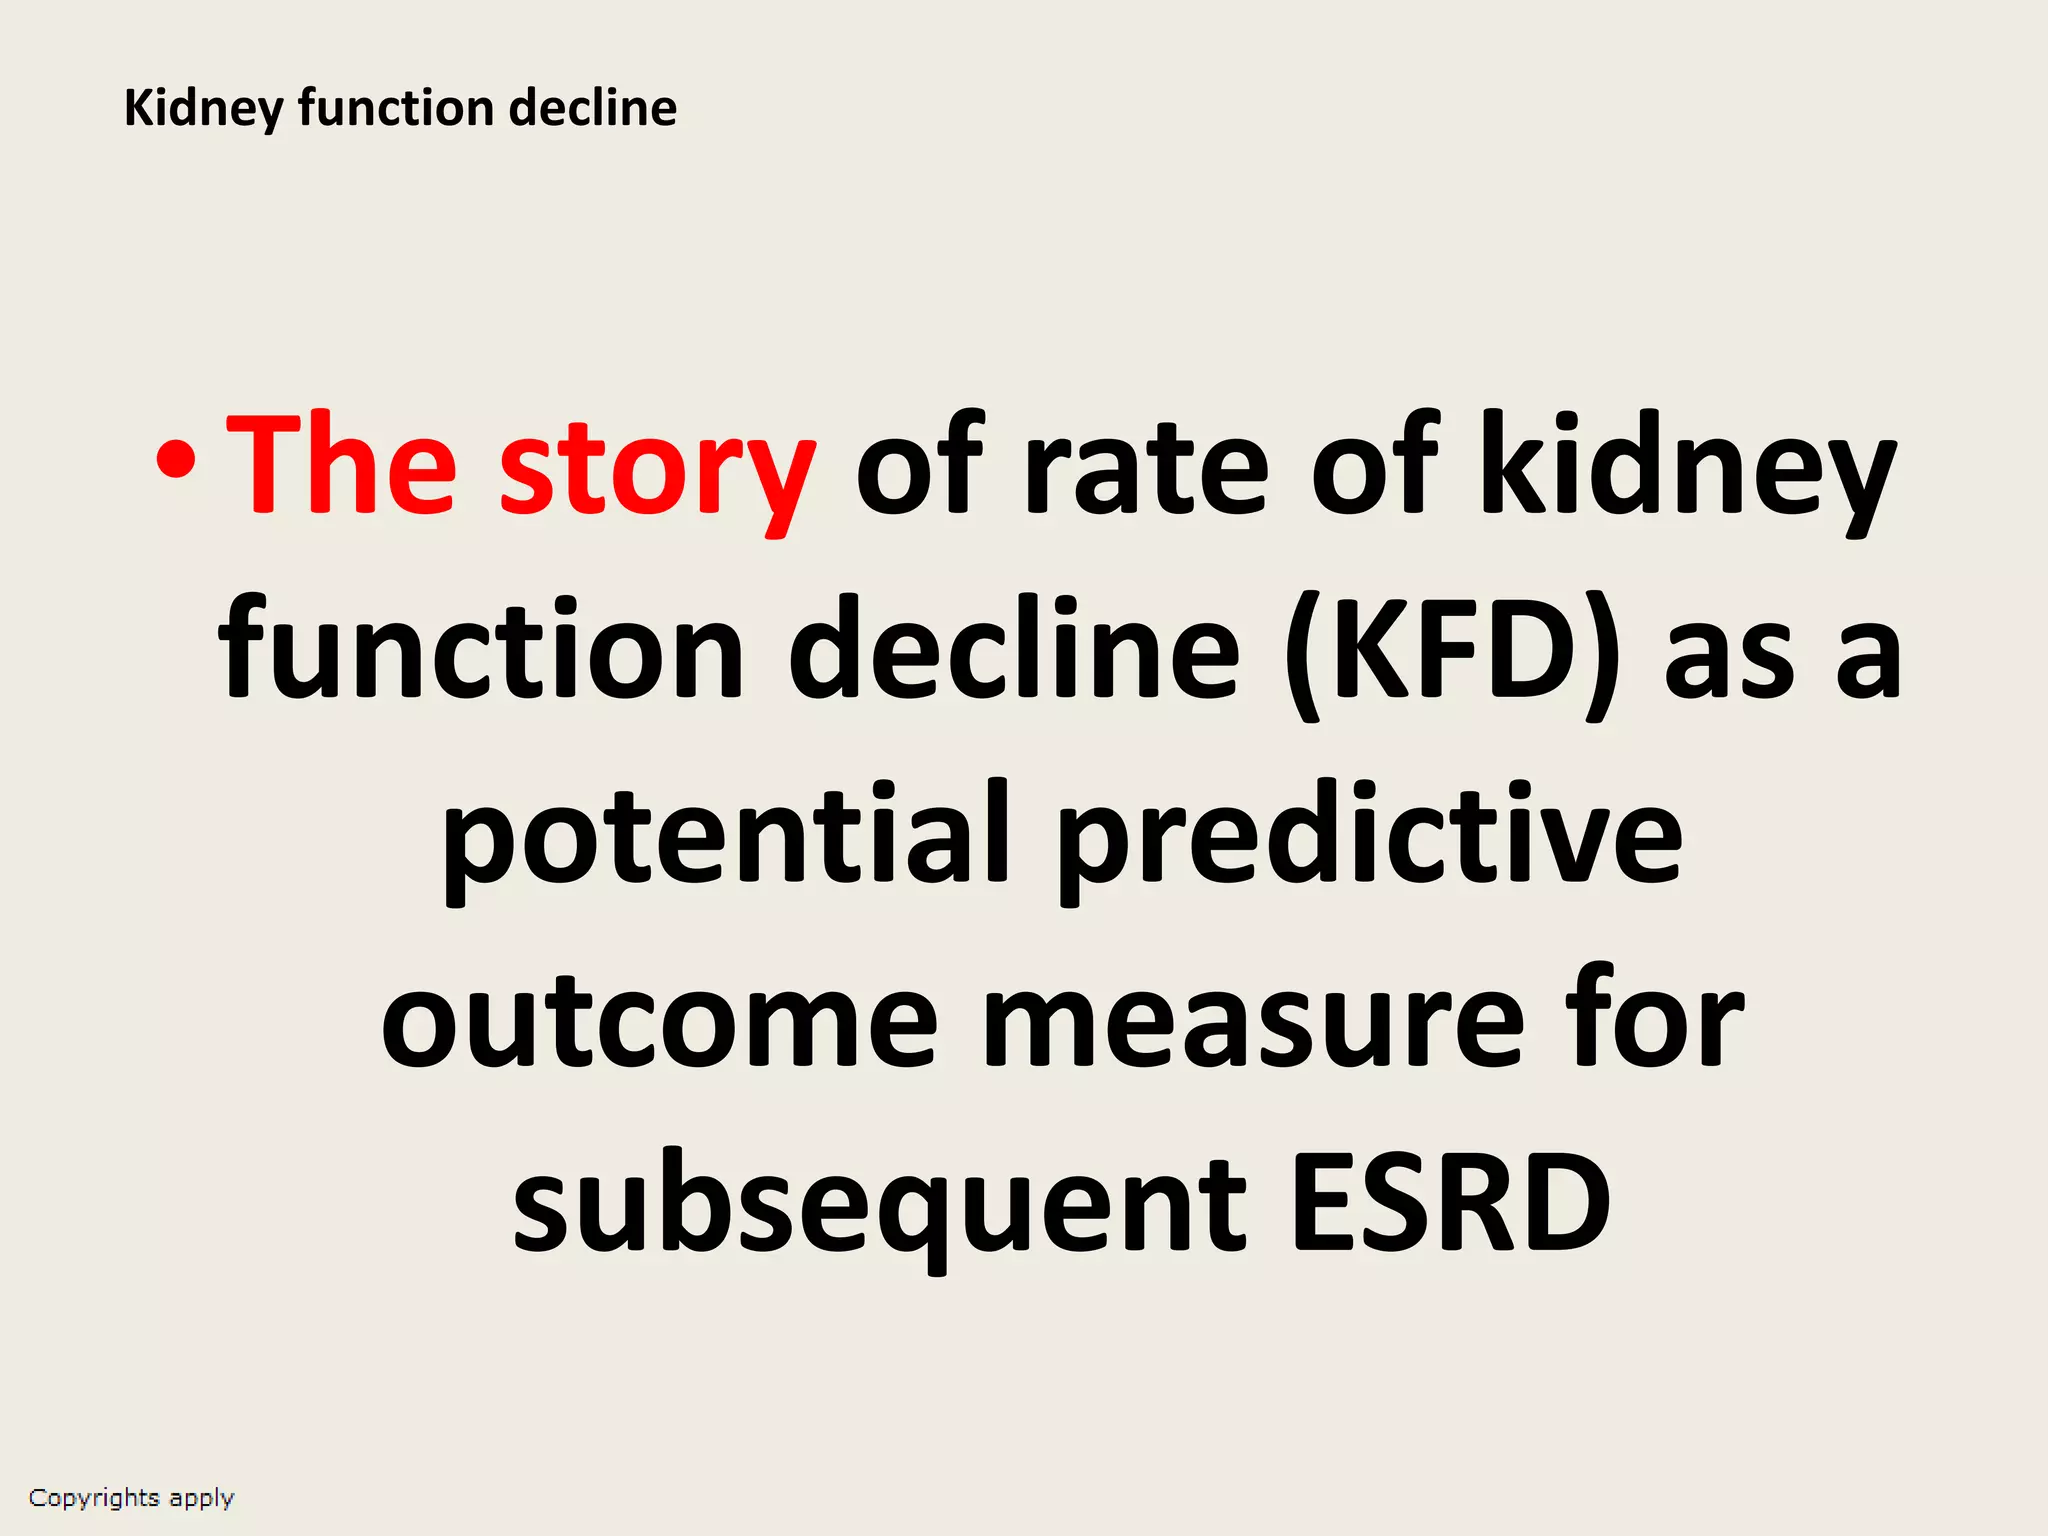
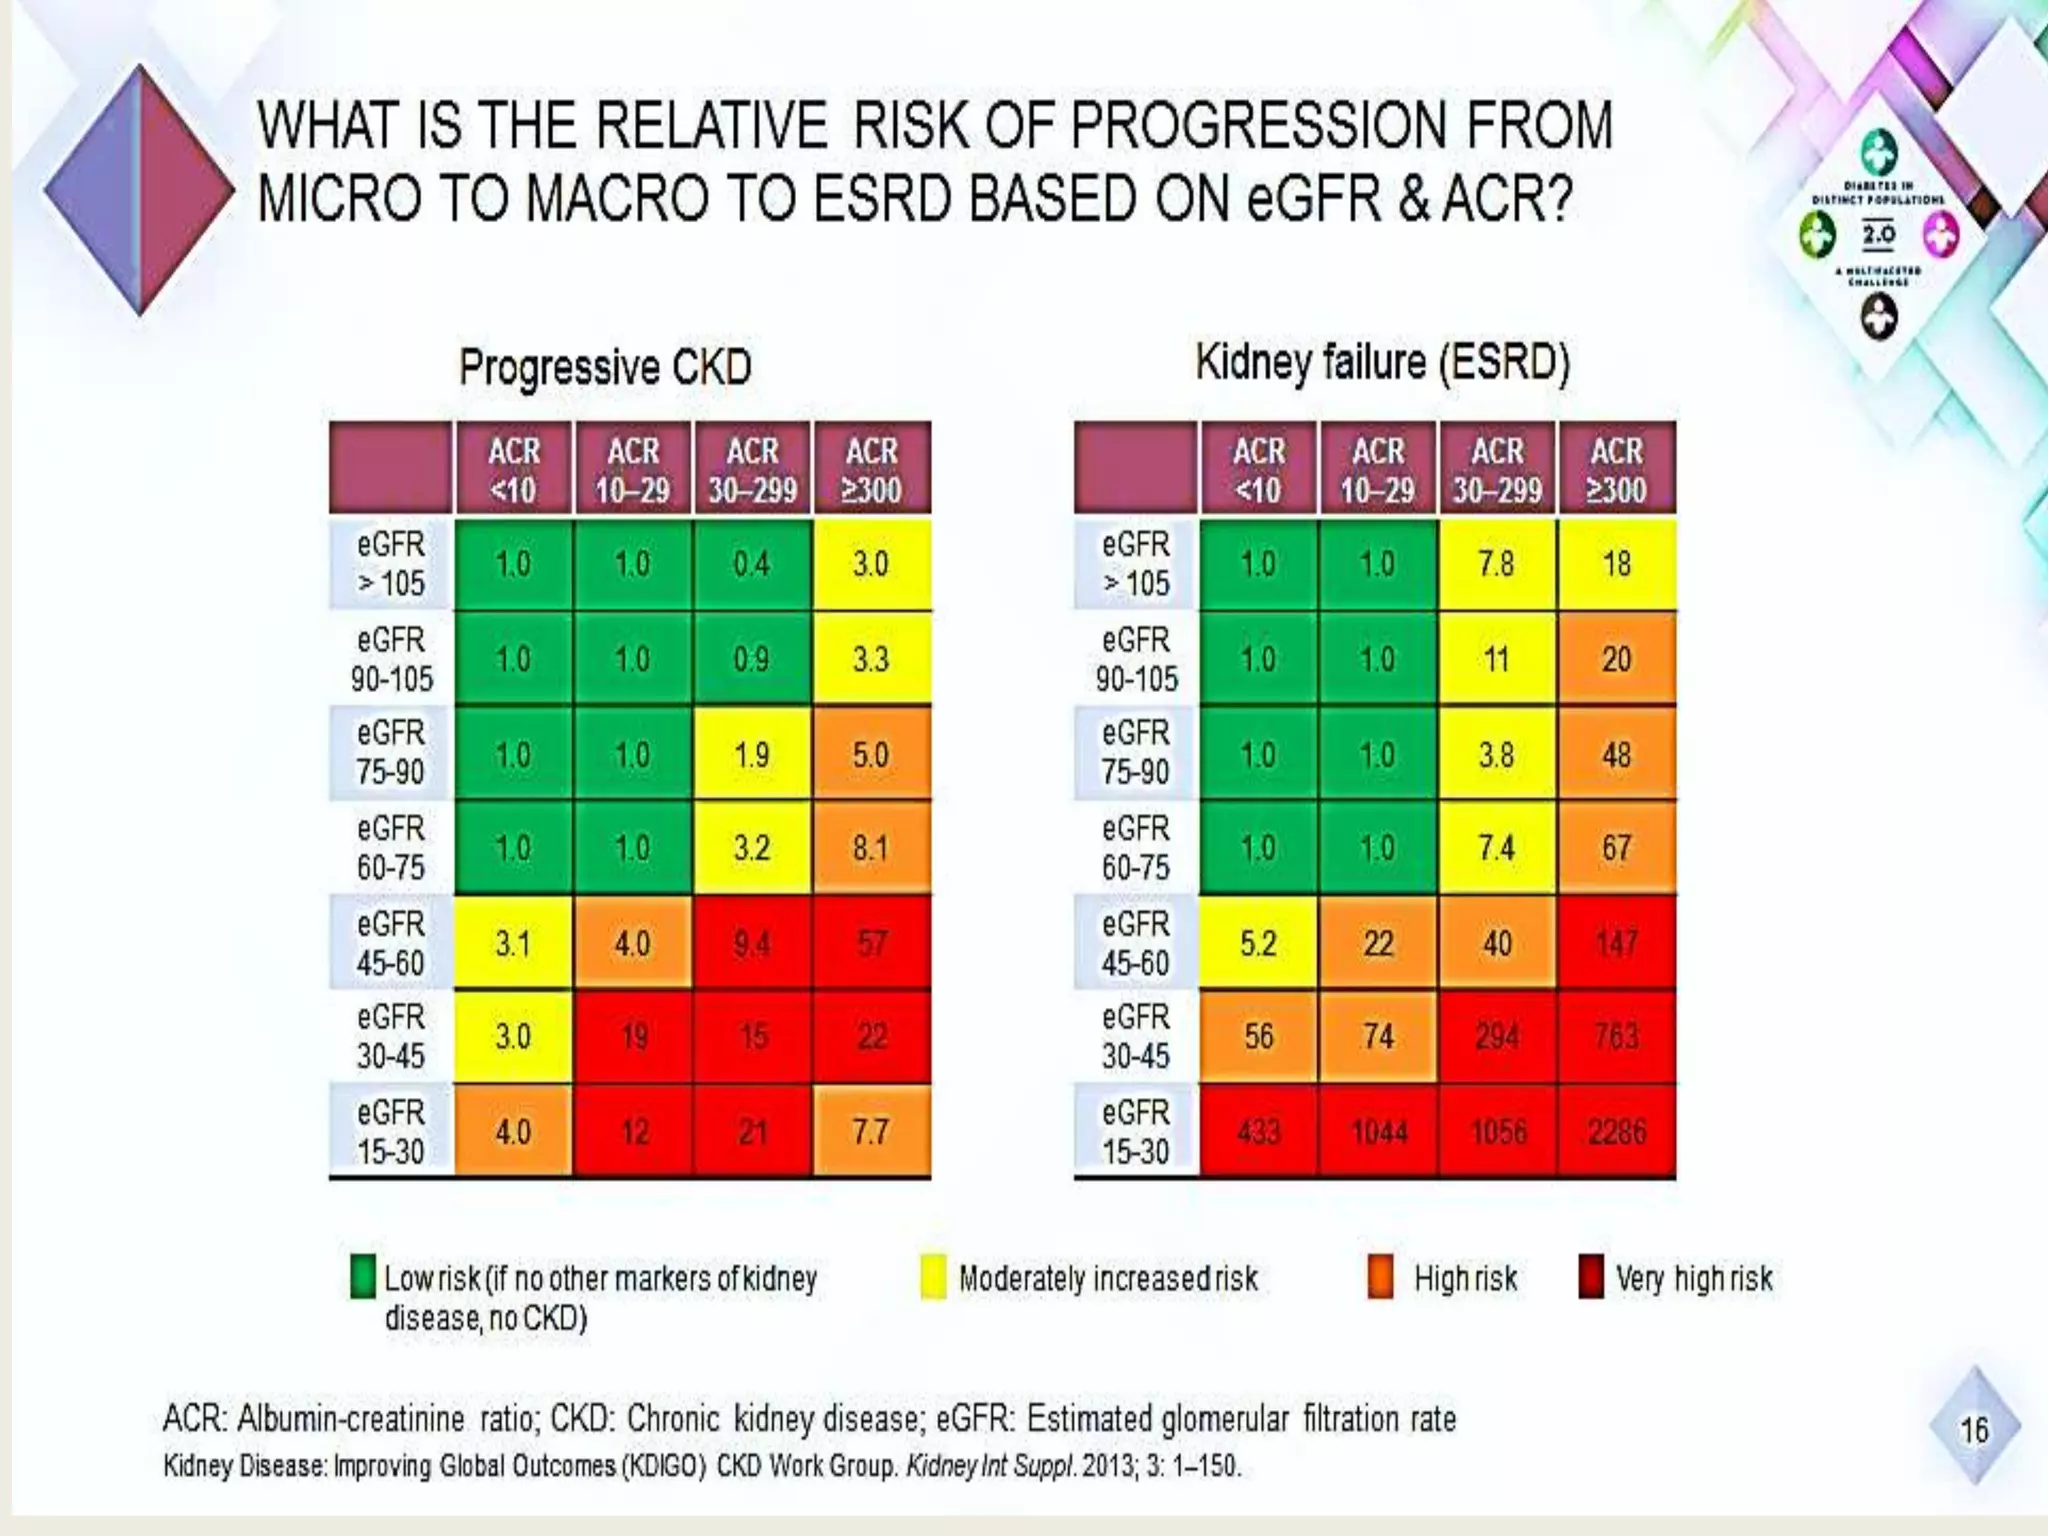
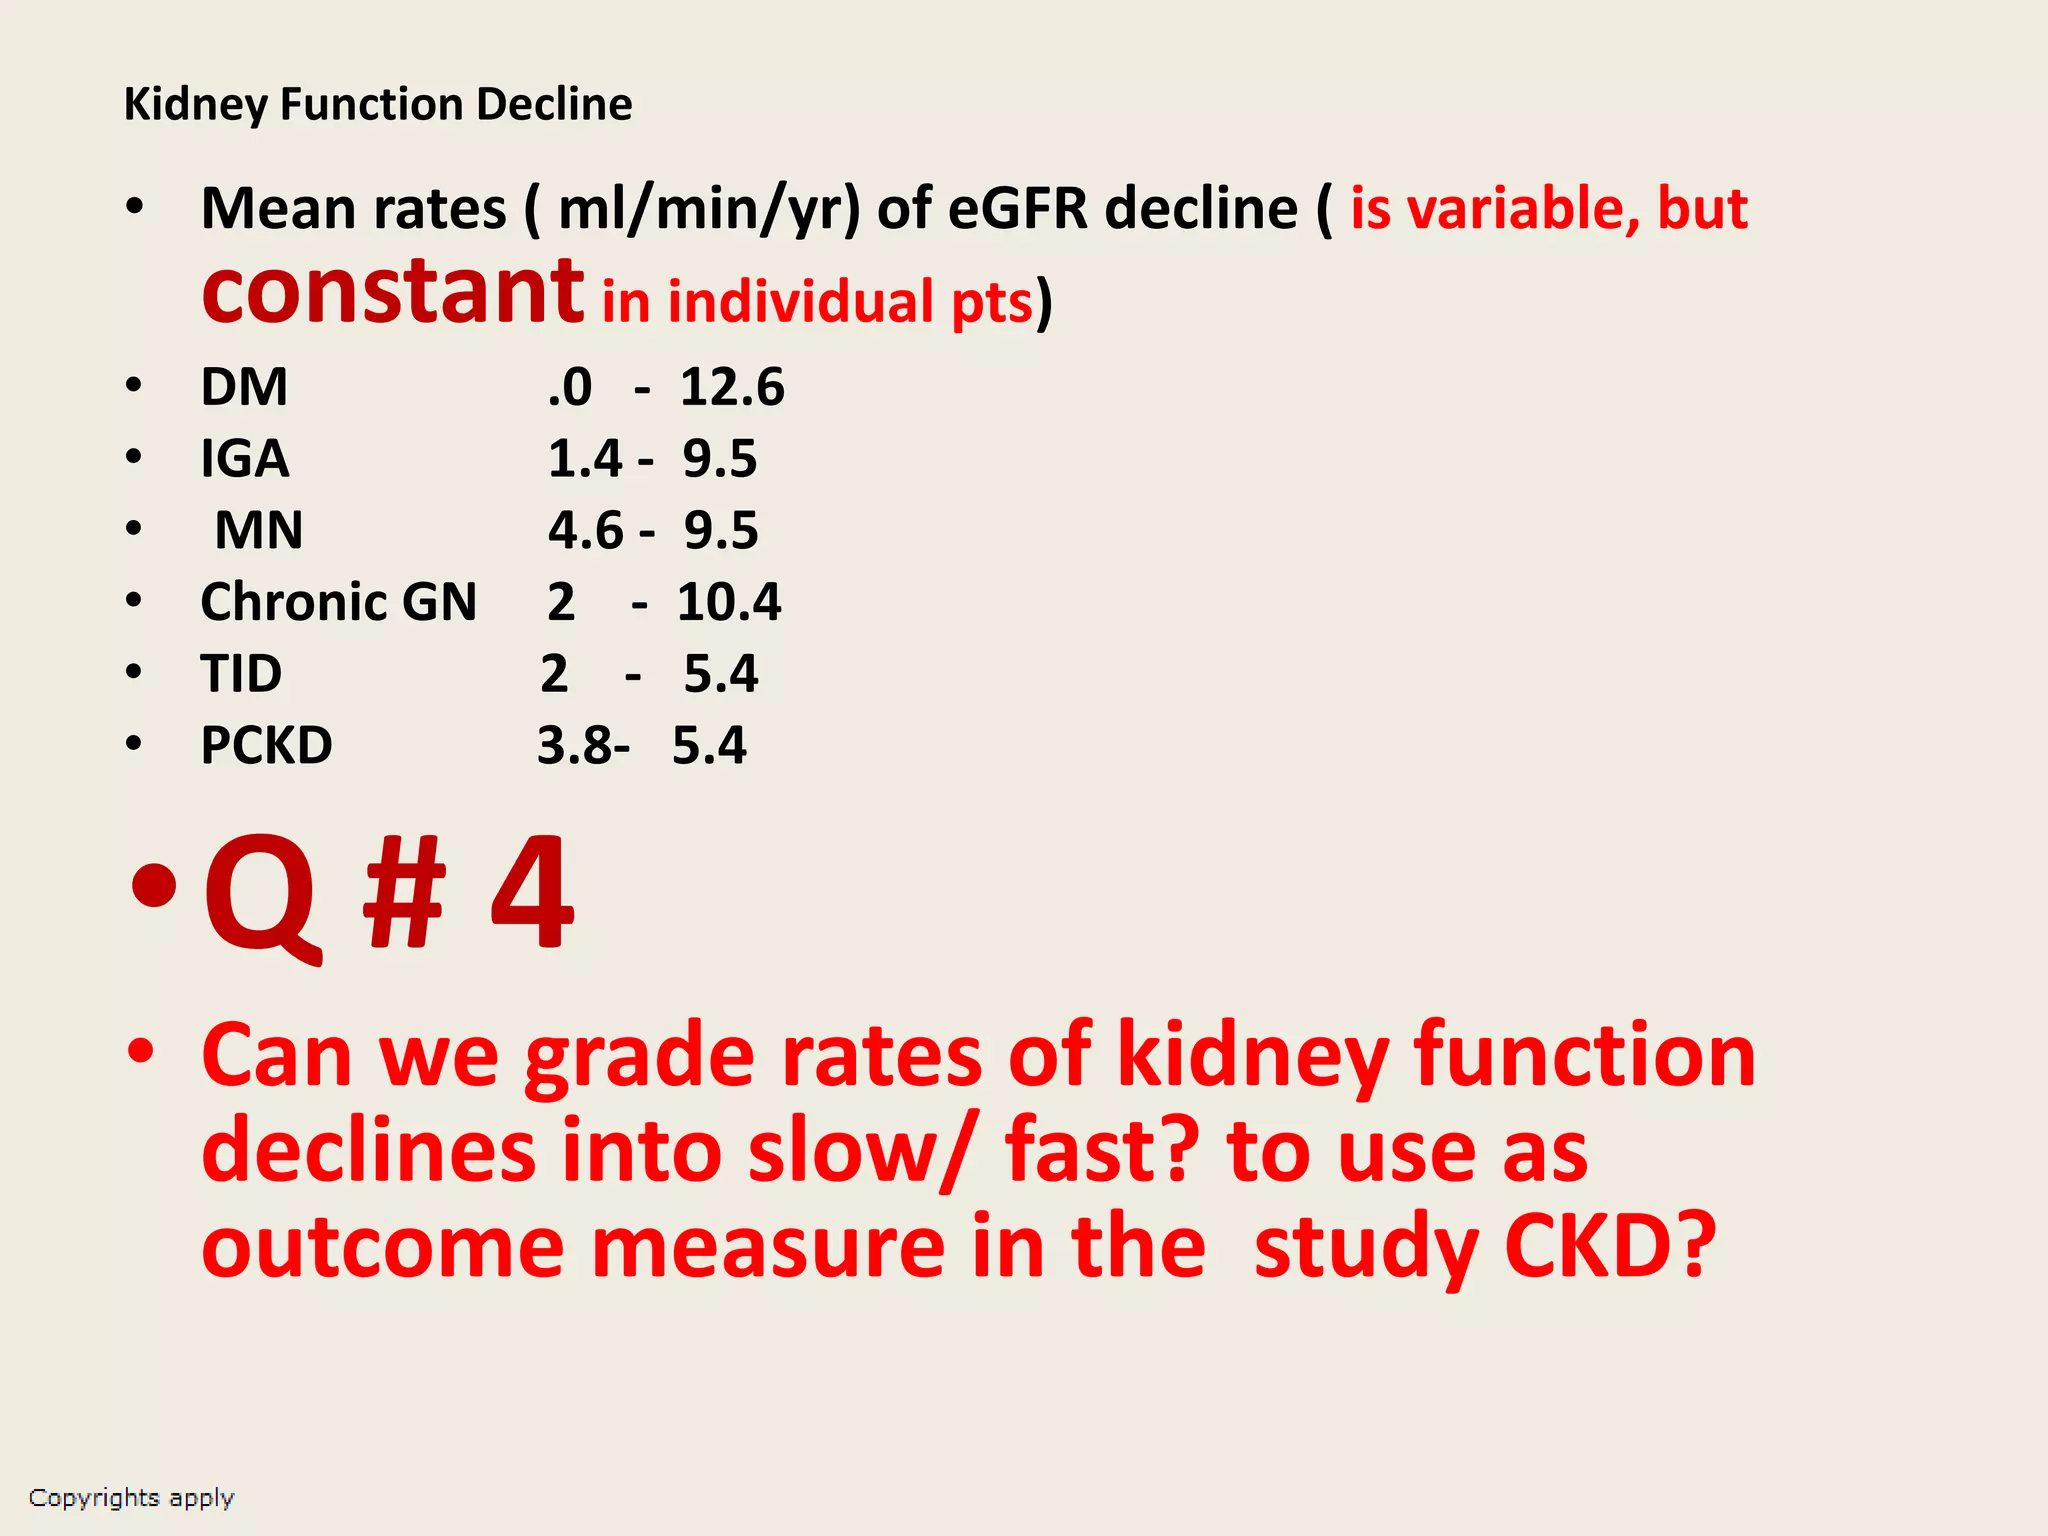
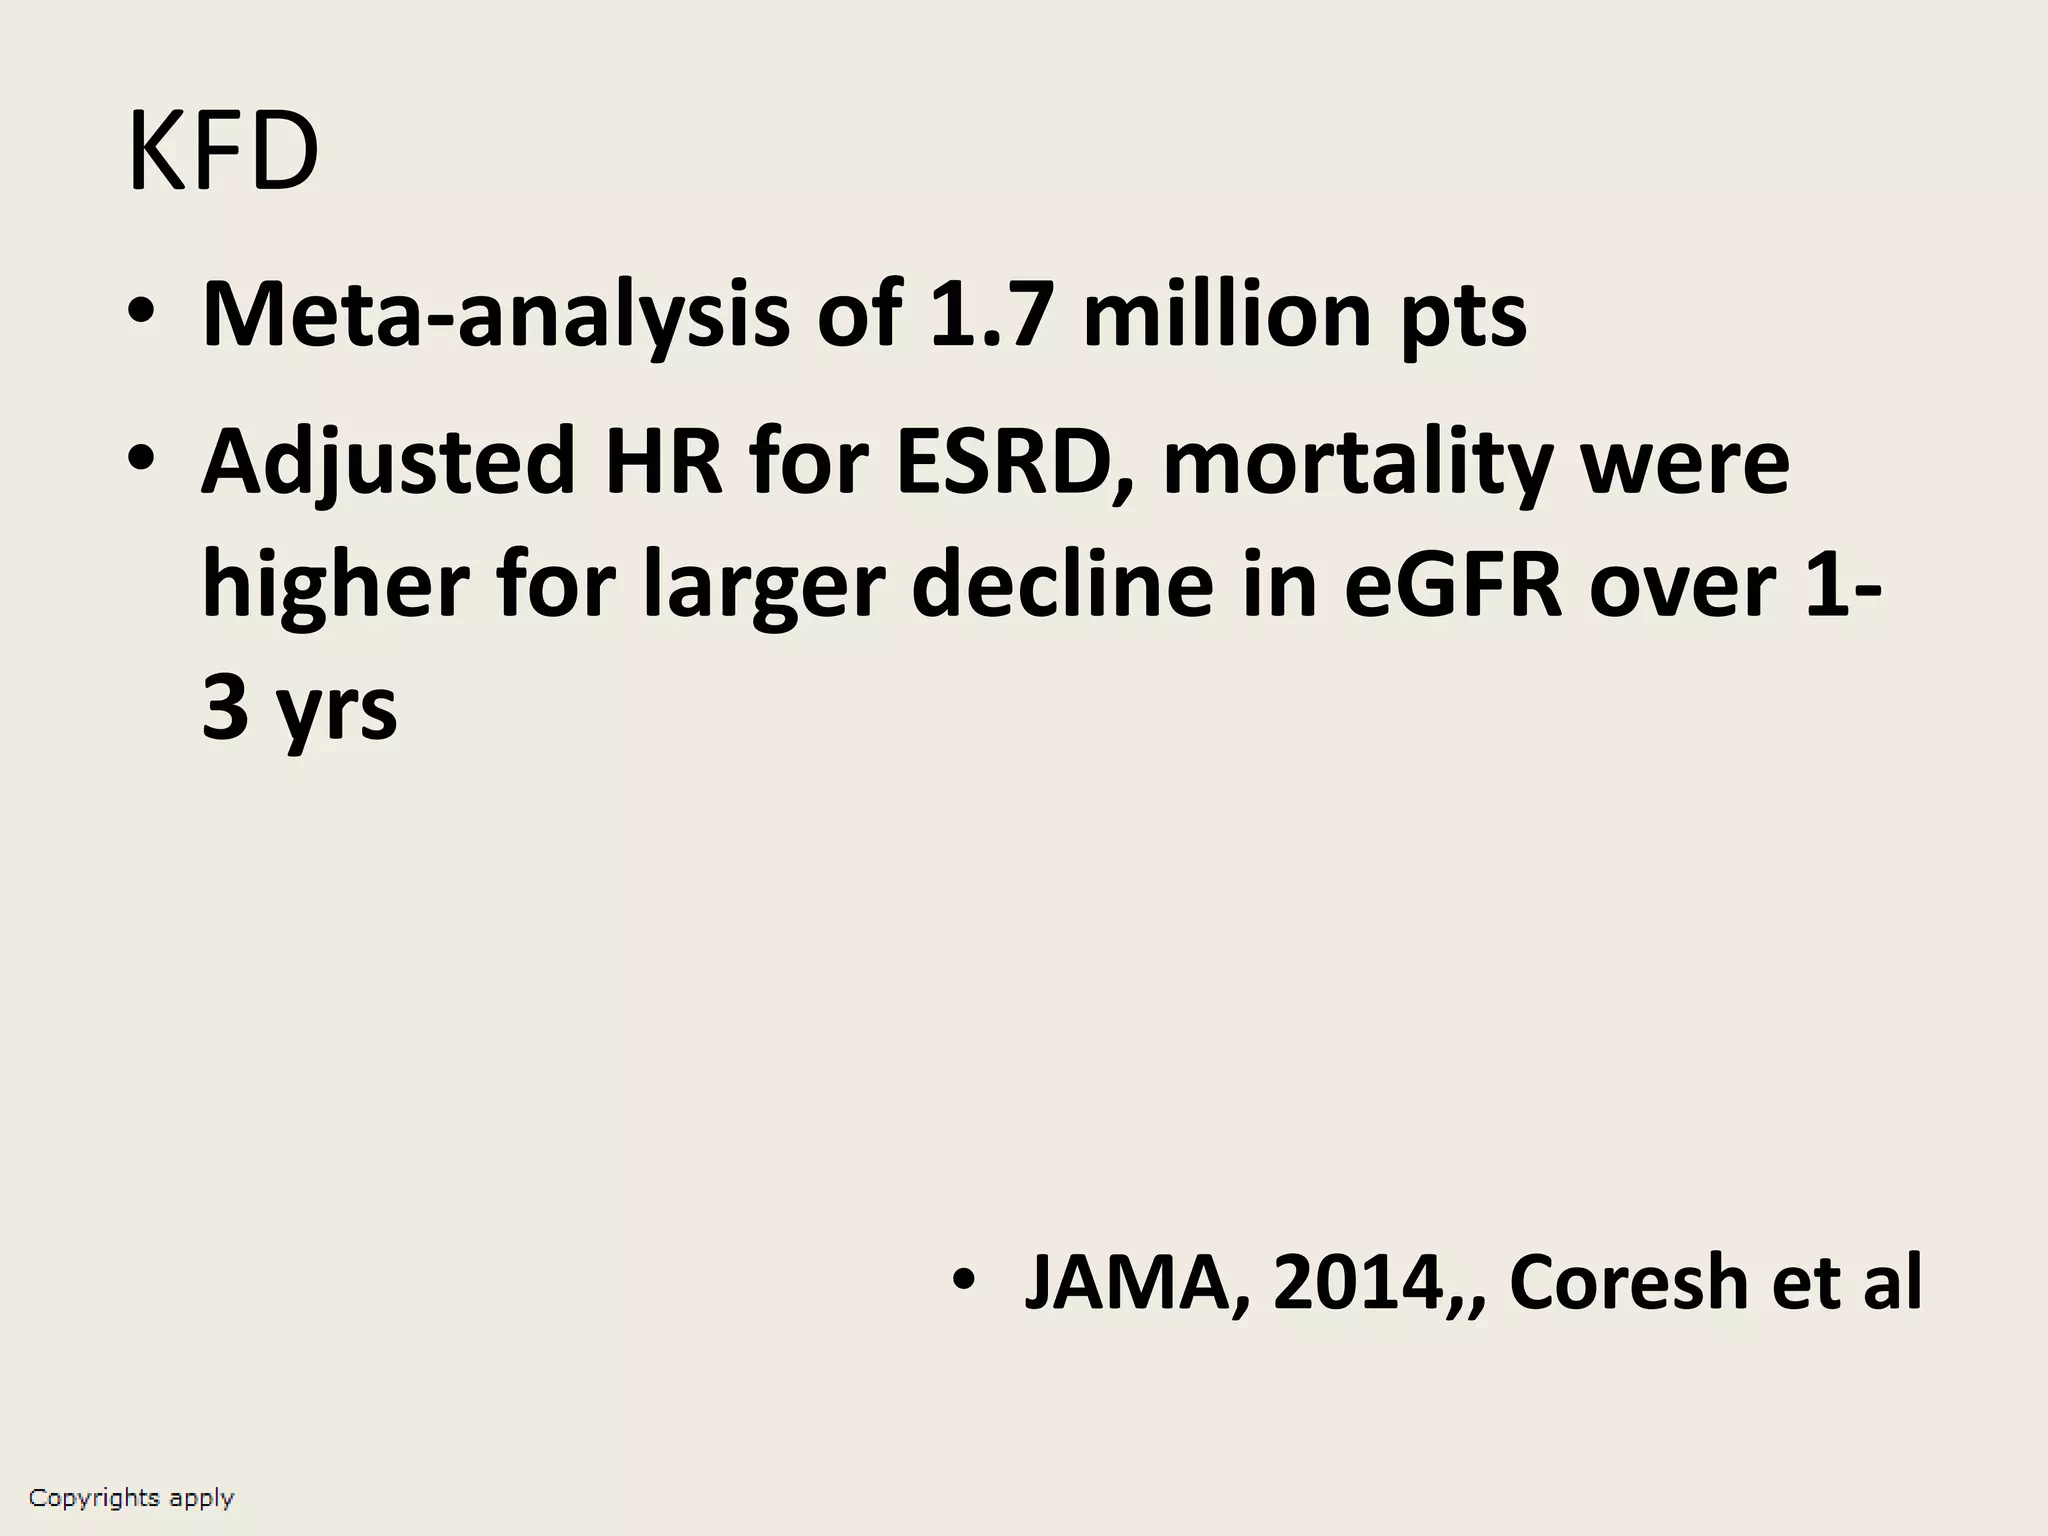
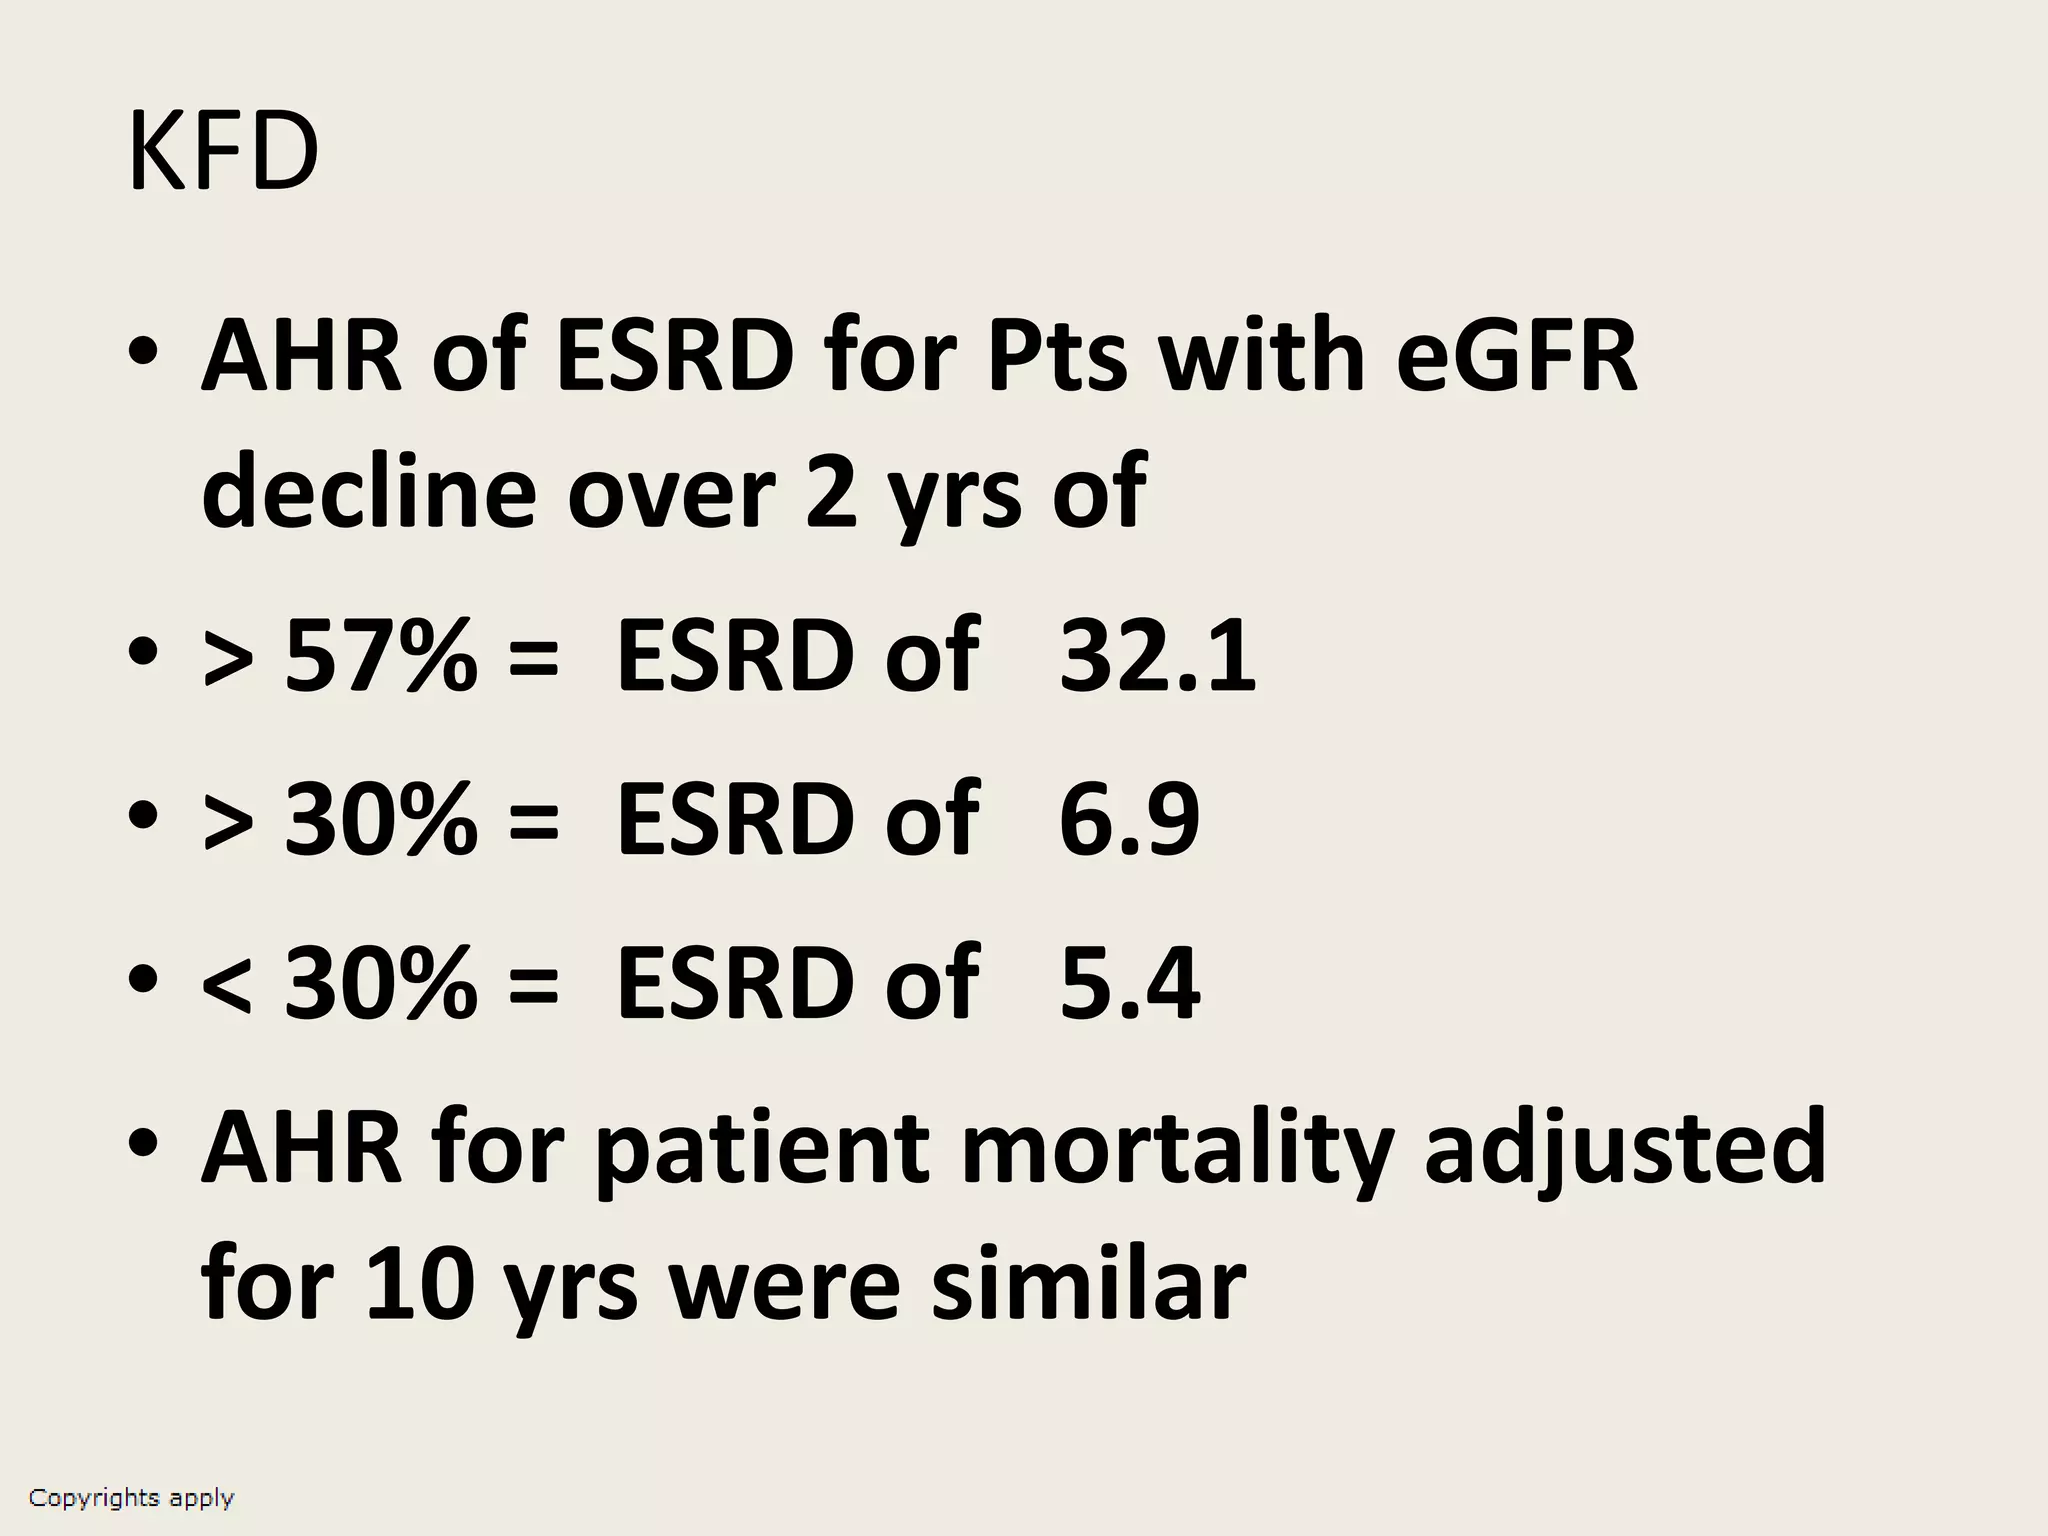
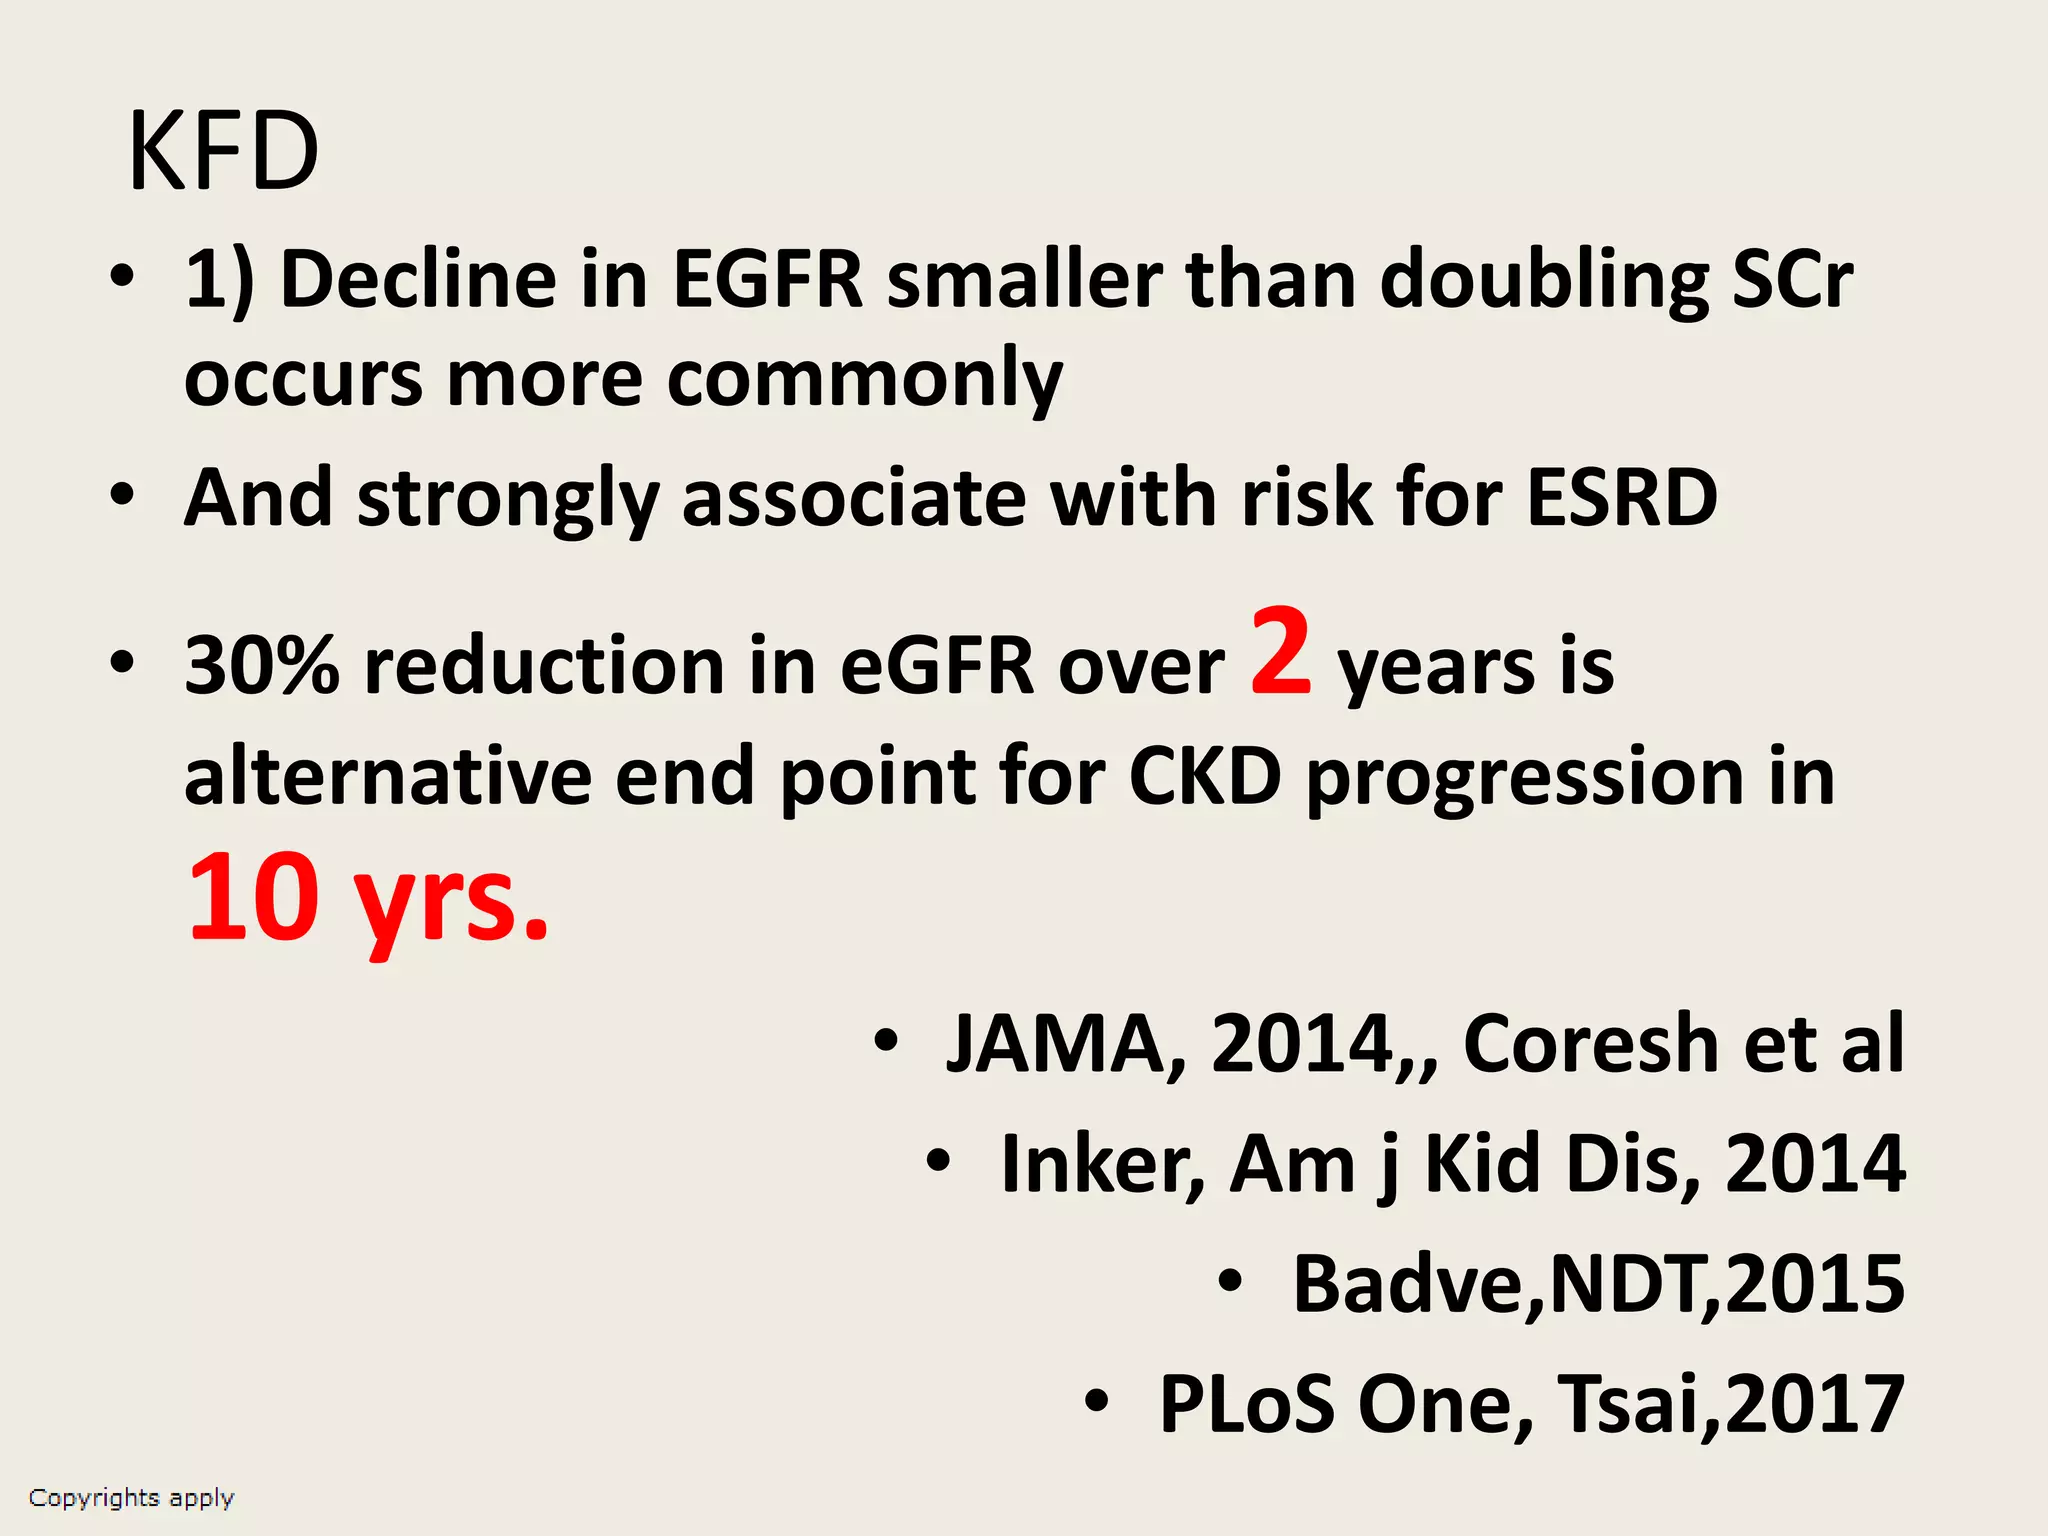
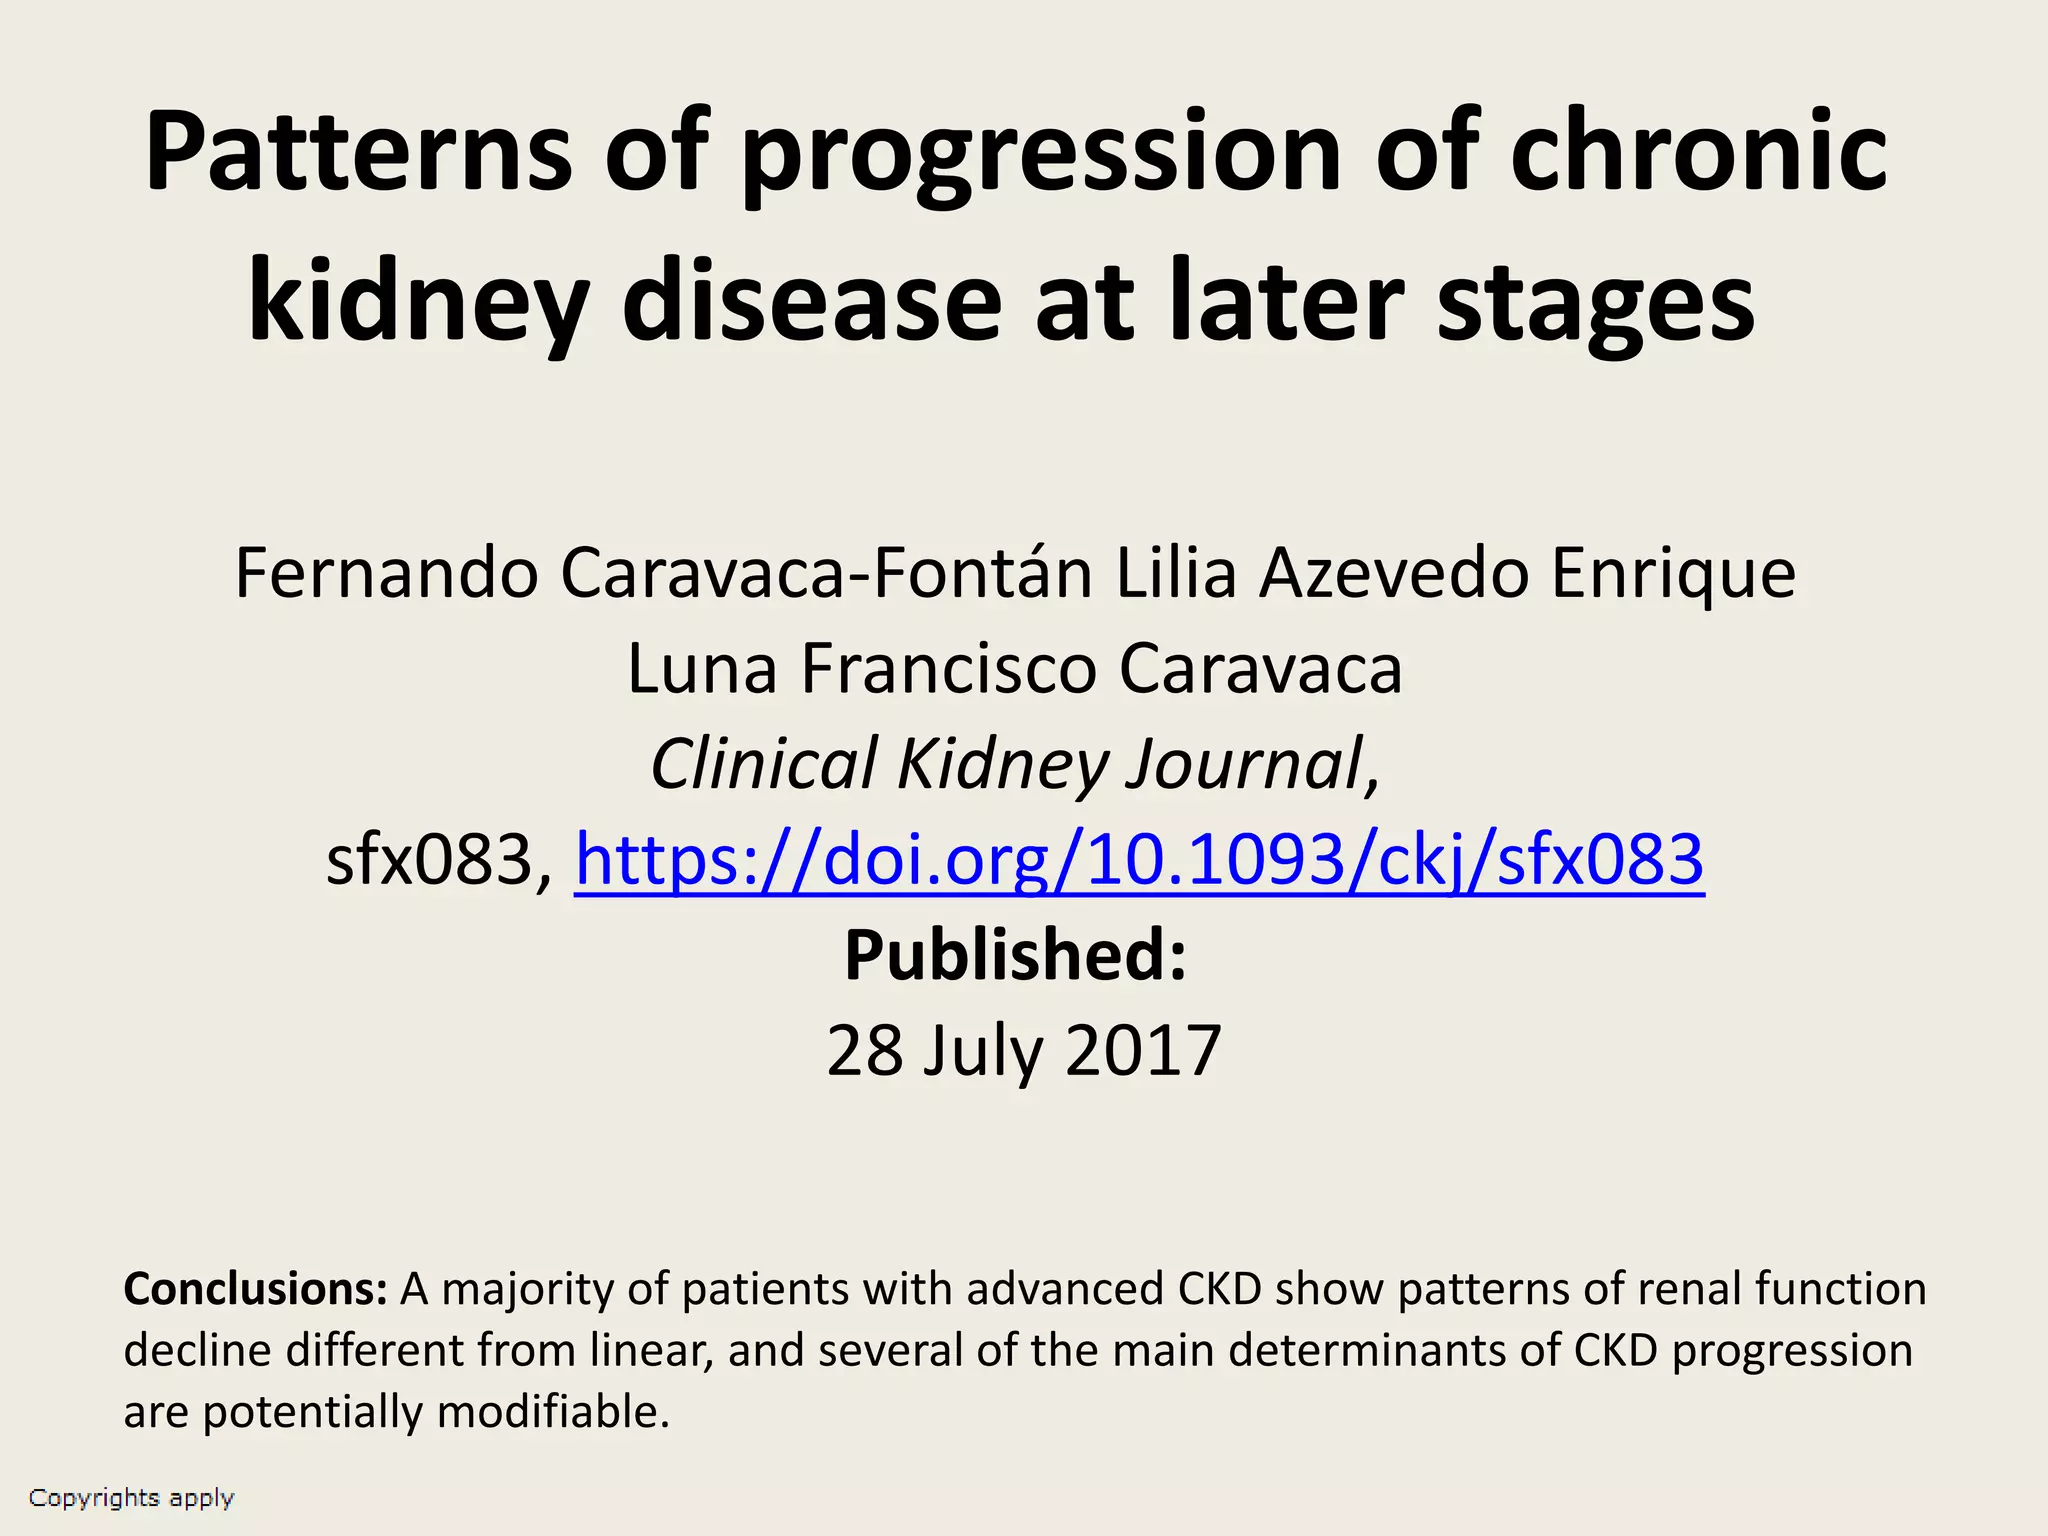
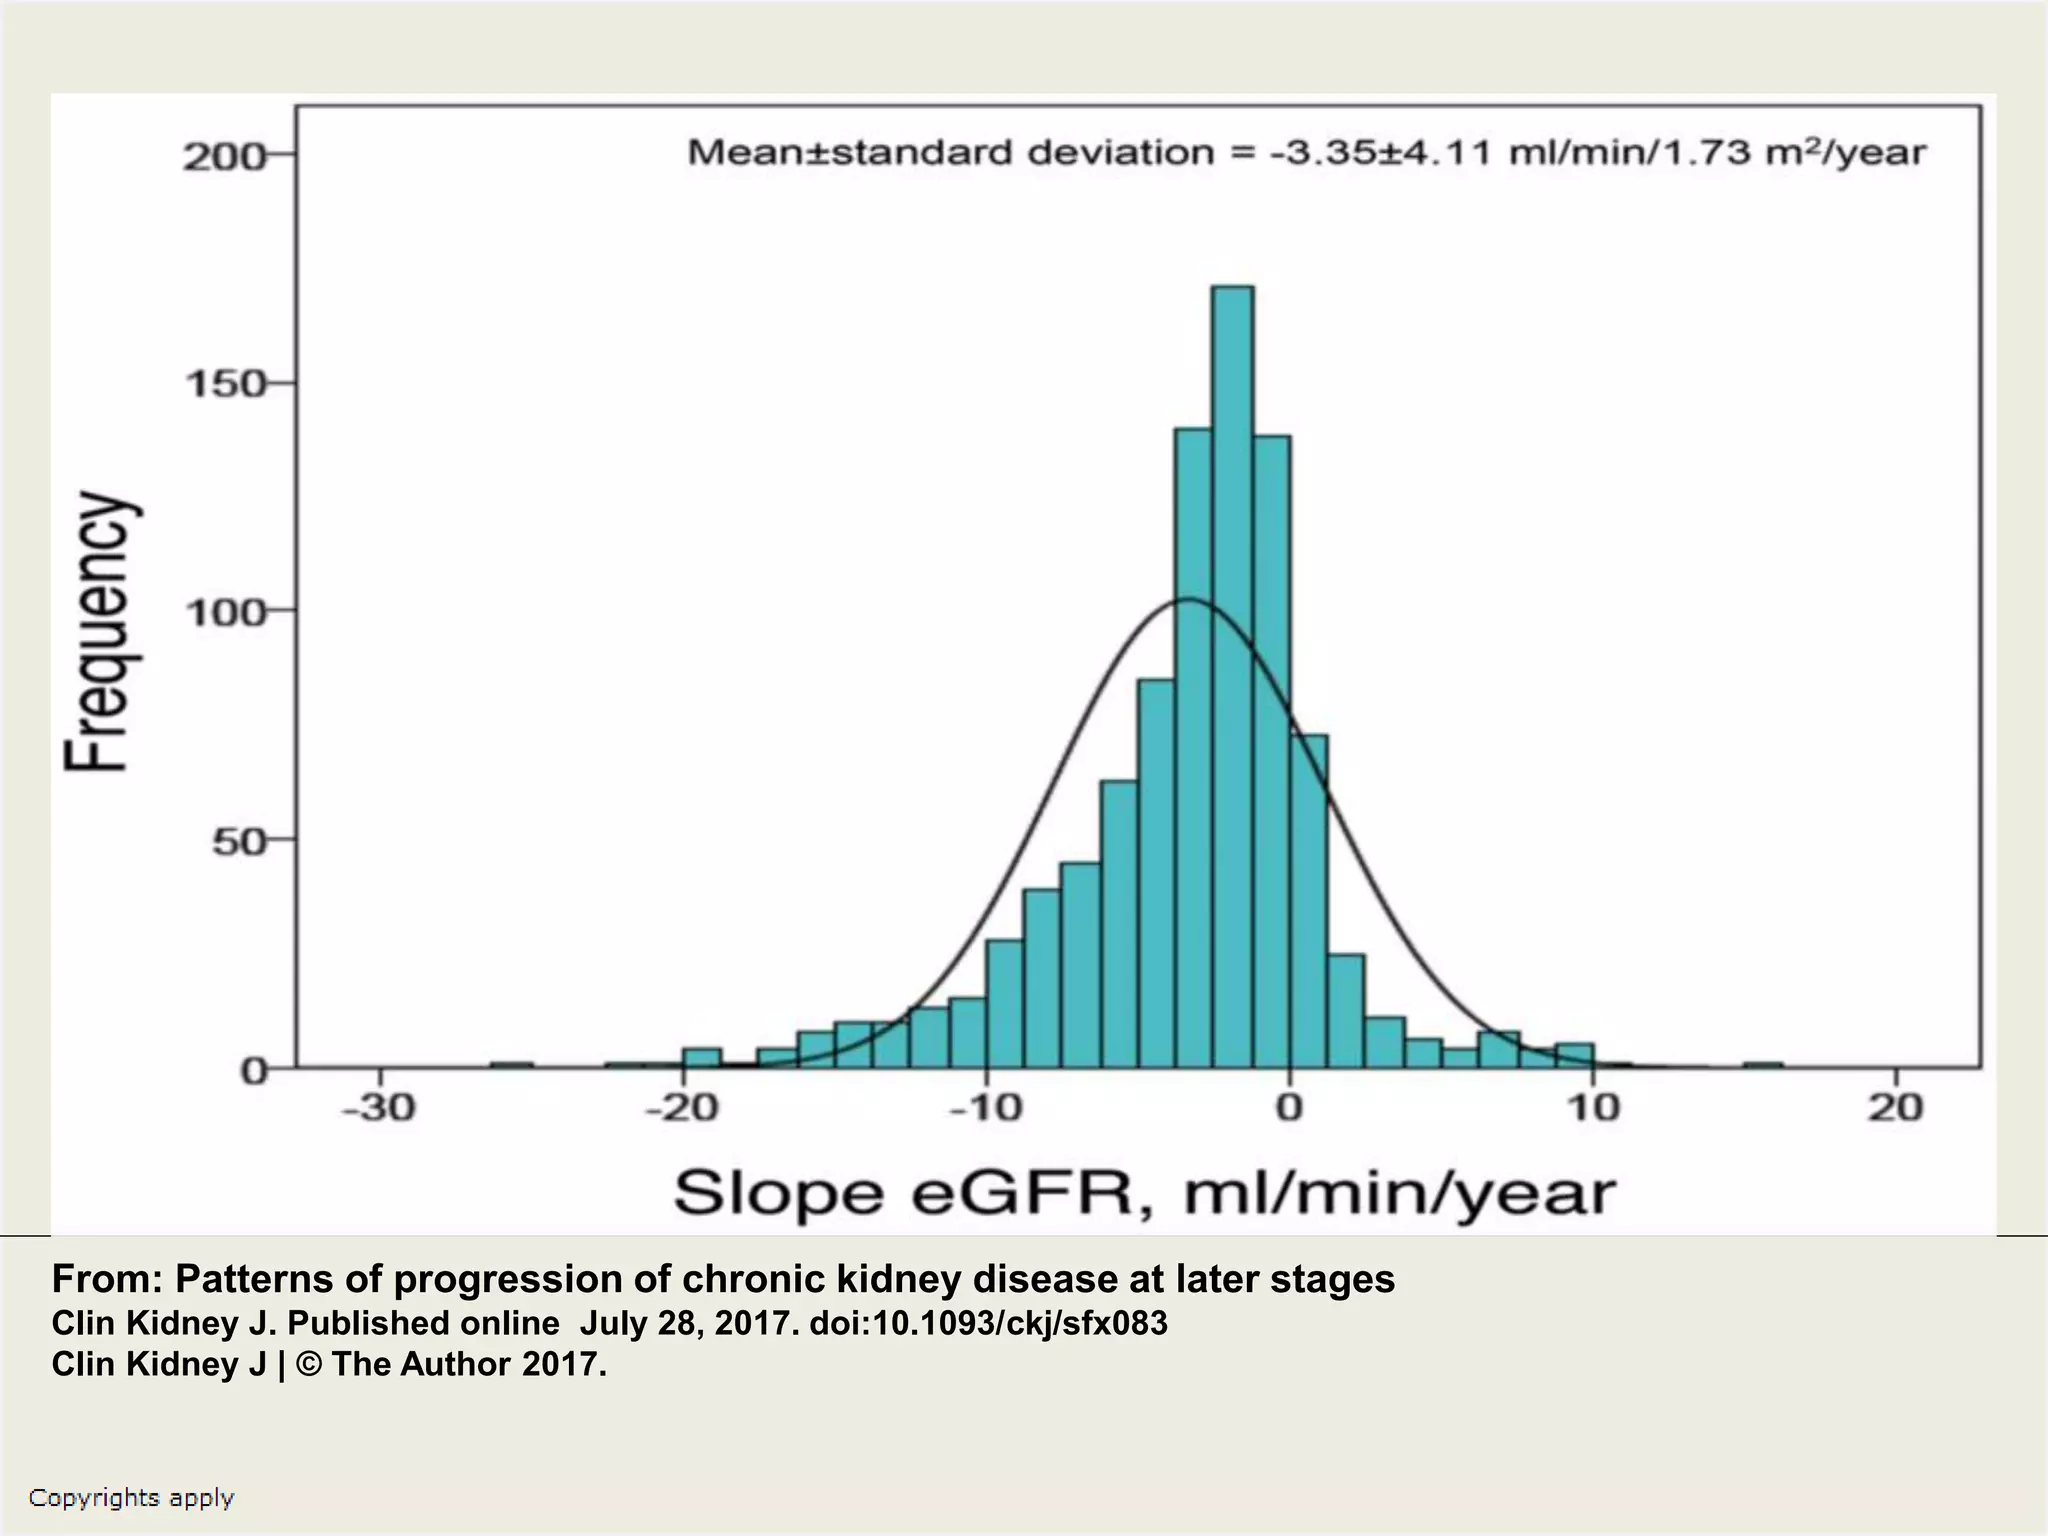
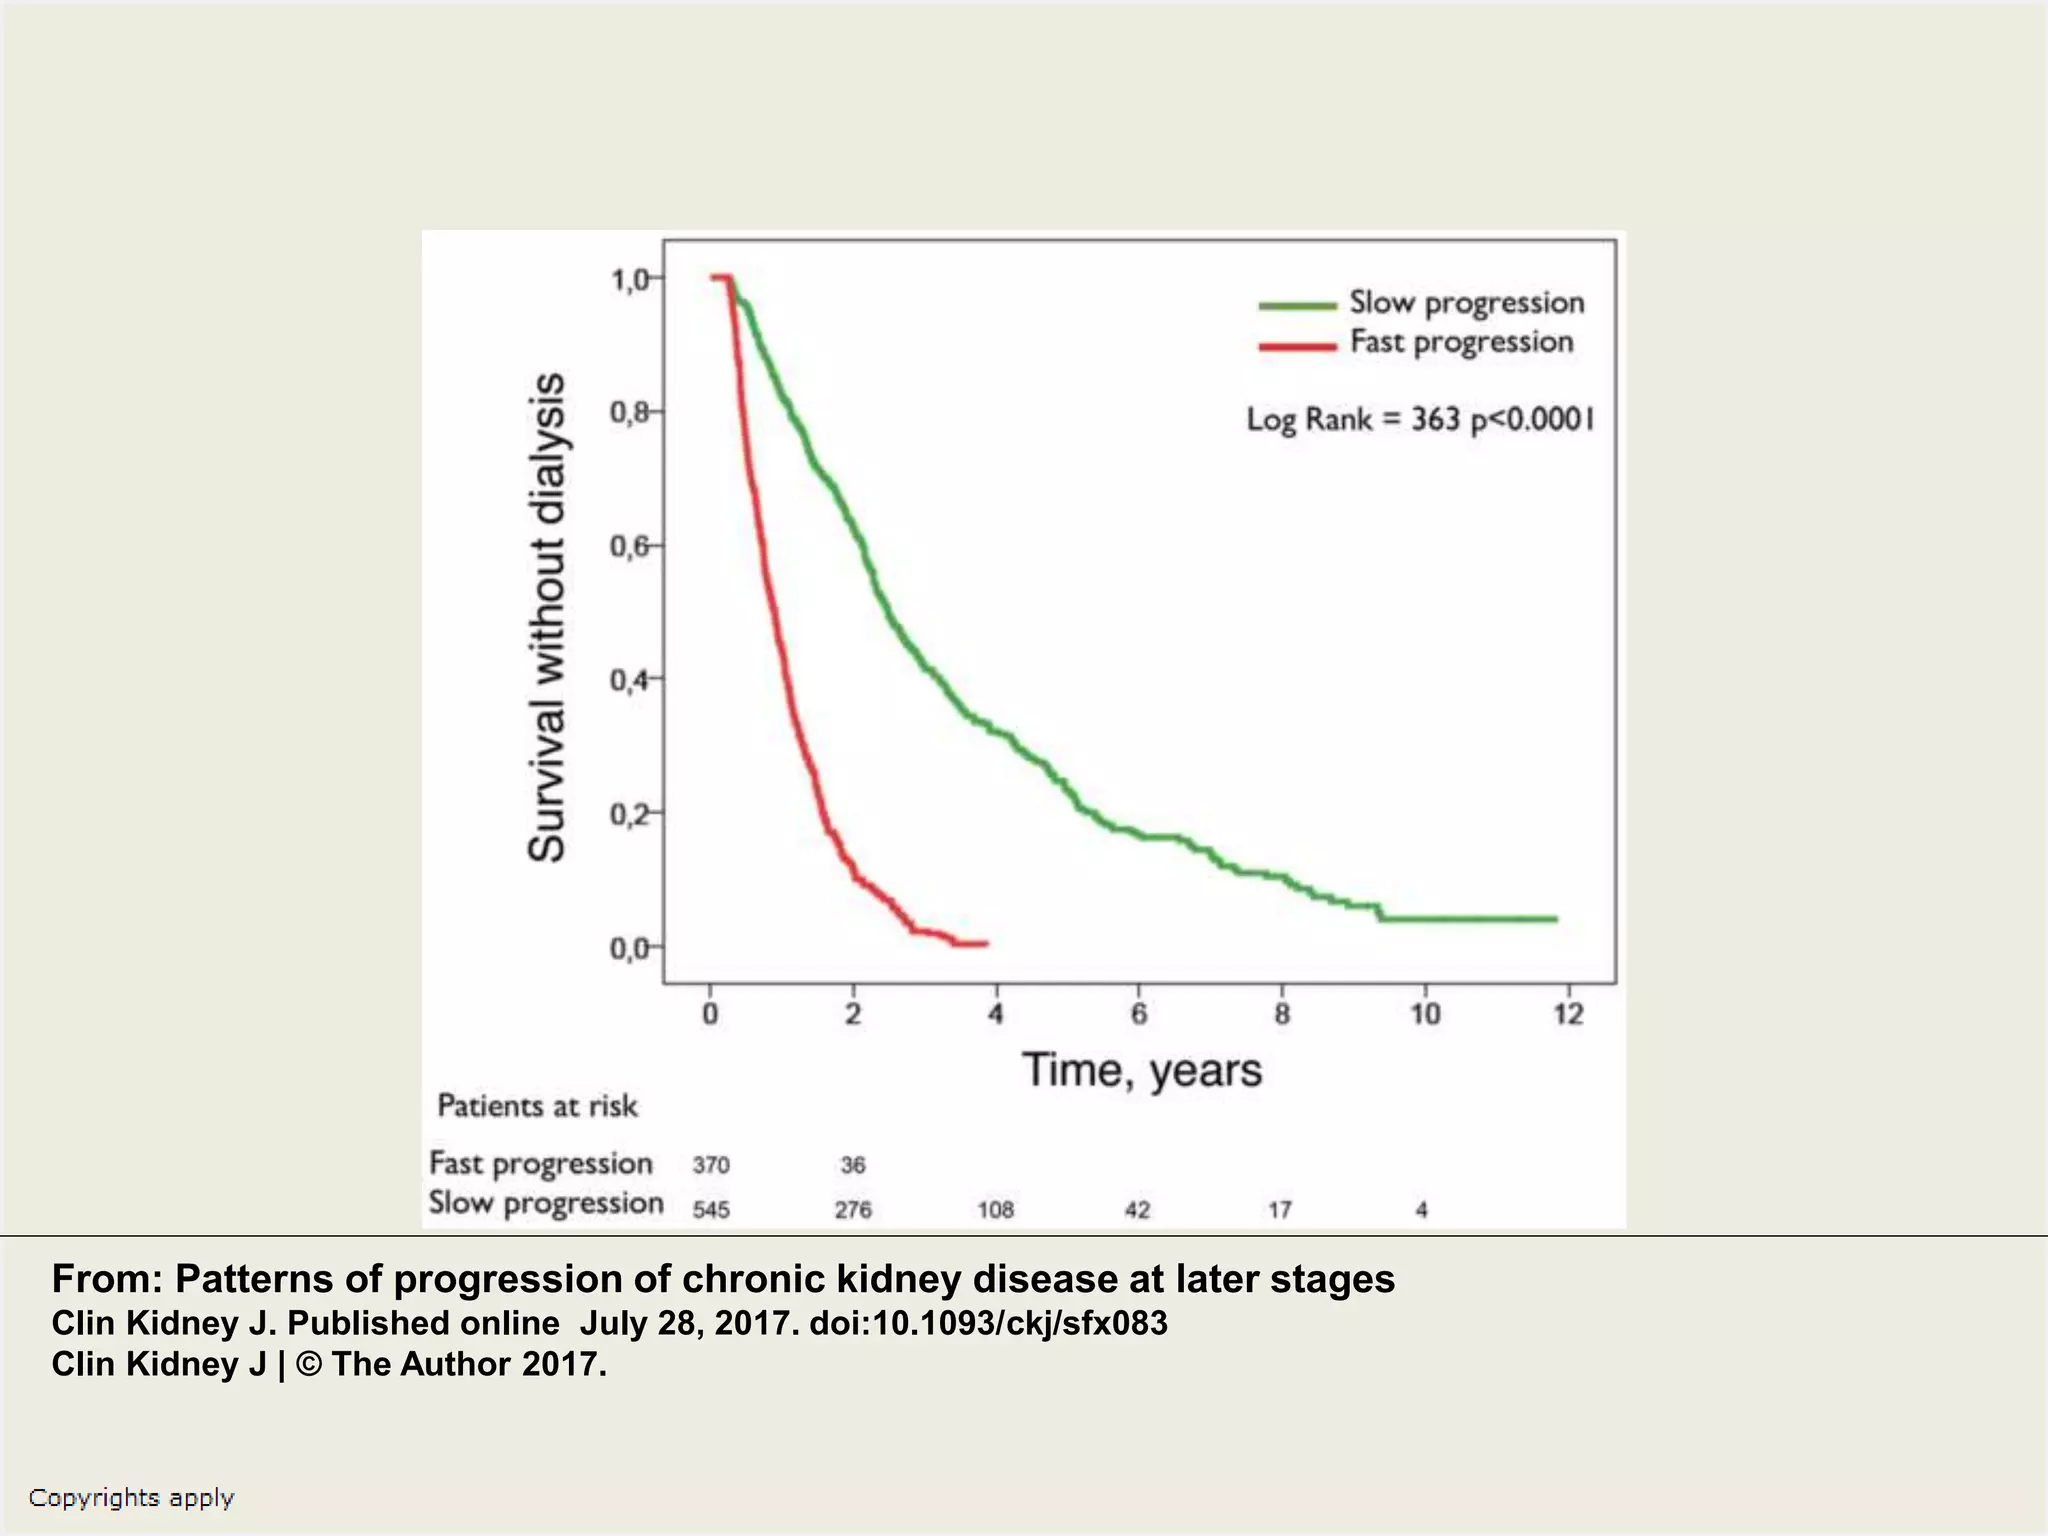
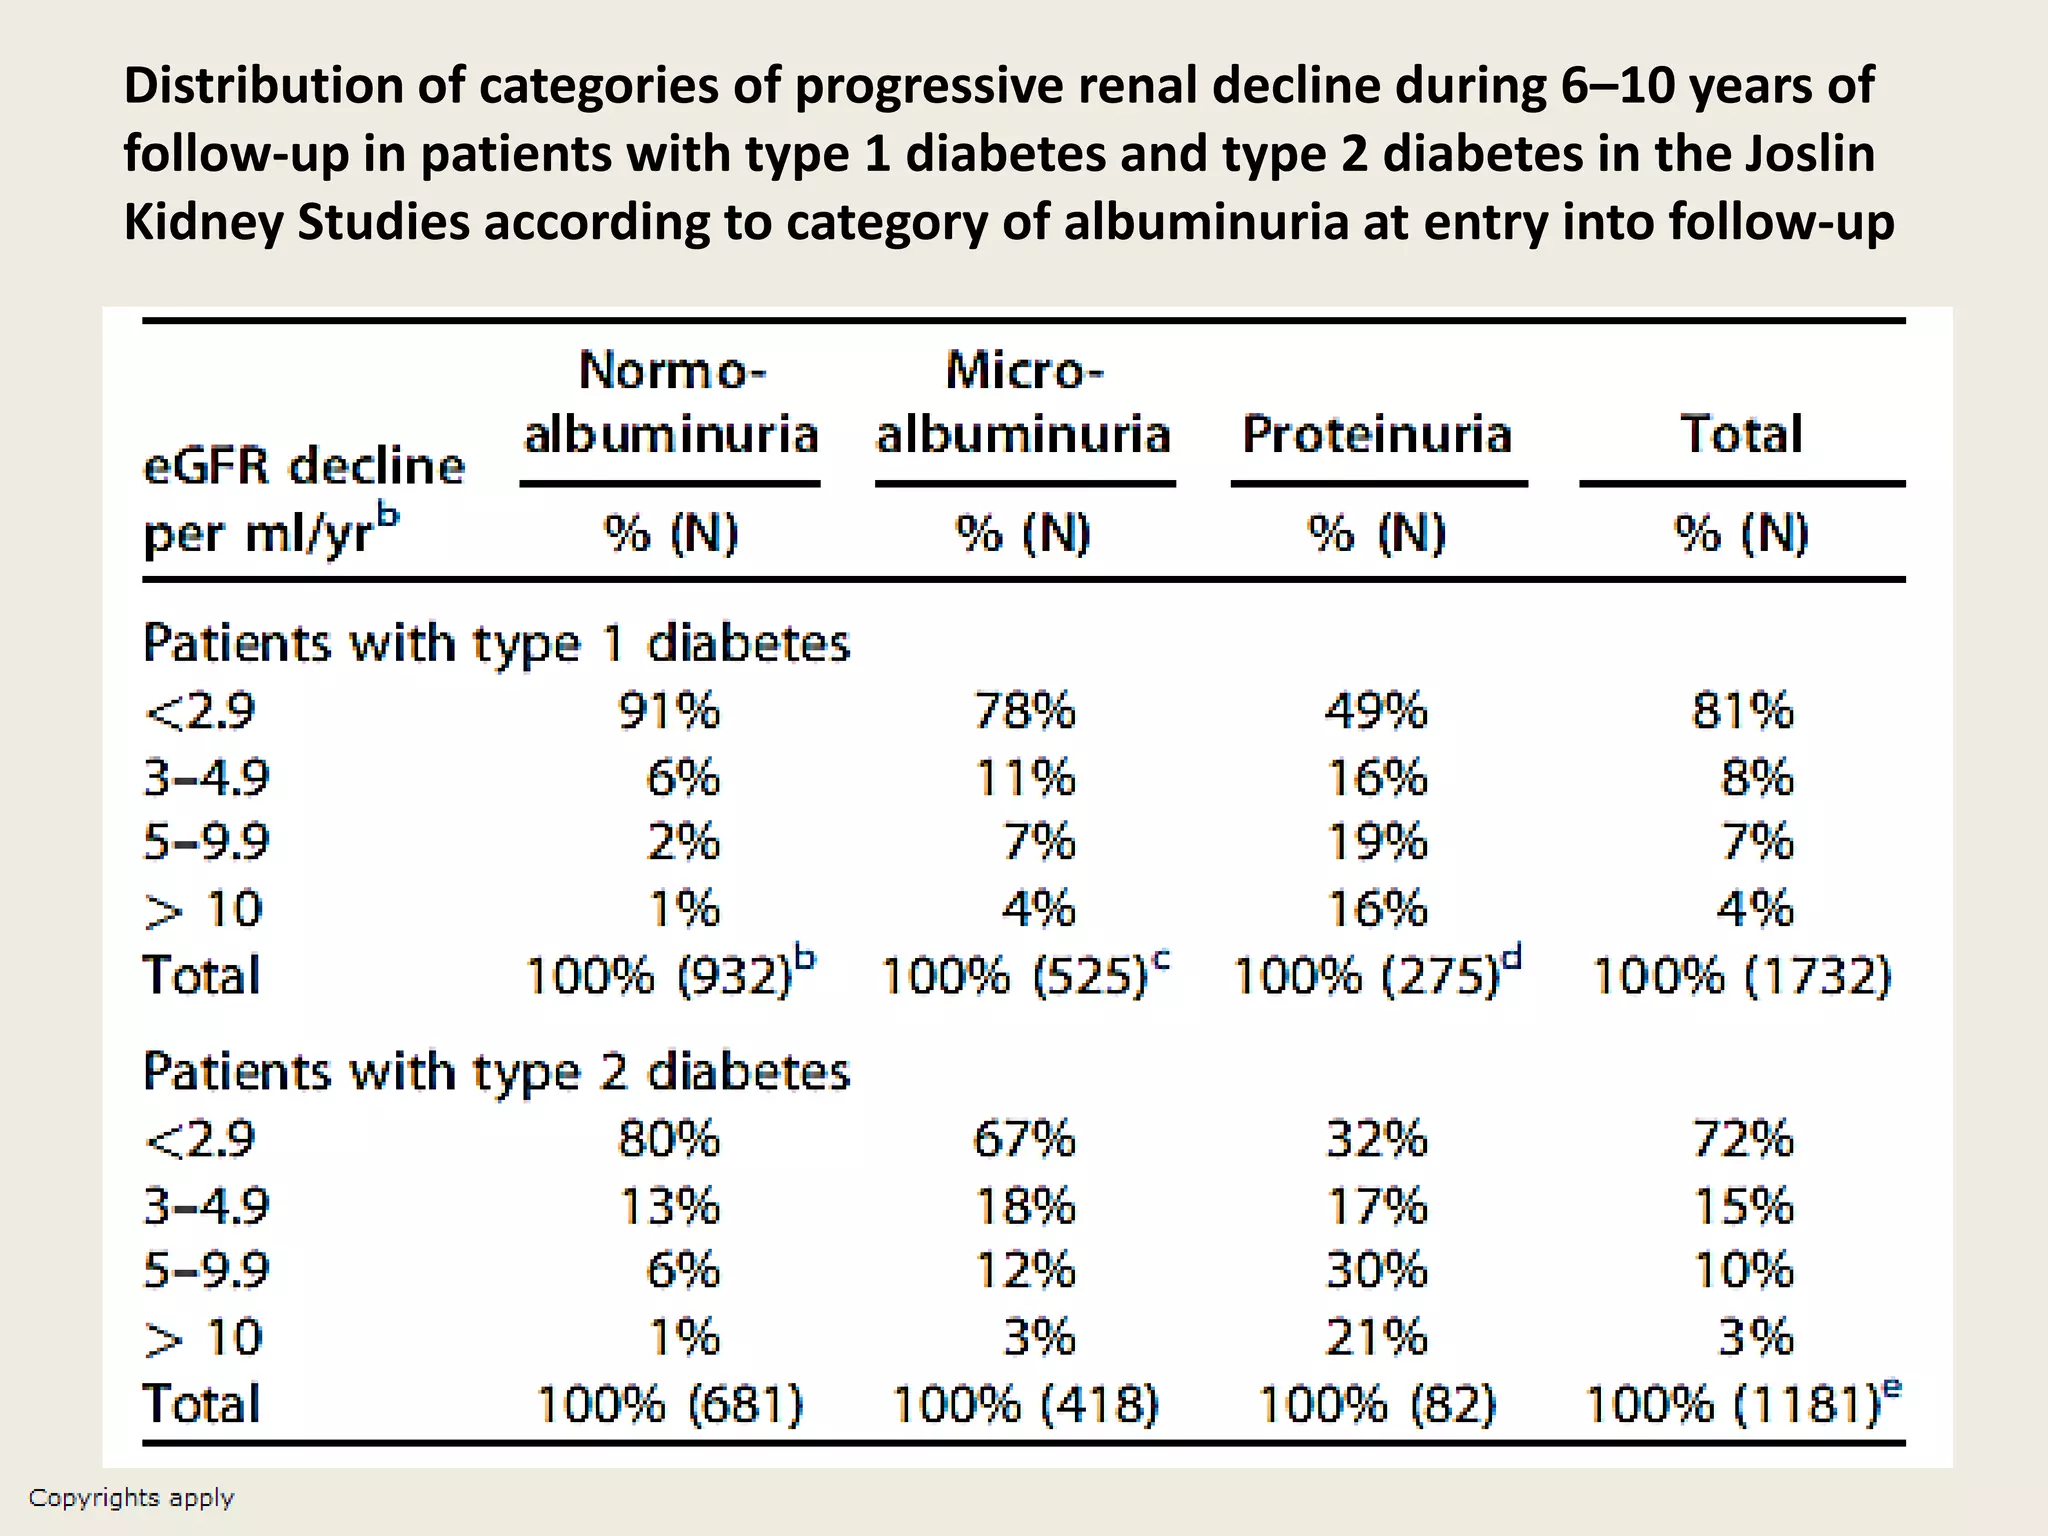
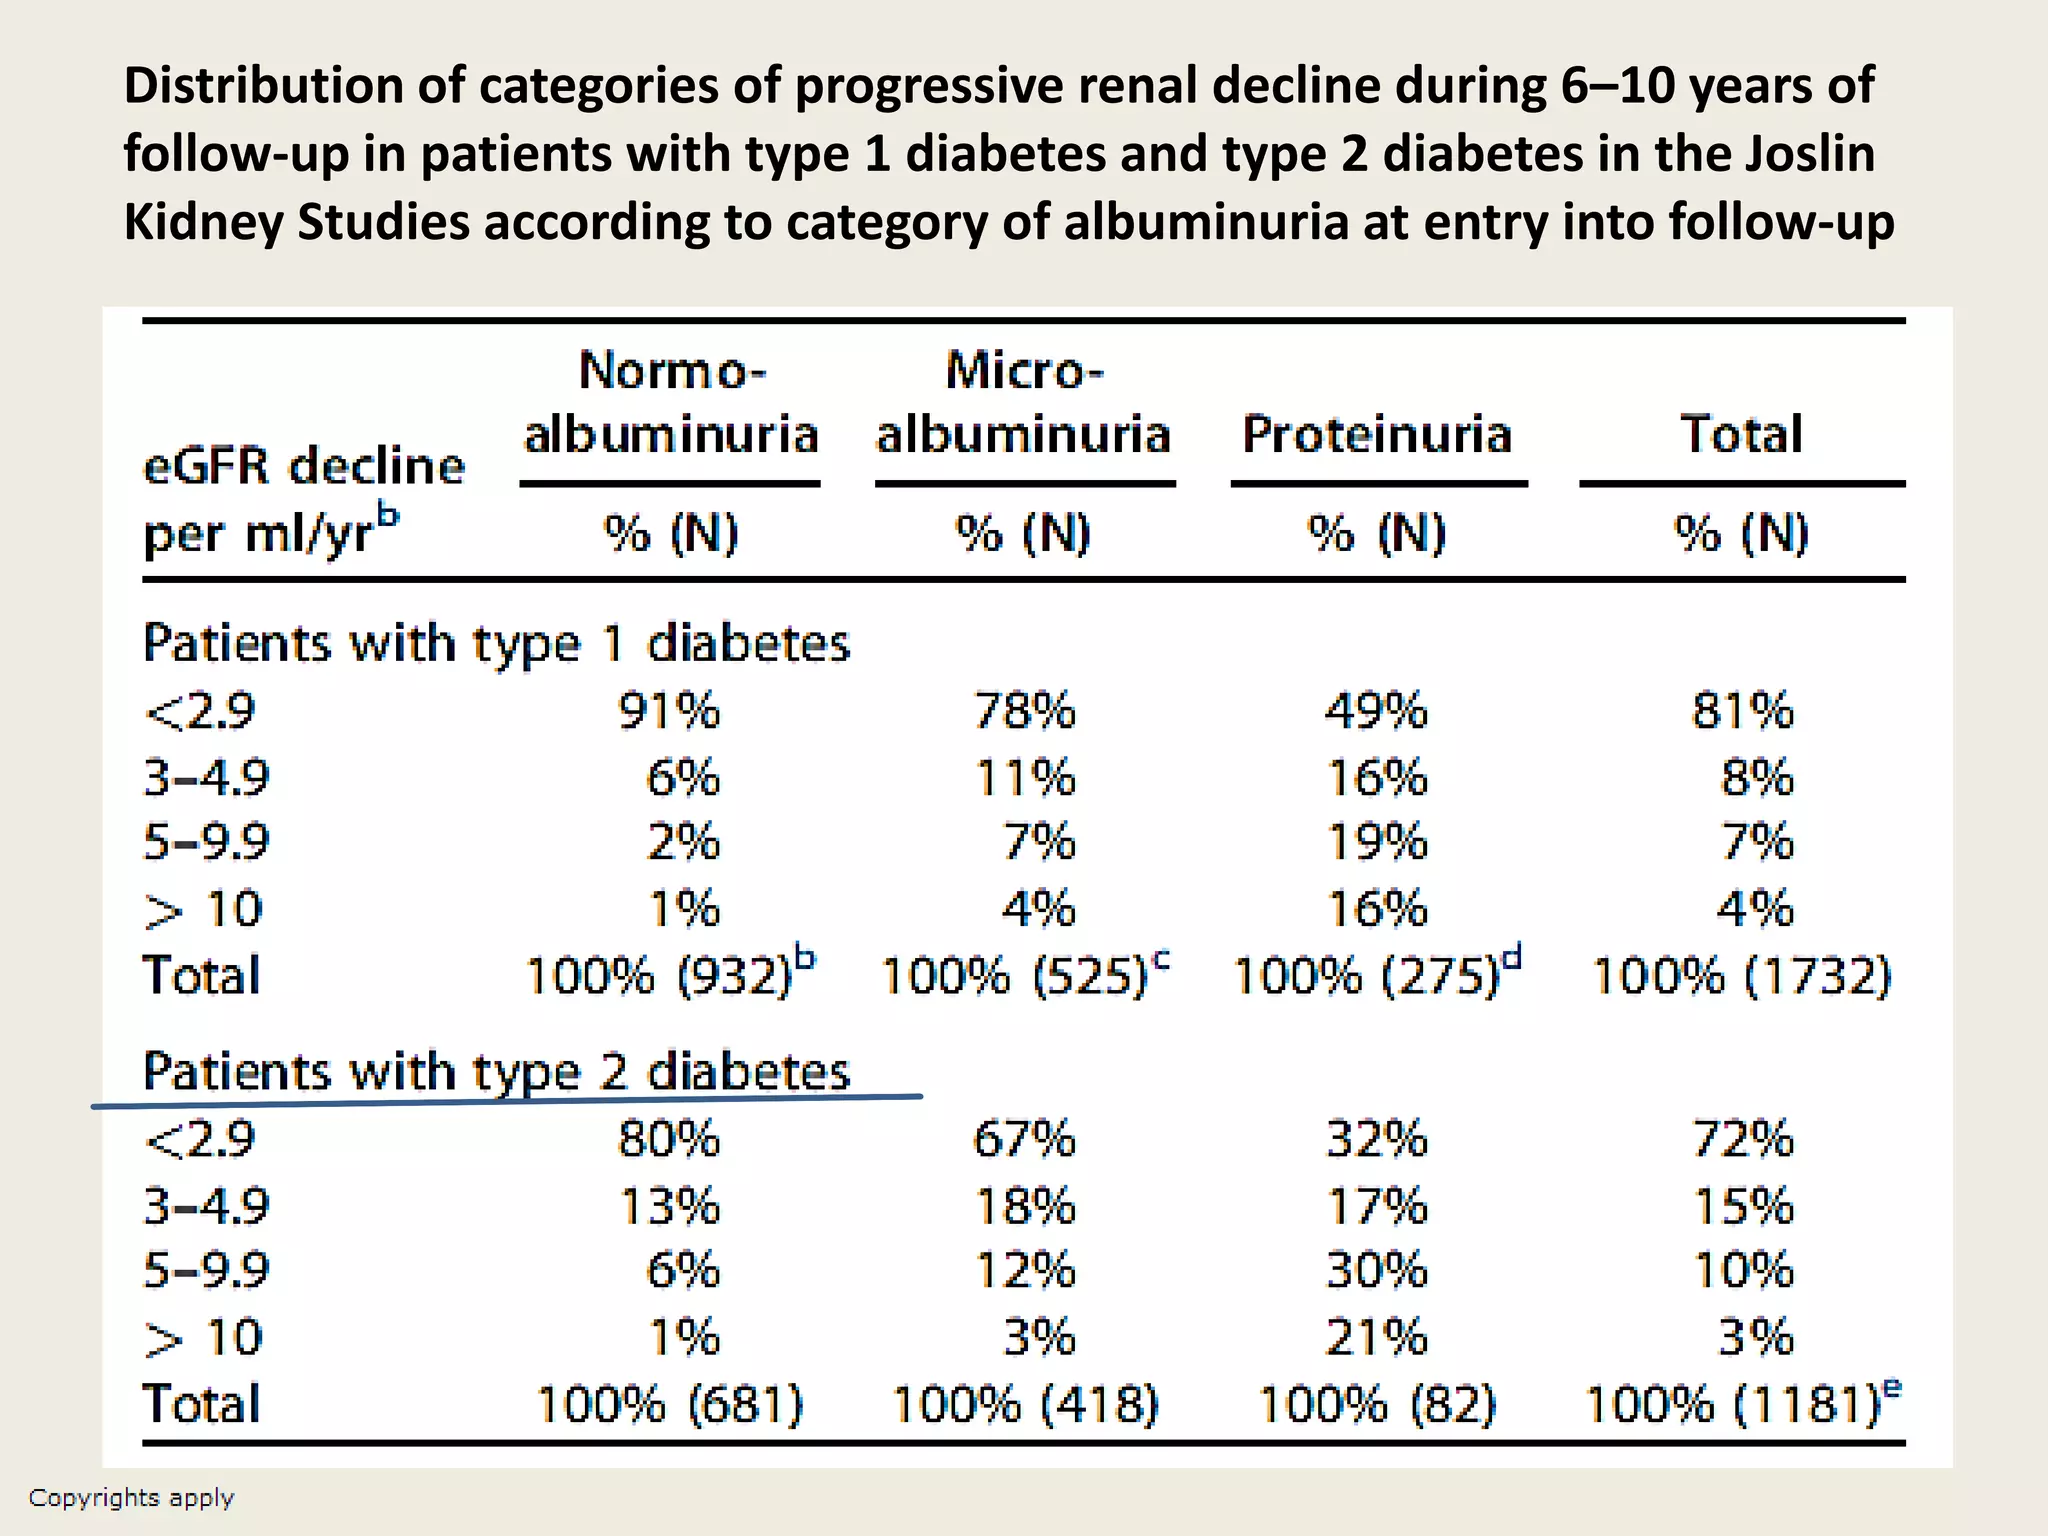
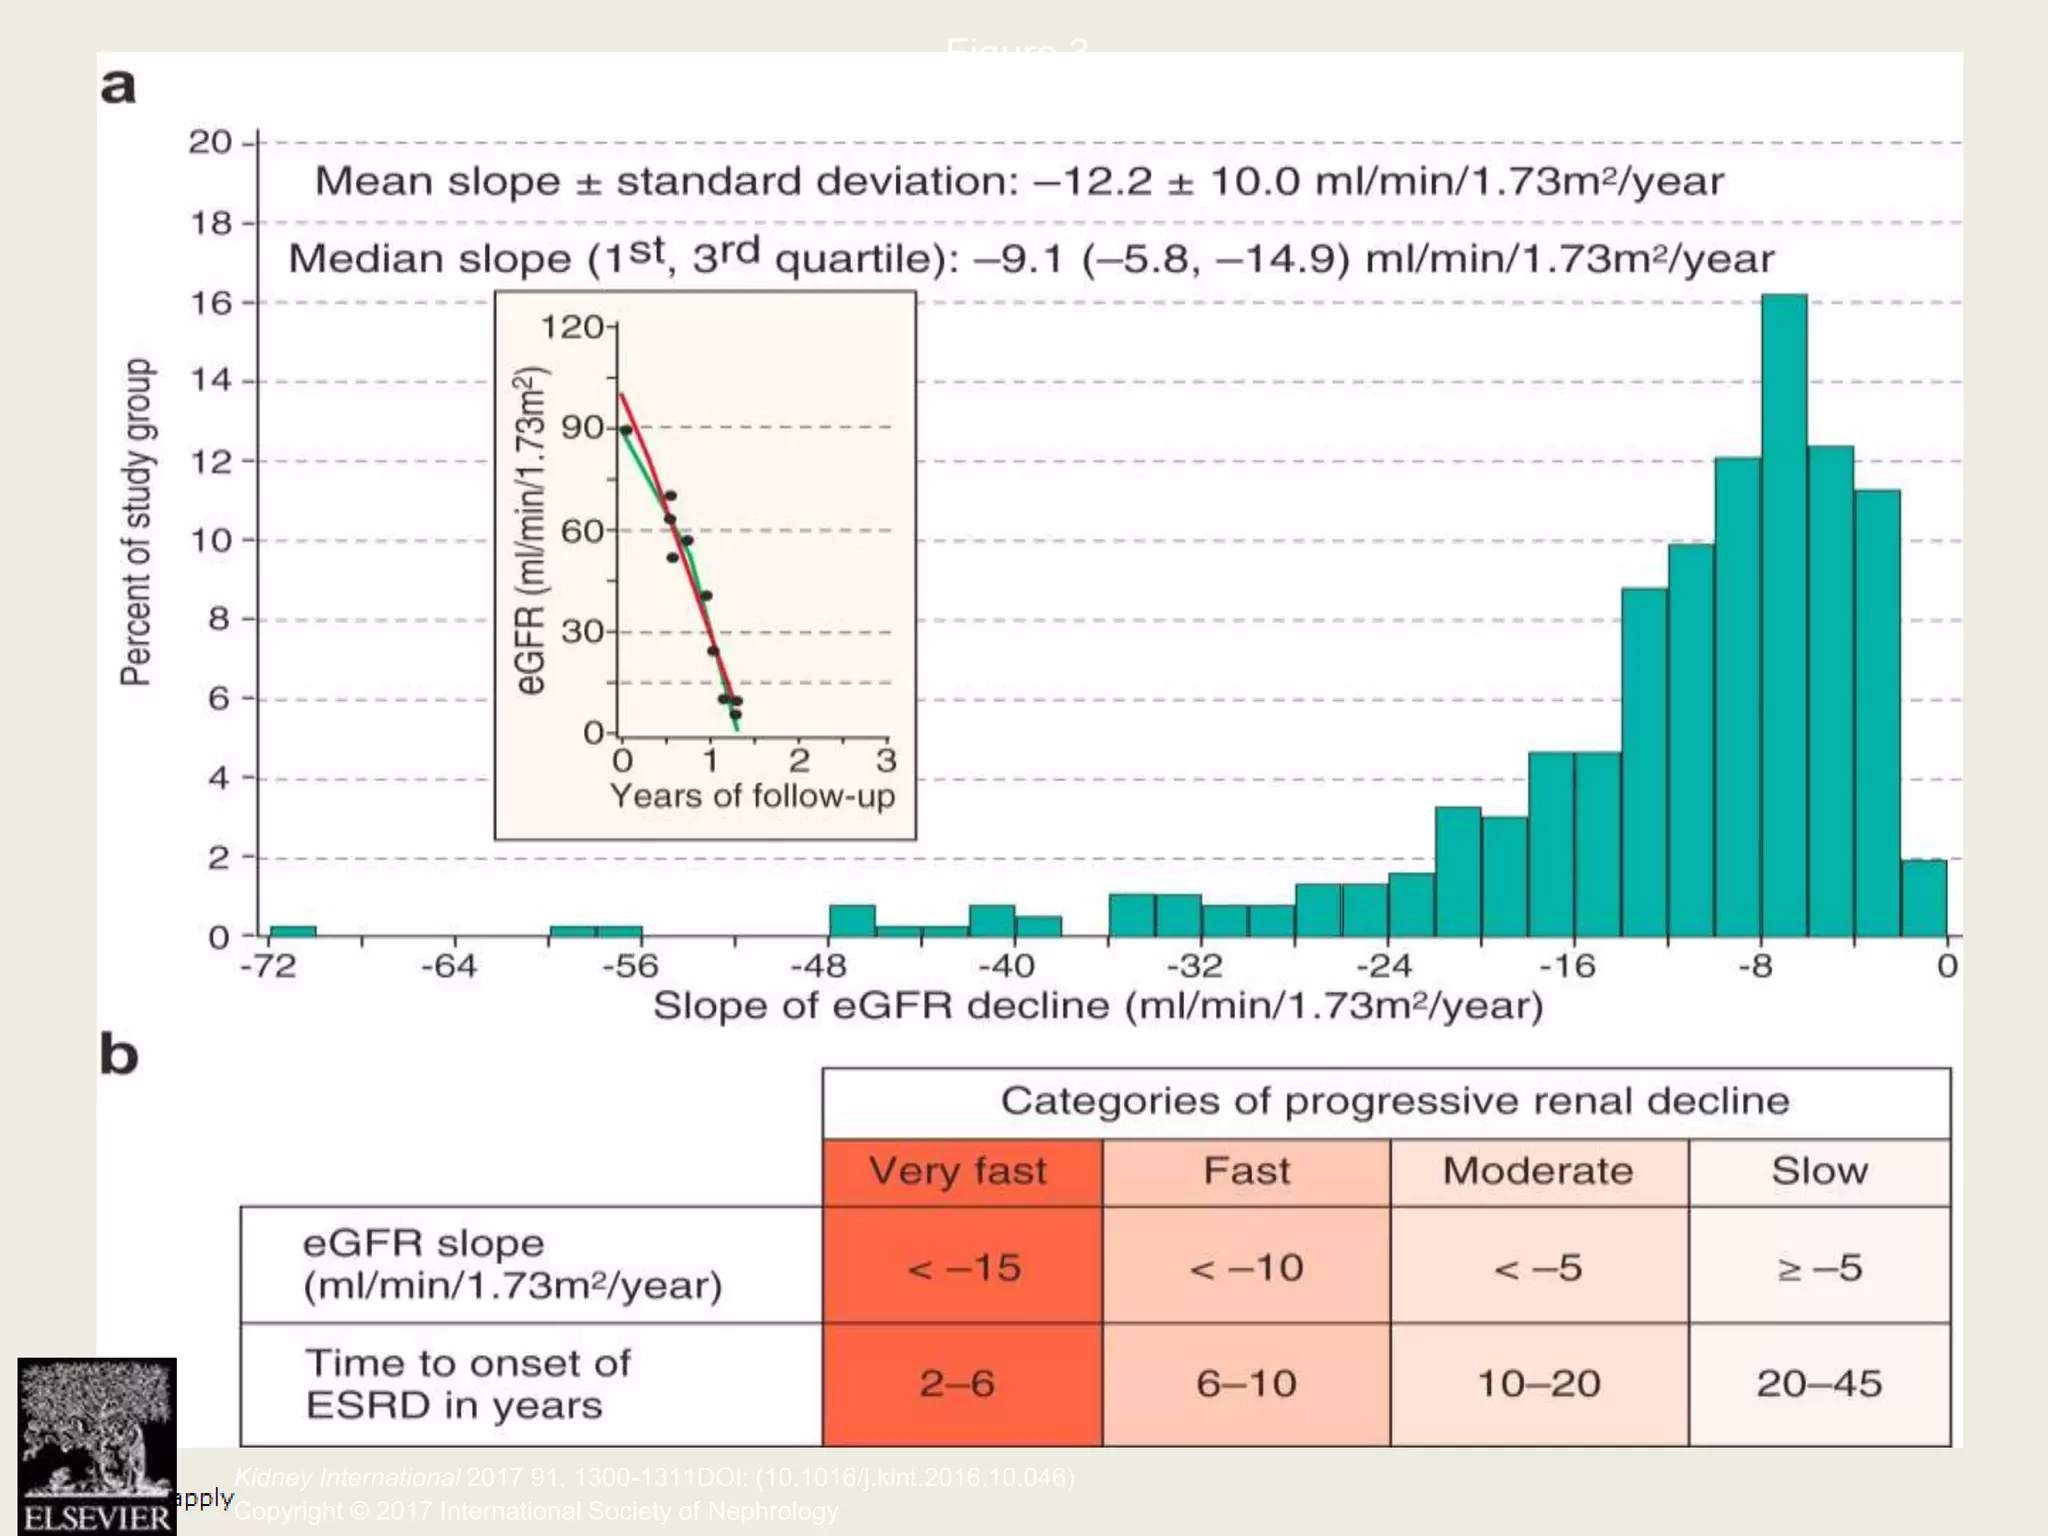
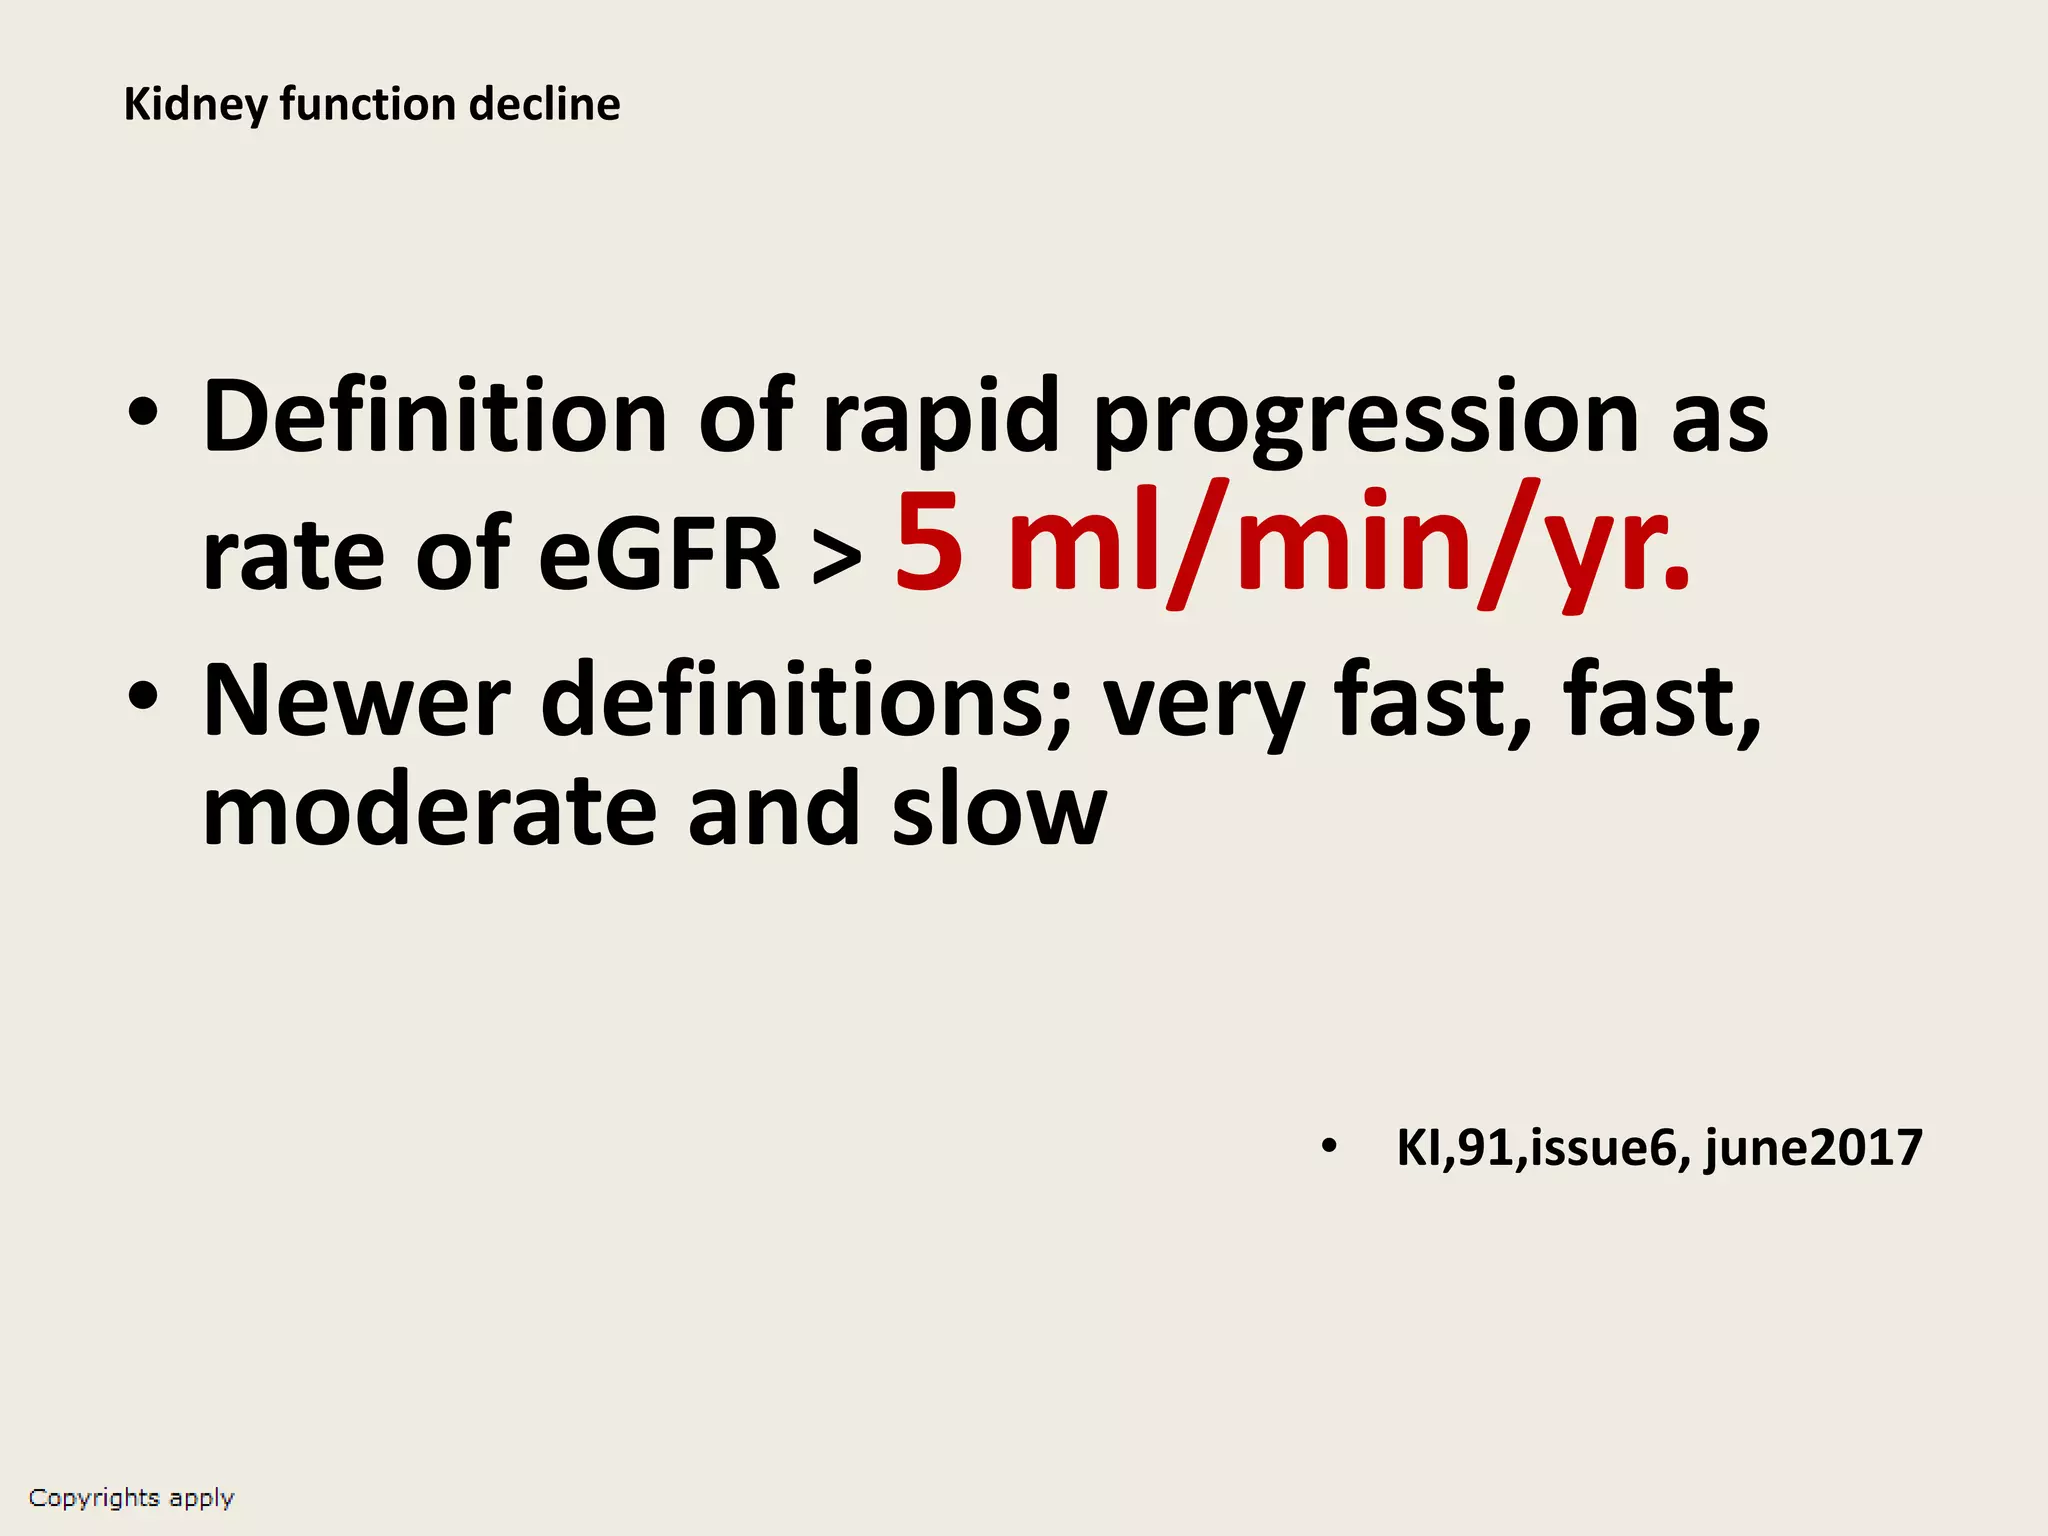
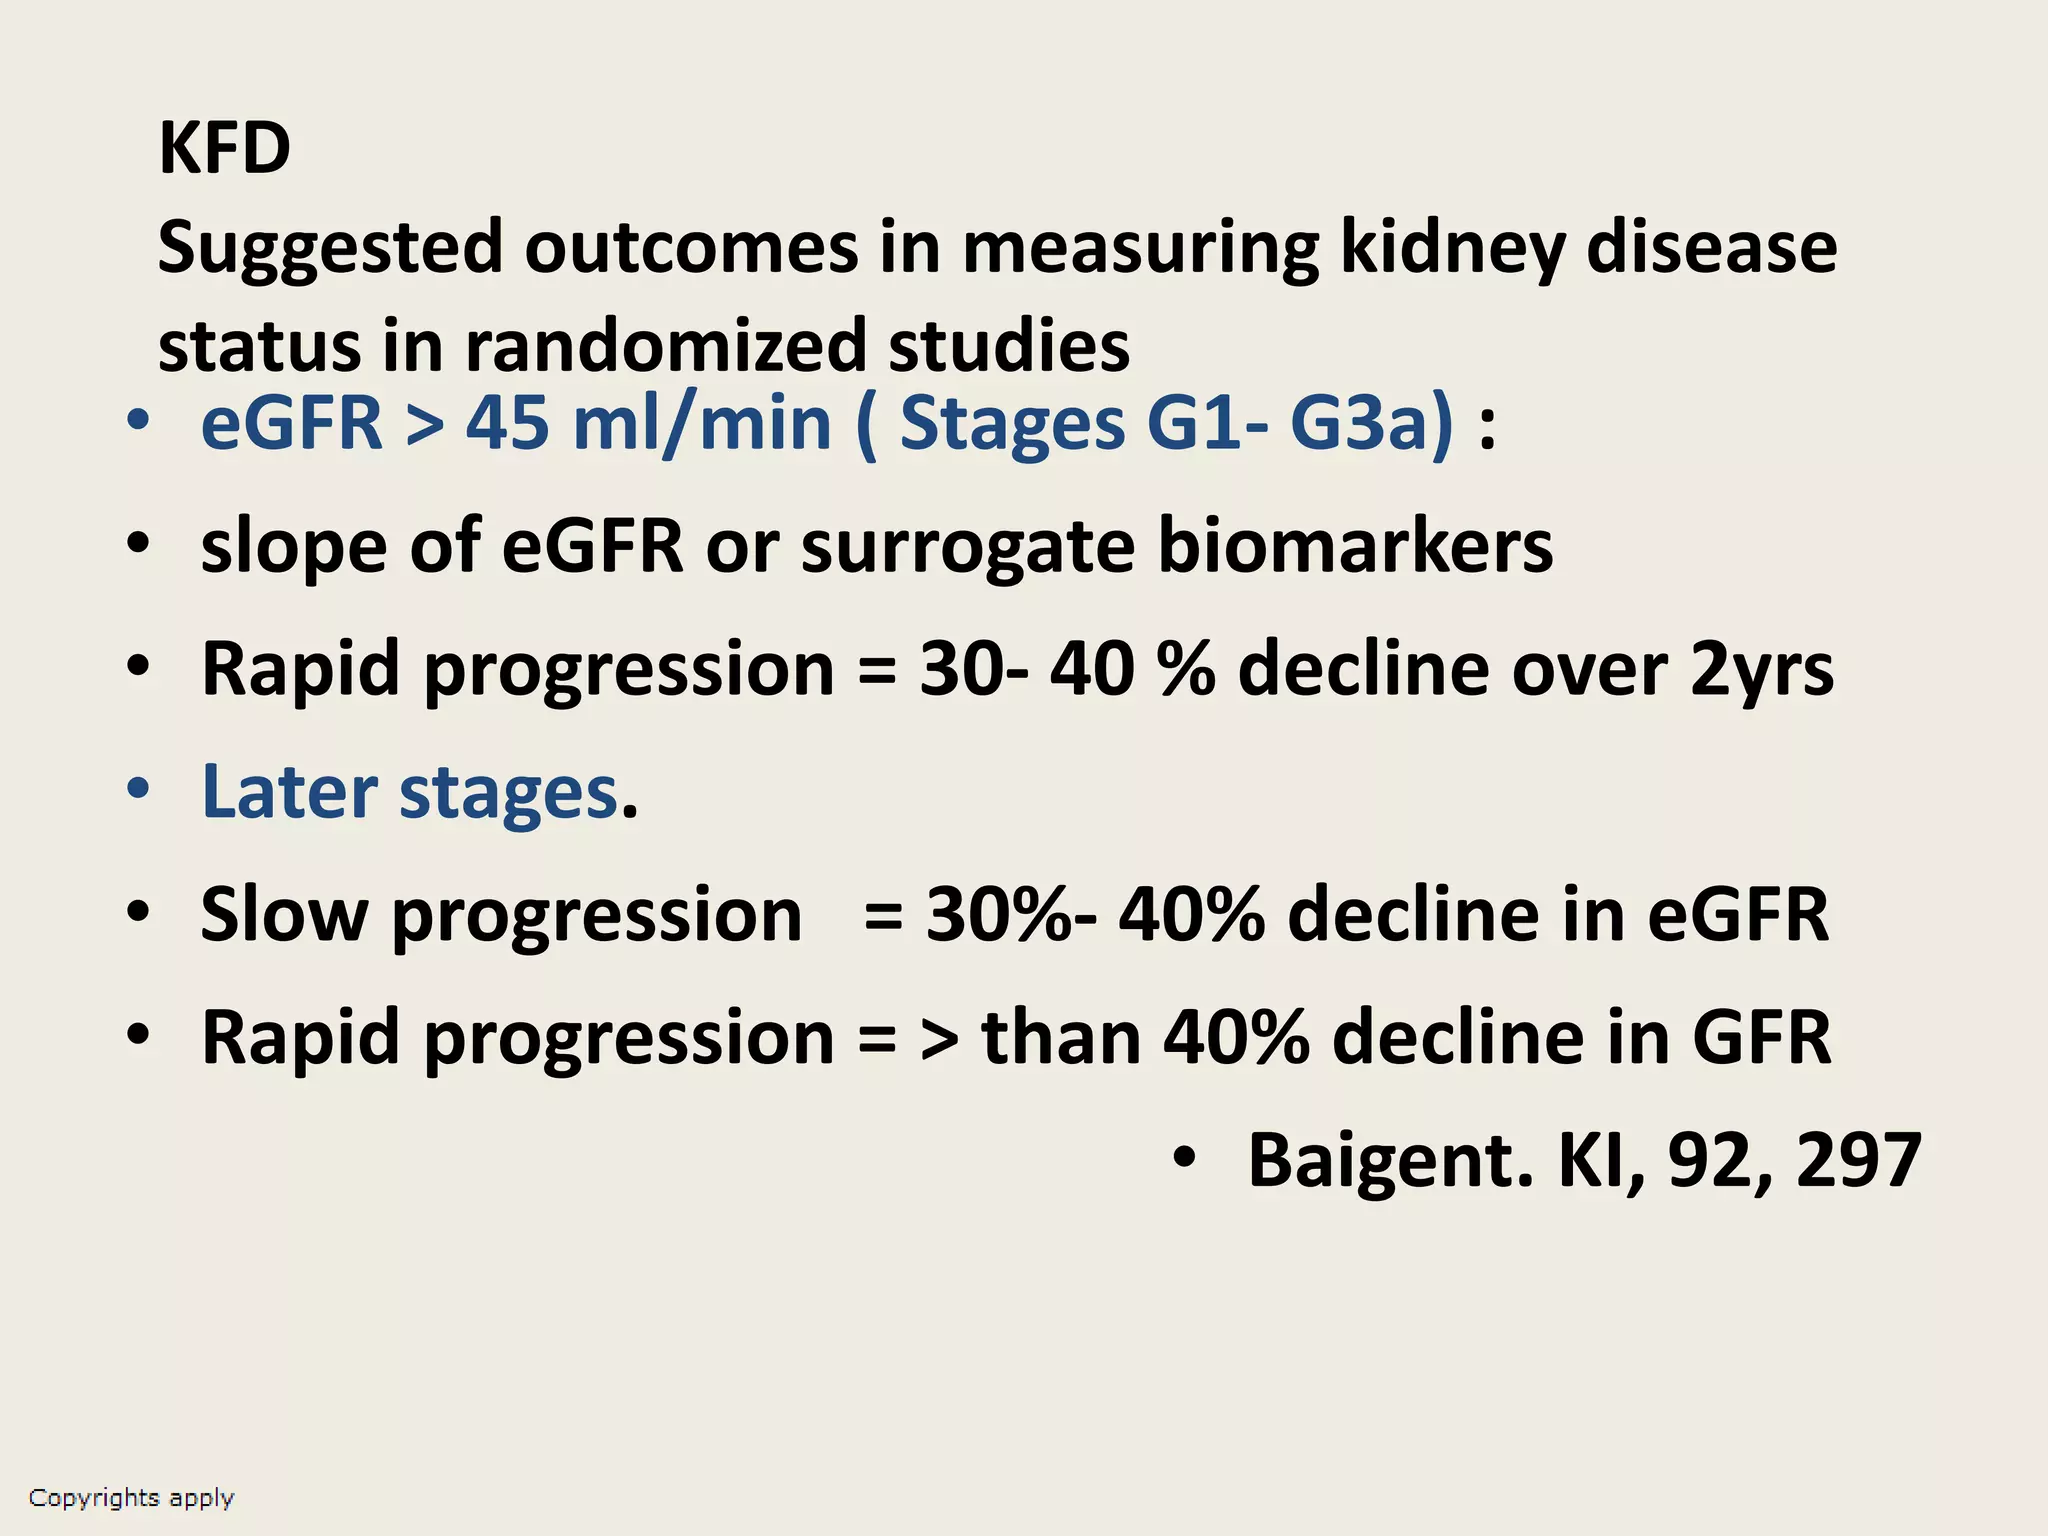
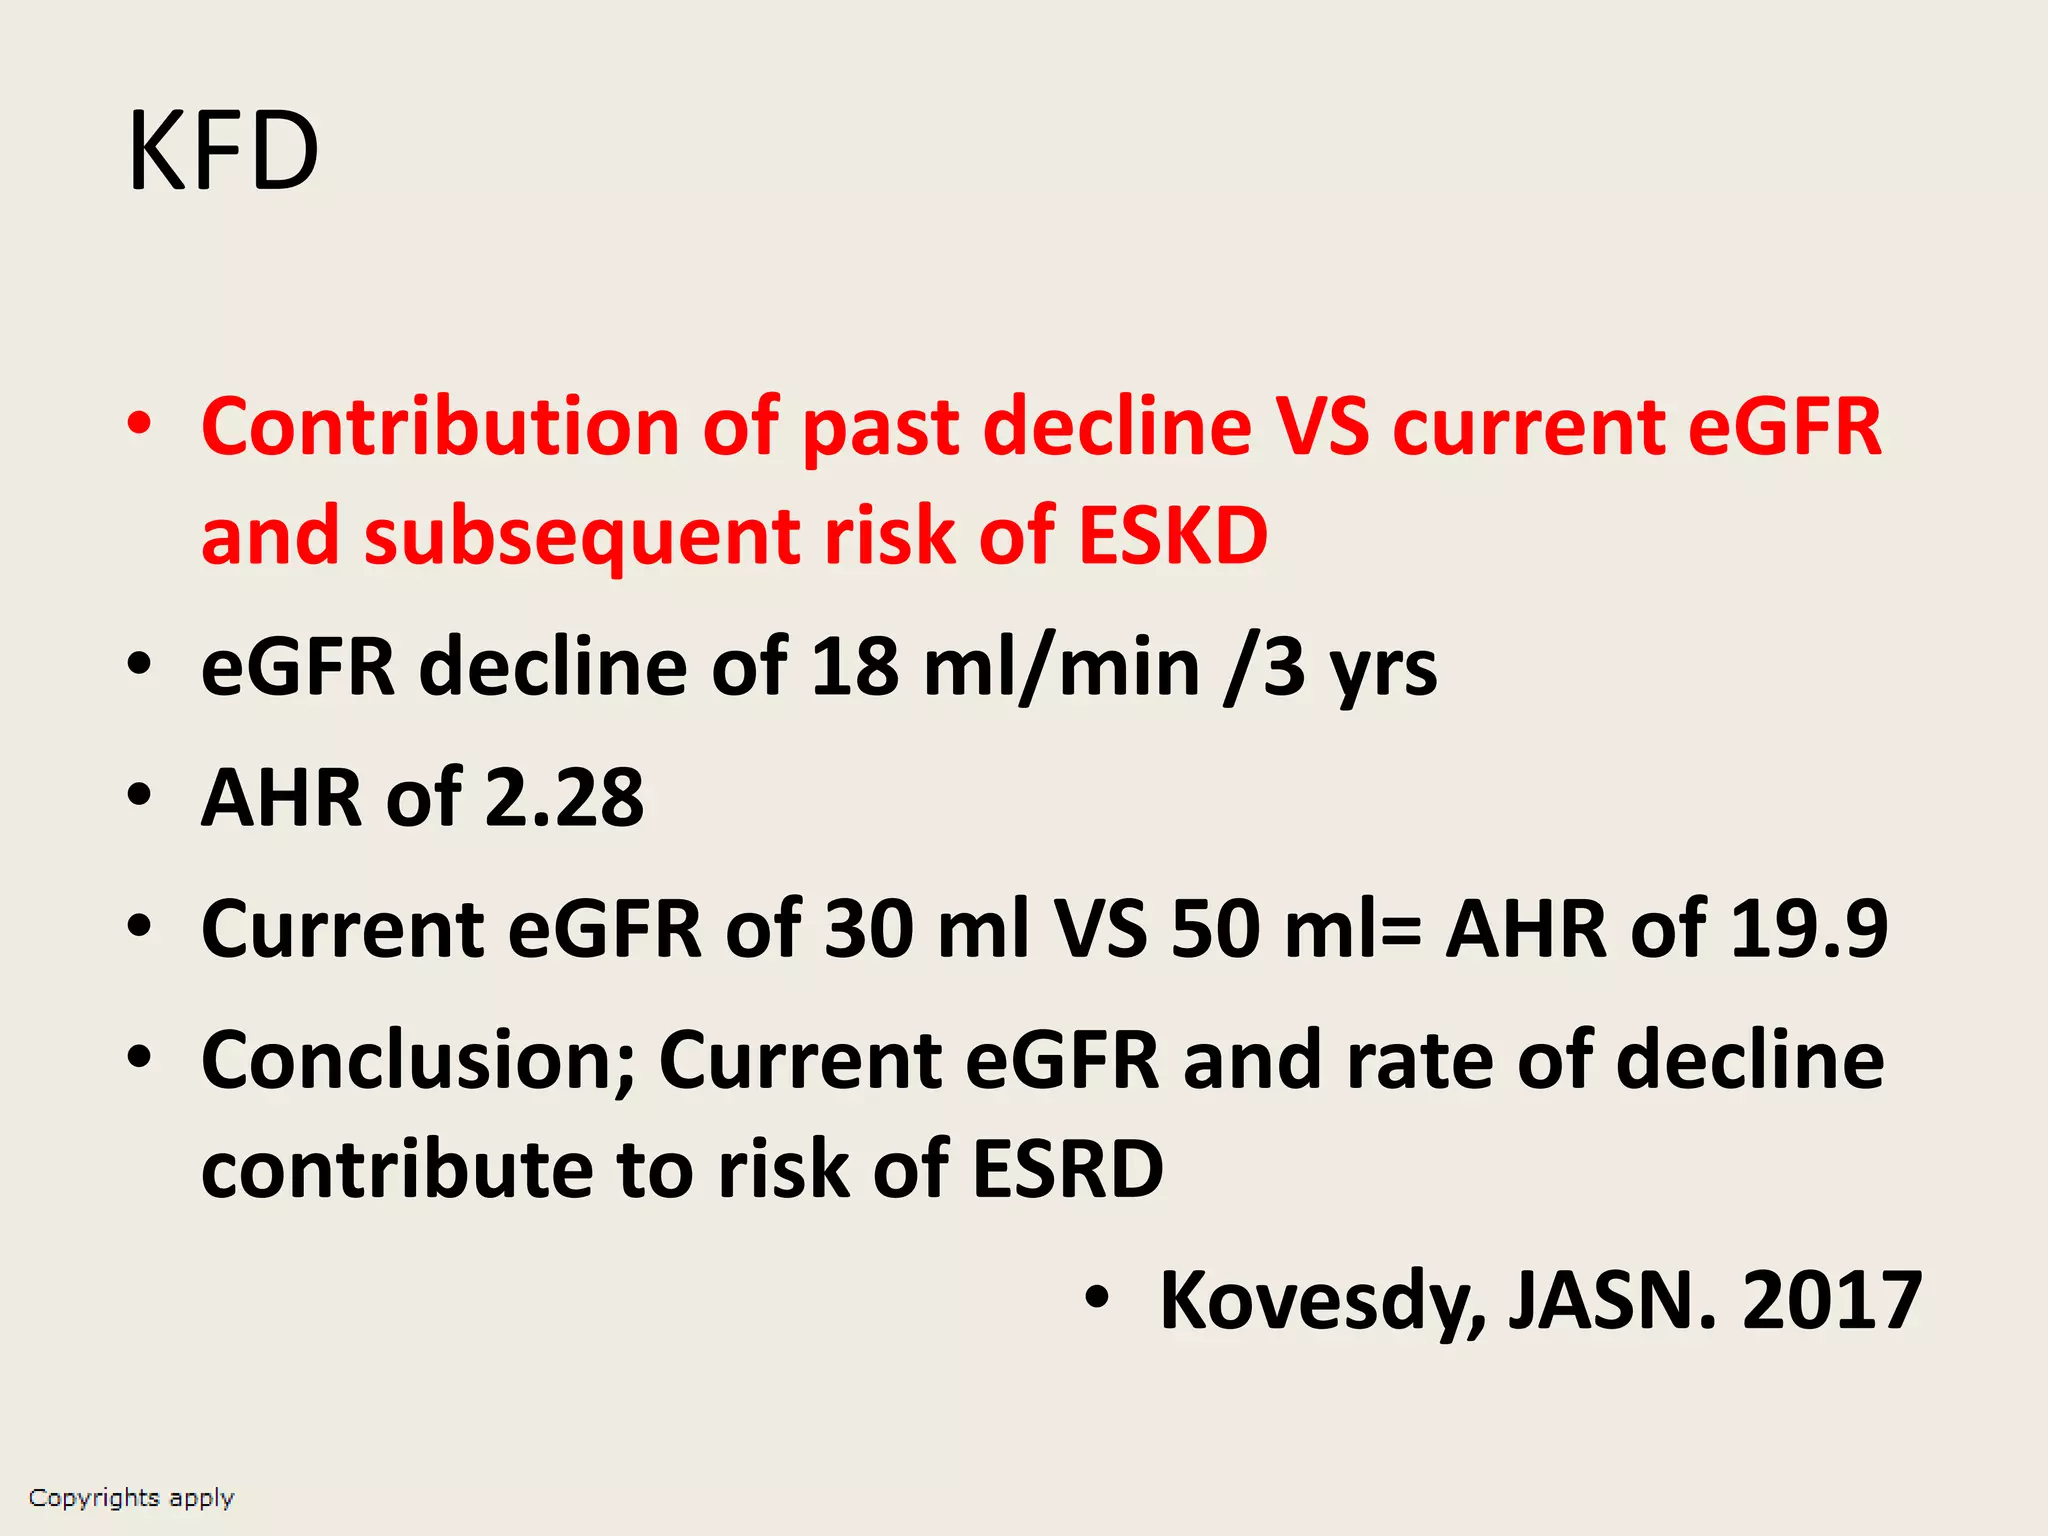
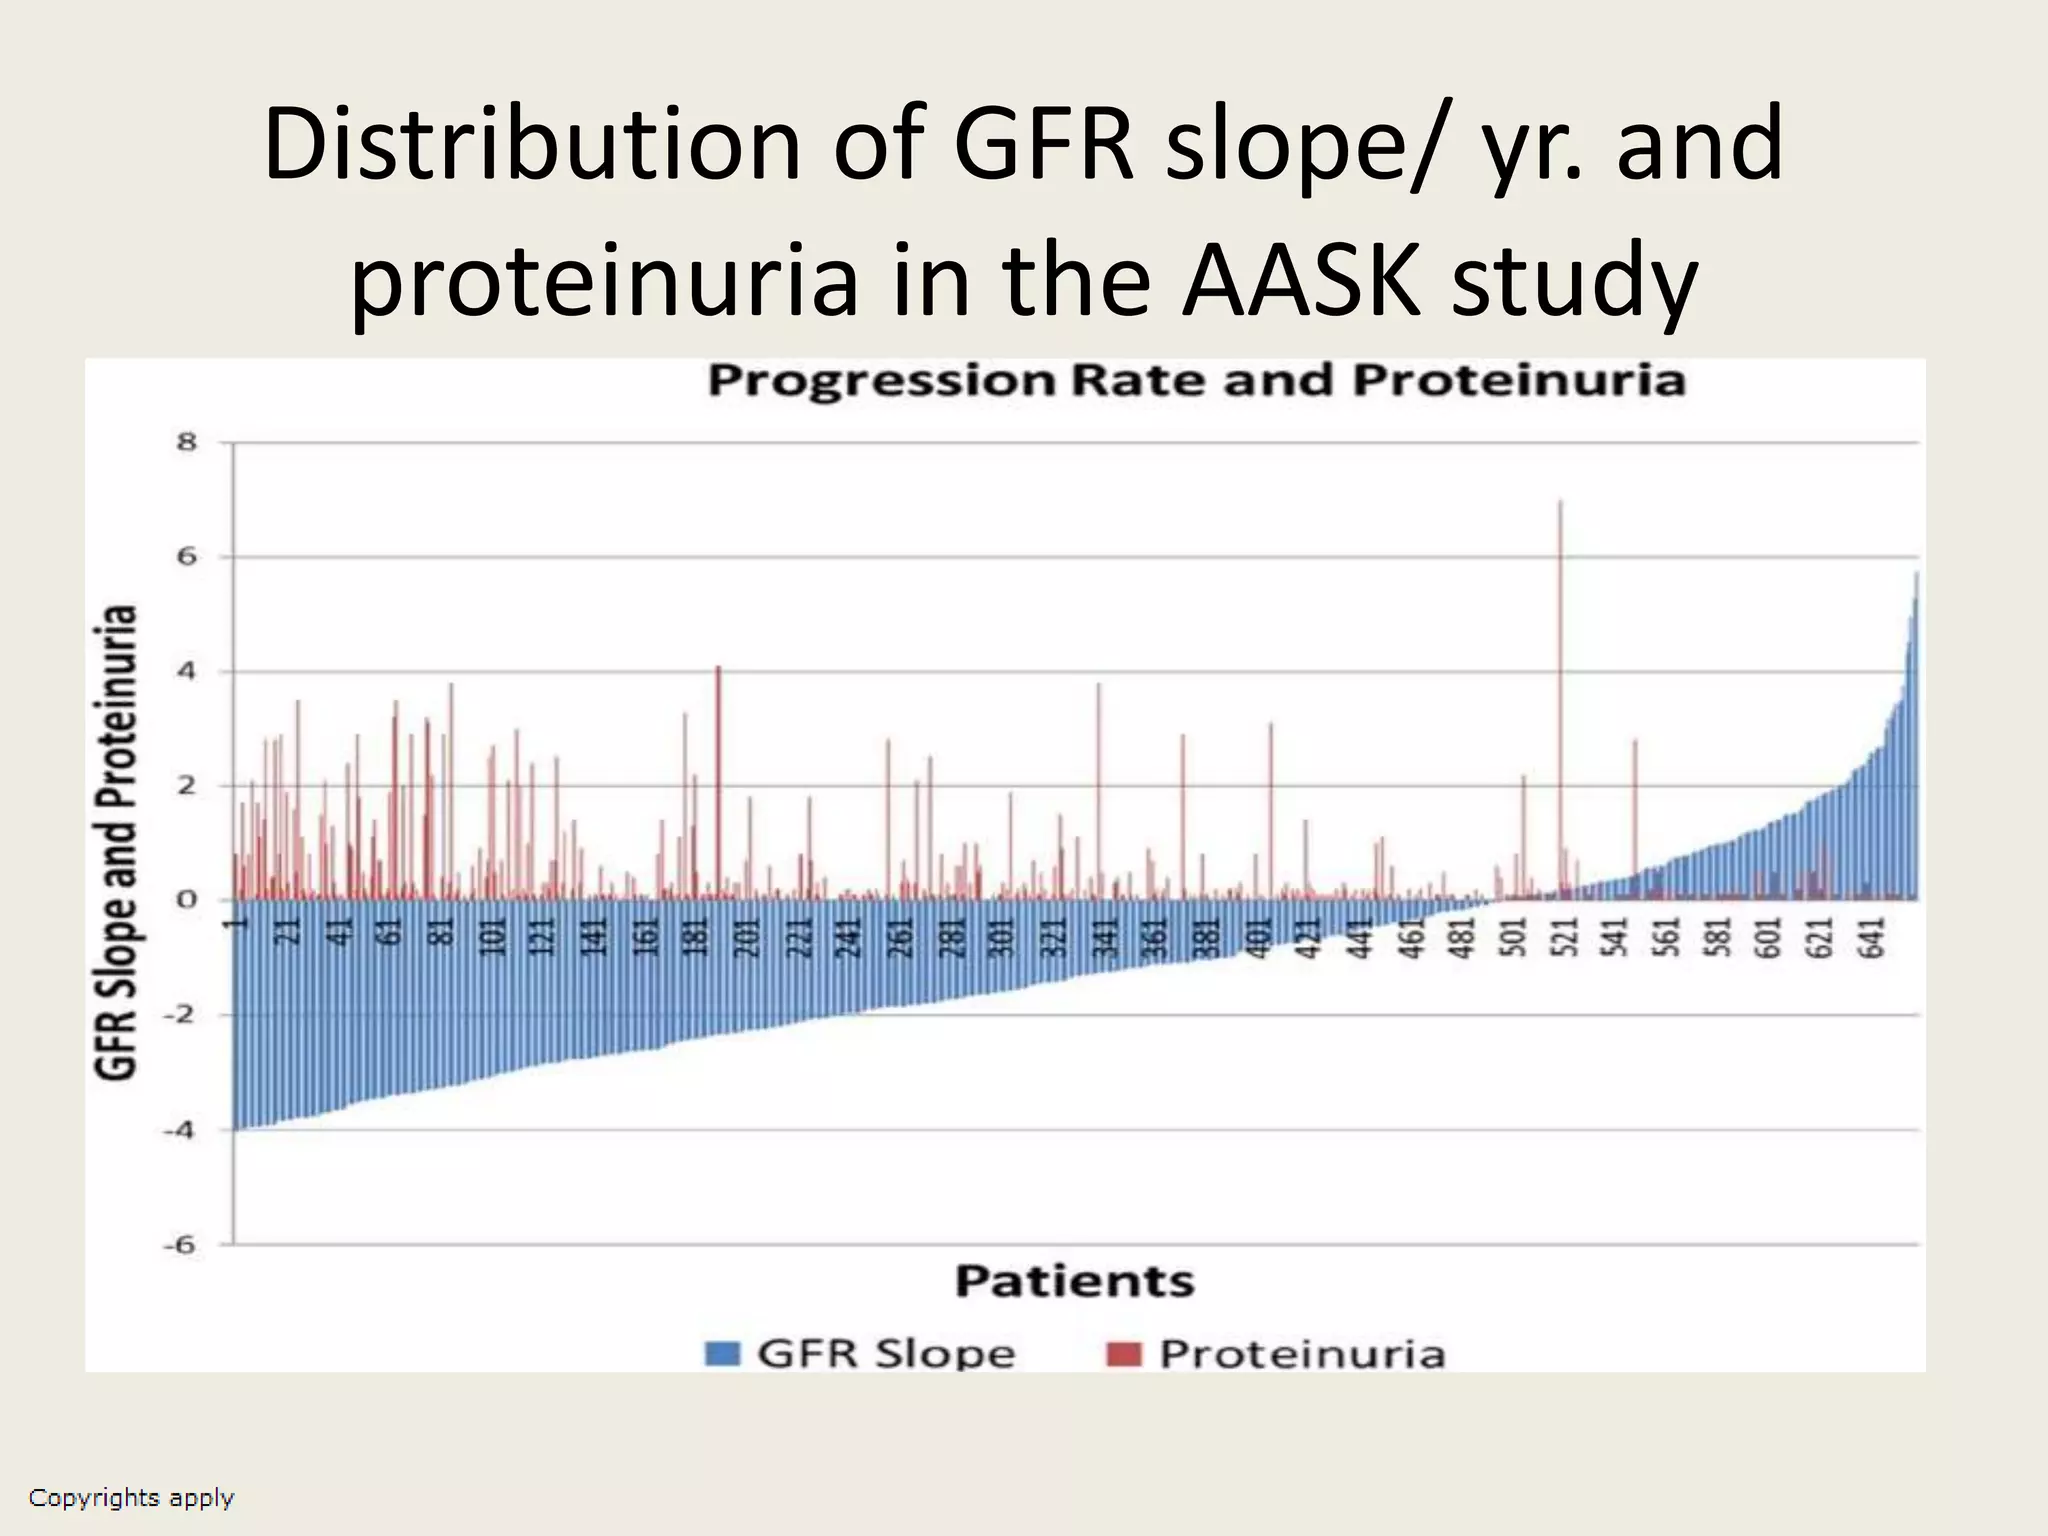
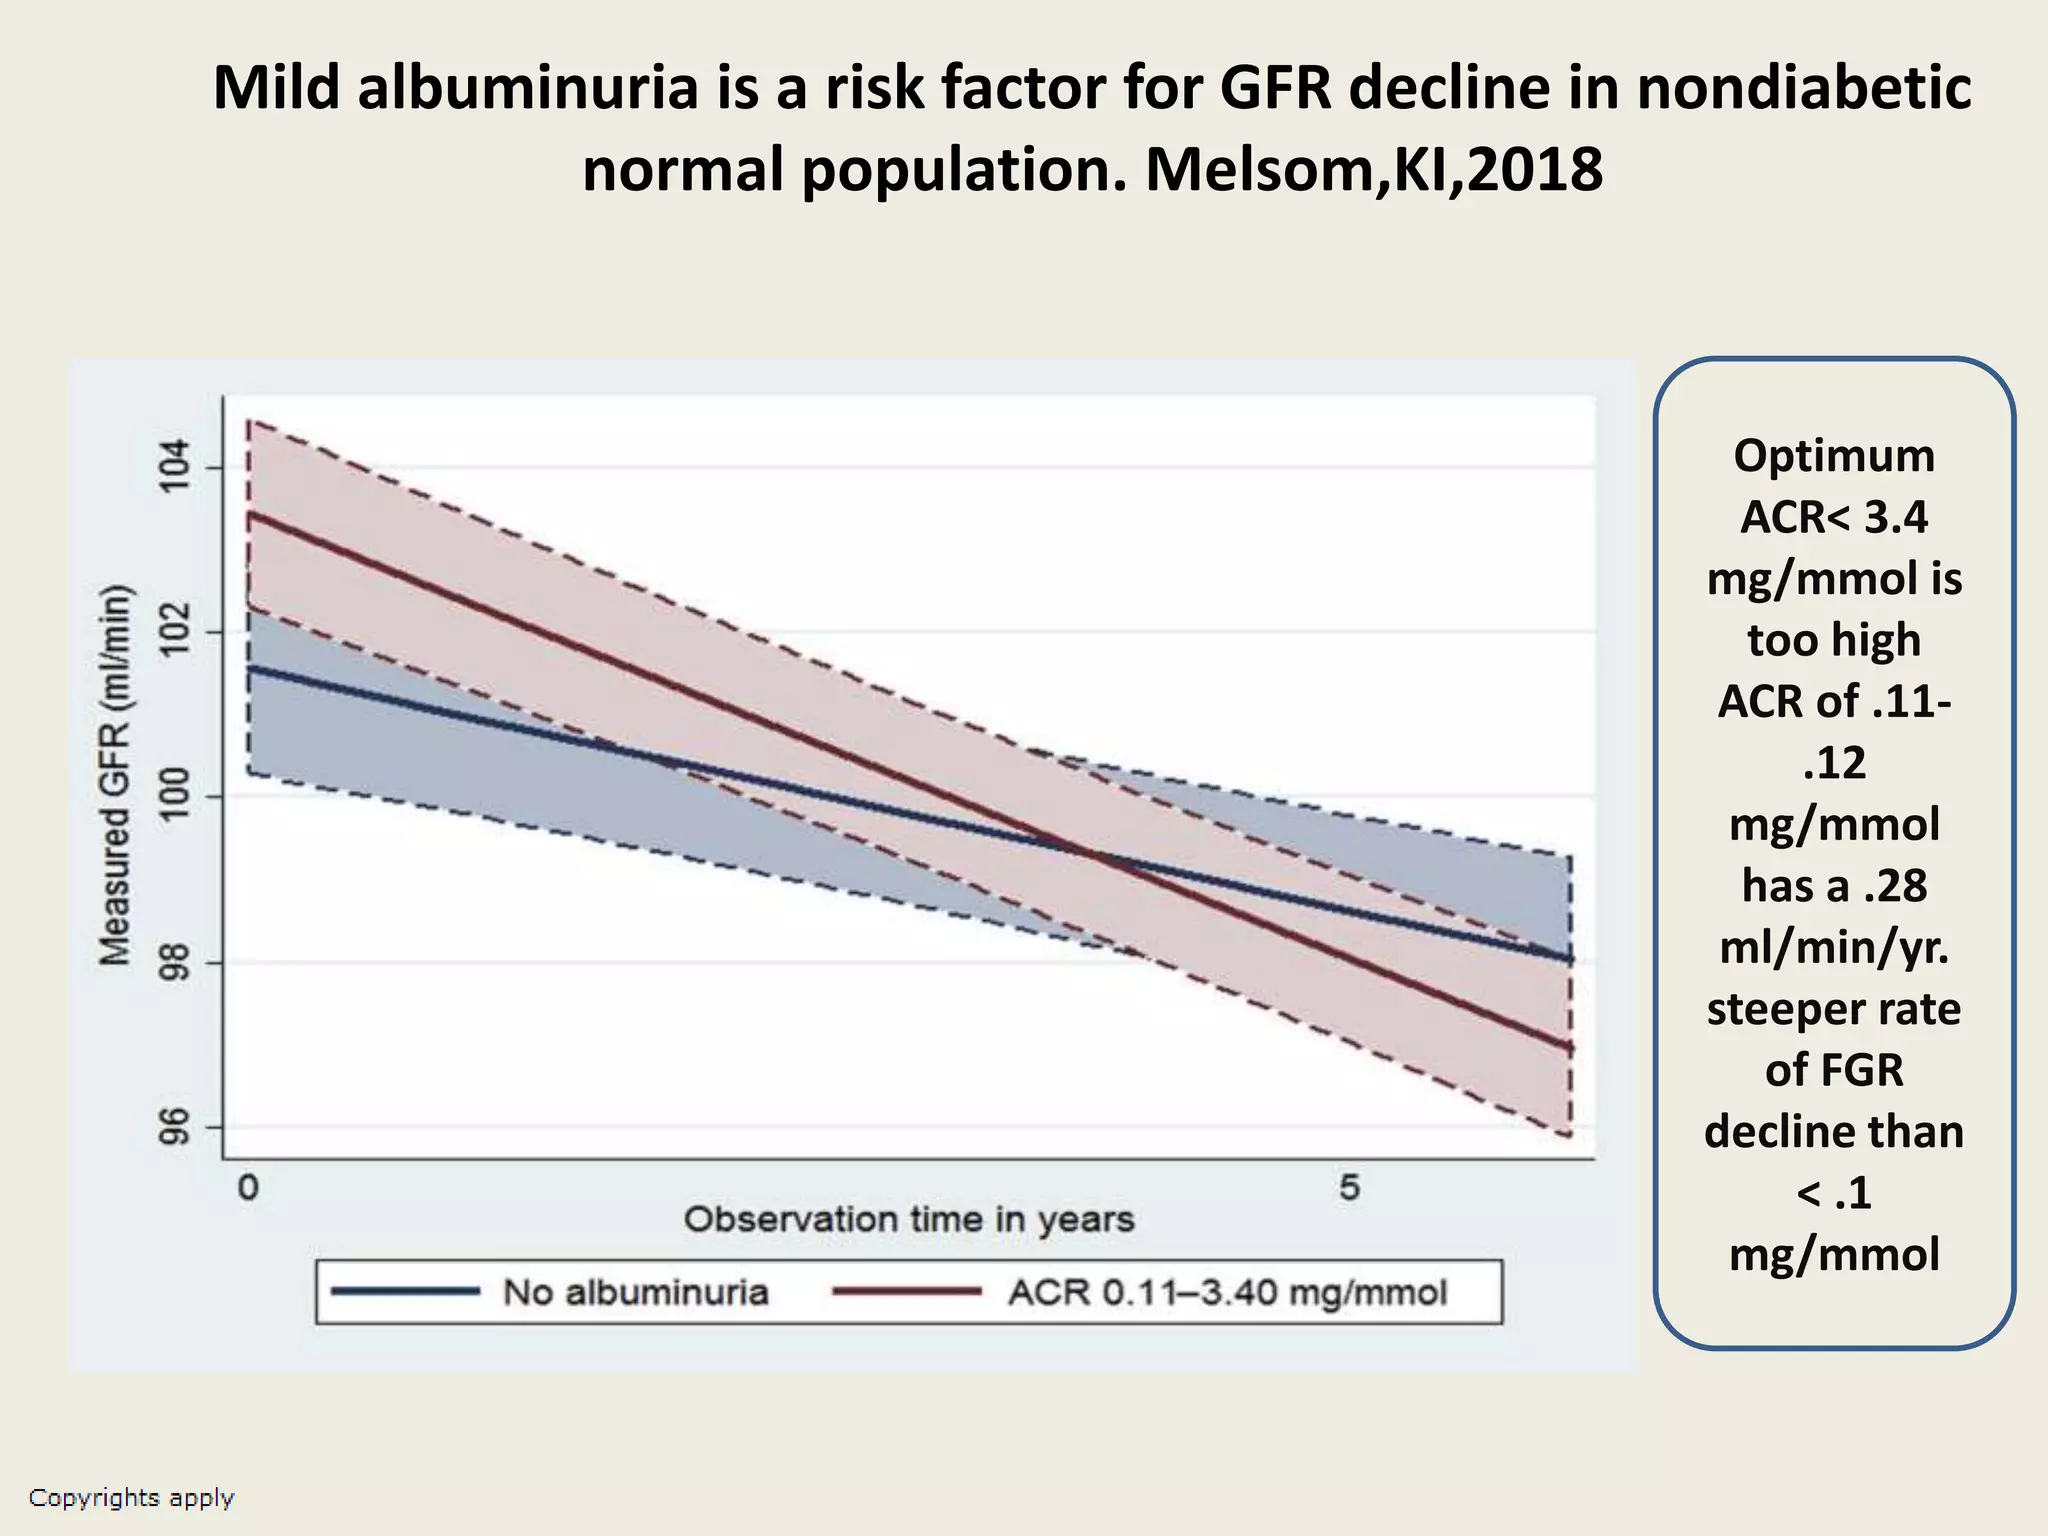
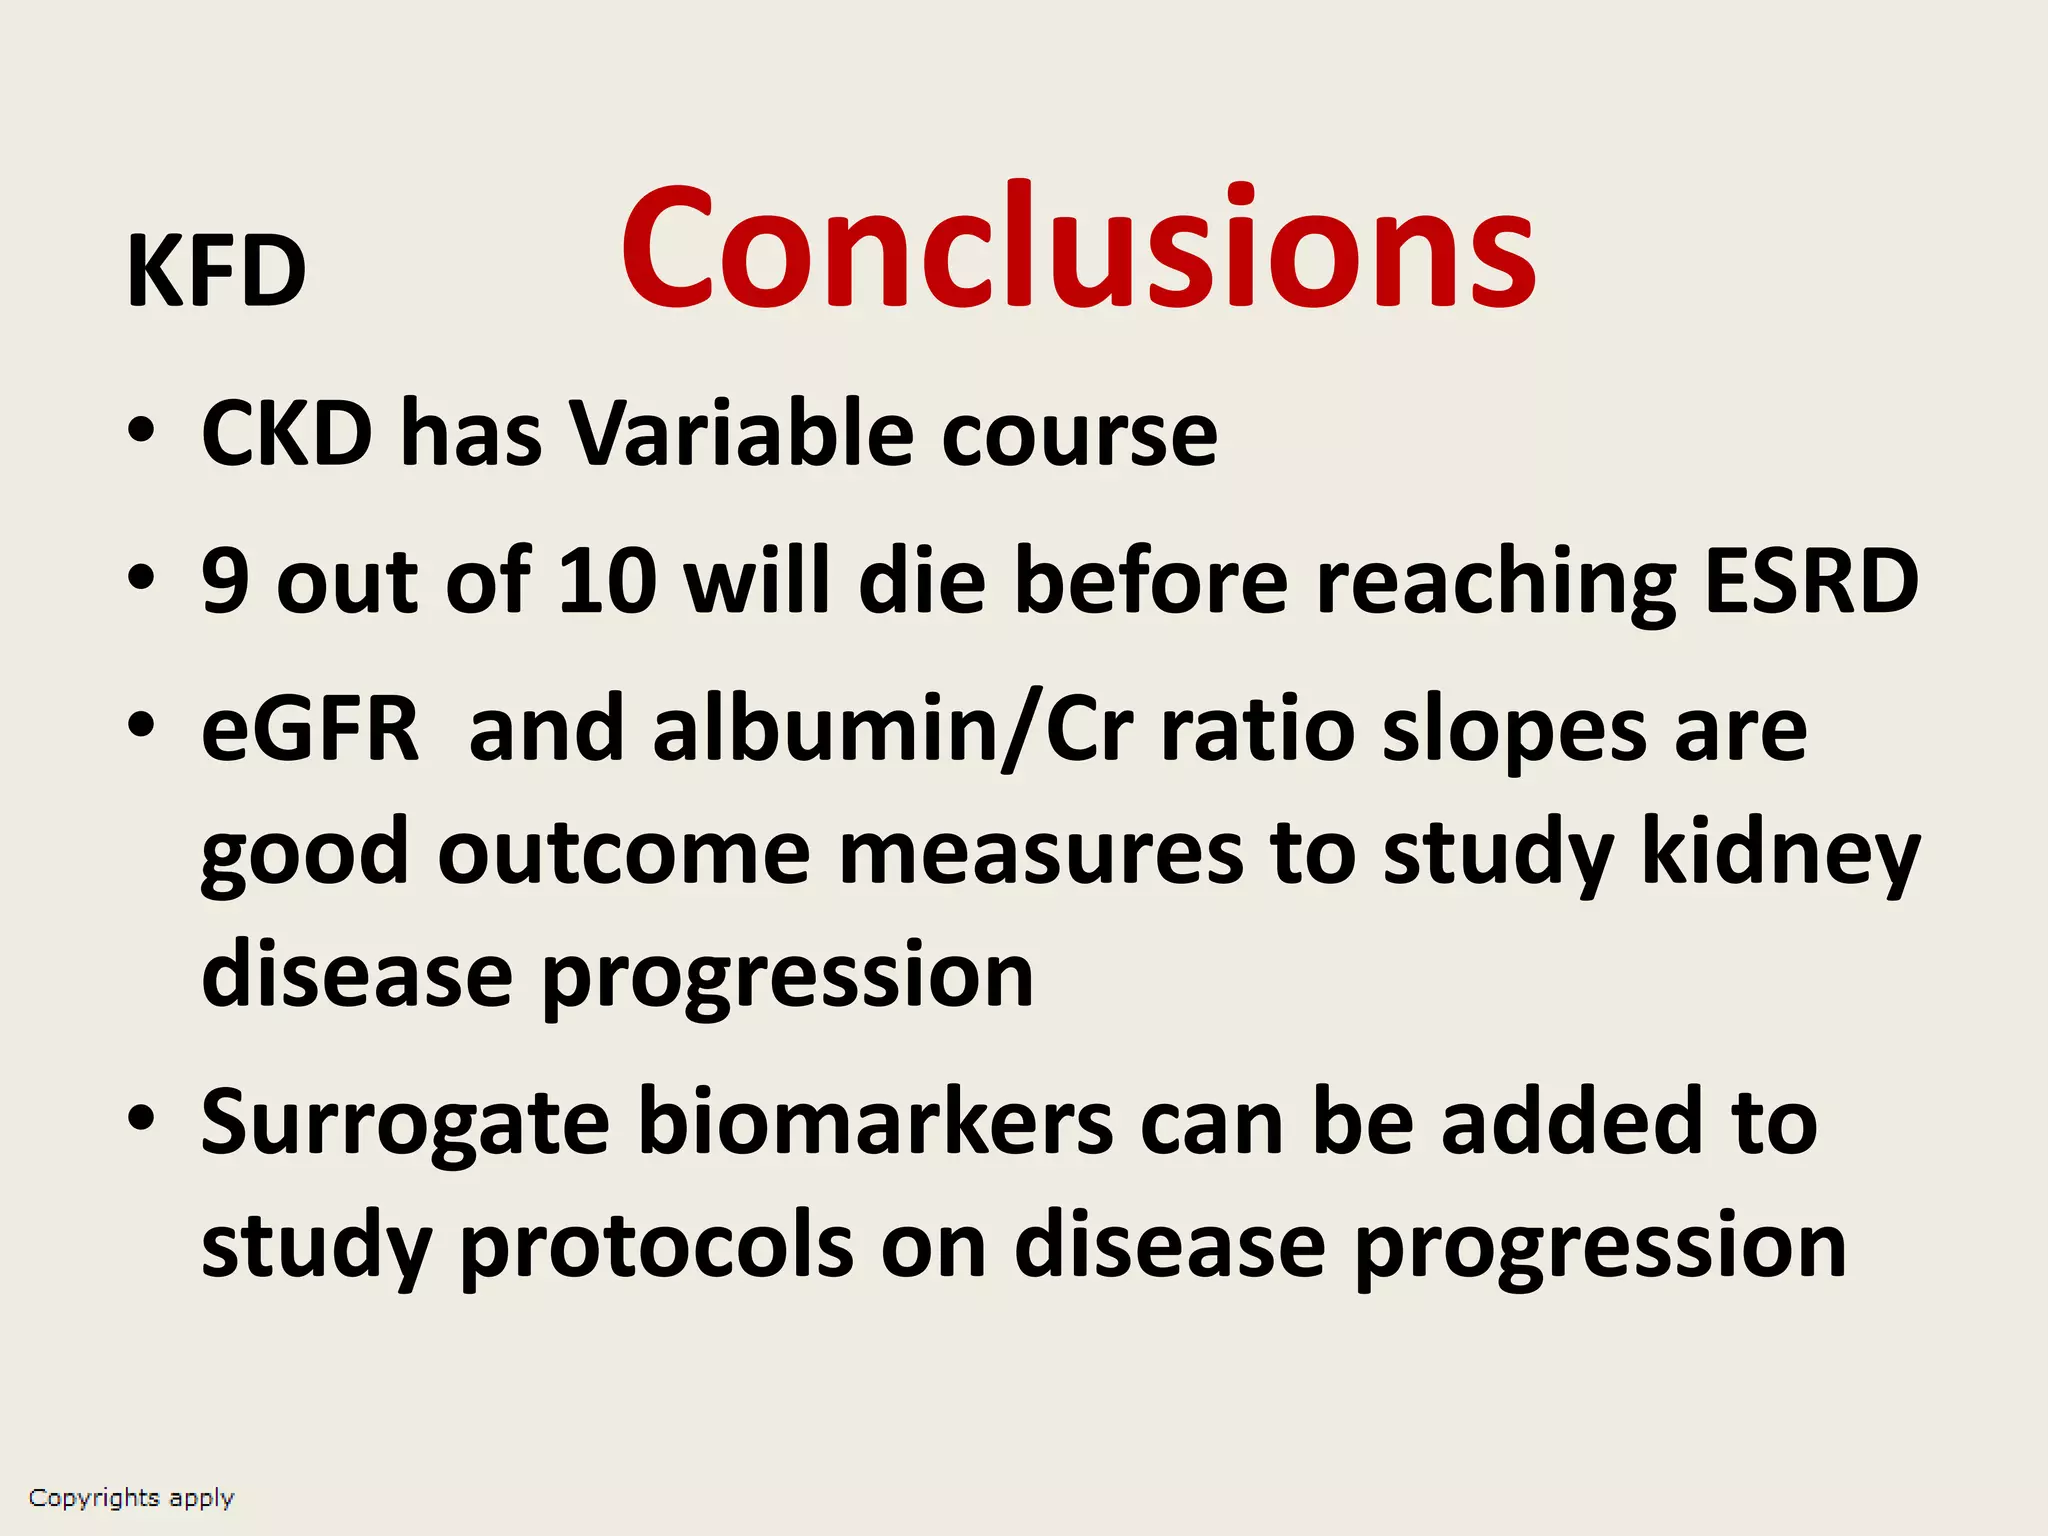
RATE of KIDNEY FUNCTION
DECLINE (KFD) and
SUBSEQUENT ESRD
Ahmed Shoker
KFD
•Aim:
• Highlight SIGNIFICANCE of rate of
kidney function decline (KFD) as a
potential Predictive outcome
measure to manage and study CKD
progression to ESRD, and perhaps
for the study of CKD in Egypt
• as highlighted in the 2016 ISN Global kidney health Summit
outputs published in KI , volume 7, issue 2, October 2017 and
thereafter
Kidney function decline
•Background:
• ISN Global kidney health Summit
outputs published in KI , volume
7, issue 2, October 2017
KFD
•Background
• Output of summit included
suggested plans to :
• 1) determine and monitor prevalence of
CKD
KFD
•Background
• Output of summit included suggested plans to :
• 2) Genetic and environmental risk factors for CKD
• Heavy metals
• Agriculture chemicals
• Occupational exposure
• Traditional herbals
• Sugary beverages
• Salty foods
• Infections
Kidney function decline
•Background
• Output of summit included suggested
plans to :
• 3) Closing the gap between evidence and practice in
CKD
• 4) Systemic kidney disease and complications
associated with decline in kidney function
• 5) Establish and validate novel therapeutic targets
to retard progression of CKD
• 6) optimize design of clinical trials in CKD
Kidney Function decline
•Background
• Output of summit included suggested
plans to :
• 7) Strategies to improve
monitoring disease progression,
assessing CVD risk, and defining
prognostic biomarkers in CKD
KFD
•Aim:
• Highlight SIGNIFICANCE of rate of
kidney function decline (KFD) as a
potential predictive outcome
measure to study CKD
progression to ESRD, and perhaps
for the study of CKD in Egypt.
KFD
• GFR
TIME
Threshold for intervention
Rate of decline in kidney function=
delta change in GFR per time unit
KFD
•Aim:• highlight SIGNIFICANCE of rate of kidney function decline (KFD) as a potential predictive
outcome measure to study CKD progression to ESKD, and perhaps for the study of CKD in
Egypt.
•Q # 1
•Why is the focus on
Study of CKD?
KFD
•Quiz
• In population studies of kidney disease, what is
the percentage of CKD patients who will make it
to ESRD
• 1-2 %
• 10- 20 %
• 40- 60%
• 70- 80 %
• 90%
KFD
• Incidence/Prevalence of ESRD,
• 150/1800 per million= .0001%
• Incidence/ Prevalence of CKD= 3- 11%
• Ratio (Incidence/Prevalence) of ESRD/CKD=
• 1/500
• 1/1000
• eGFR< 60 ml/min is attributed to 4% of
deaths worldwide
• Thomas B, JASN, 2017
Risk of nephrectomy
• Study natural history of CKD in 27,998 with
eGFR below 90 ml/m
• 5 yrs follow up
• ESRD= 1.1% (stage 2) ****Mortality= 19.5%
• ESRD= 1.3% (stage 3) ****mortality= 24.3%
• ESRD= 19.9% (stage 4)****Mortality= 45.7%
• Conclusion” Only 2% will progress to ESRD”
• Keith D,et al
• Arch Intern Med 2004;164: 659
KFD
• Why is the focus on CKD?
• 1) 9 out of 10 will die before ESRD
• 2) Manage CKD differs by stage
• 3) High prevalence of CKD and it’s association
with modifiable causes and increased CVD
and mortality rates, long before dialysis
• 4) Early intervention and avoidance of
nephrotoxic exposure can be done
KFD
• Why is the focus on CKD?, because; Early intervention
before it’s to late
•Q #2
• Can we predict patients who progresses
to ESRD/ high risk mortality?
•Q # 3
• Can we develop Predictor outcome
measures ( ESRD, etc) for clinical studies
and patient management with CKD?
Kidney function decline
•The story of
potential outcome
measures in CKD
KFD
• Outcome measures in nephrology clinical studies
• Differs between CKD/ HD/ PD/TX
• Different priorities of Pts, clinicians, researchers,
caregivers
• Outcome: is something that can be measured, and
can arise or change because of a health condition or
treatment
• Core outcome set: is an agreed standardized set of
outcomes that should be measured and reported,
as a minimum, in all clinical trials in specific areas of
health or health care. Researchers may add other
outcomes to the core outcome set
• Nistor, NDT, 2017
KFD
• Standardized Outcomes In Nephrology (SONG)
• Initiative to establish set of outcome measures
• SONG- Tx
• SONG- Kids
• SONG-PD
• SONG-CKD
• SONG- PCKD
• SONG handbook,2017
• Transplant, 2017
• Tong, A. NDT, 2017
Kidney function decline
•The story of rate of kidney
function decline (KFD) as a
potential predictive
outcome measure for
subsequent ESRD
Kidney Function Decline
• Mean rates ( ml/min/yr) of eGFR decline ( is variable, but
constantin individual pts)
• DM .0 - 12.6
• IGA 1.4 - 9.5
• MN 4.6 - 9.5
• Chronic GN 2 - 10.4
• TID 2 - 5.4
• PCKD 3.8- 5.4
•Q # 4
• Can we grade rates of kidney function
declines into slow/ fast? to use as
outcome measure in the study CKD?
KFD
• Meta-analysis of 1.7 million pts
• Adjusted HR for ESRD, mortality were
higher for larger decline in eGFR over 1-
3 yrs
• JAMA, 2014,, Coresh et al
KFD
• AHR of ESRD for Pts with eGFR
decline over 2 yrs of
• > 57% = ESRD of 32.1
• > 30% = ESRD of 6.9
• < 30% = ESRD of 5.4
• AHR for patient mortality adjusted
for 10 yrs were similar
KFD
• 1) Decline in EGFR smaller than doubling SCr
occurs more commonly
• And strongly associate with risk for ESRD
• 30% reduction in eGFR over 2 years is
alternative end point for CKD progression in
10 yrs.
• JAMA, 2014,, Coresh et al
• Inker, Am j Kid Dis, 2014
• Badve,NDT,2015
• PLoS One, Tsai,2017
KFD
•Definition of rapid
progression as rate of
eGFR > 5 ml/min/yr.
• KI,91,issue6, june2017
KFD
• FDA accepts 30%- 40% decline in eGFR over
2- 3yrs in eGFR as an end point in clinical
studies
• Acceptable, shorter duration, smaller
population and simple and cheap target
• Coresh, JAMA, 2014
Coresh, JASN 2016: 27;2447
• Badve, NDT,,2016
• Carlesson CJASN, 2017. vol12
•
KFD
•The story of rate of kidney
function decline (KFD) as a potential
predictive outcome measure for
subsequent ESRD Continues
Patterns of progression of chronic
kidney disease at later stages
Fernando Caravaca-Fontán Lilia Azevedo Enrique
Luna Francisco Caravaca
Clinical Kidney Journal,
sfx083, https://doi.org/10.1093/ckj/sfx083
Published:
28 July 2017
Conclusions: A majority of patients with advanced CKD show patterns of renal function
decline different from linear, and several of the main determinants of CKD progression
are potentially modifiable.
From: Patterns of progression of chronic kidney disease at later stages
Clin Kidney J. Published online July 28, 2017. doi:10.1093/ckj/sfx083
Clin Kidney J | © The Author 2017.
From: Patterns of progression of chronic kidney disease at later stages
Clin Kidney J. Published online July 28, 2017. doi:10.1093/ckj/sfx083
Clin Kidney J | © The Author 2017.
Fast renal decline to end-stage renal
disease: an unrecognized feature of
nephropathy in diabetes.
Krolewski AS1, Skupien J2, Rossing P3, Warram JH4.
Kidney Int. 2017 Jun;91(6):1300-1311. doi:
10.1016/j.kint.2016.10.046. Epub 2017 Mar 31.
Distribution of categories of progressive renal decline during 6–10 years of
follow-up in patients with type 1 diabetes and type 2 diabetes in the Joslin
Kidney Studies according to category of albuminuria at entry into follow-up
Distribution of categories of progressive renal decline during 6–10 years of
follow-up in patients with type 1 diabetes and type 2 diabetes in the Joslin
Kidney Studies according to category of albuminuria at entry into follow-up
Figure 3
Kidney International 2017 91, 1300-1311DOI: (10.1016/j.kint.2016.10.046)
Copyright © 2017 International Society of Nephrology
Kidney function decline
• Definition of rapid progression as
rate of eGFR > 5 ml/min/yr.
• Newer definitions; very fast, fast,
moderate and slow
• KI,91,issue6, june2017
KFD
Suggested outcomes in measuring kidney disease
status in randomized studies
• eGFR > 45 ml/min ( Stages G1- G3a) :
• slope of eGFR or surrogate biomarkers
• Rapid progression = 30- 40 % decline over 2yrs
• Later stages.
• Slow progression = 30%- 40% decline in eGFR
• Rapid progression = > than 40% decline in GFR
• Baigent. KI, 92, 297
KFD
• Limitations of rate of KFD as an outcome
measure
• 1) Is the rate of decline in eGFR linear?
• 22-18% Non linear in PCKD
• 20% in DM
• 30% in GN
•Q # 5
• Can we improve on rate of KFD as
outcome measure?
KFD
• Limitations of rate of KFD as an outcome
• 1) Is the rate of decline in eGFR linear?
• 22-18% Non linear in PCKD
• 20% in DM
• 30% in GN
•Q # 6
• Can we further, improve on rate
of KFD as measure of progressive
CKD?
KFD
• Contribution of past decline VS current eGFR
and subsequent risk of ESKD
• eGFR decline of 18 ml/min /3 yrs
• AHR of 2.28
• Current eGFR of 30 ml VS 50 ml= AHR of 19.9
• Conclusion; Current eGFR and rate of decline
contribute to risk of ESRD
• Kovesdy, JASN. 2017
KFD
•Q # 7
• To what extend proteinuria predicts
progressive decline in eGFR???
• Remains controversial
• Proteinuria course may not be linear
• Need for improved outcome measures using
biomarkers
Distribution of GFR slope/ yr. and
proteinuria in the AASK study
Mild albuminuria is a risk factor for GFR decline in nondiabetic
normal population. Melsom,KI,2018
Optimum
ACR< 3.4
mg/mmol is
too high
ACR of .11-
.12
mg/mmol
has a .28
ml/min/yr.
steeper rate
of FGR
decline than
< .1
mg/mmol
Cardiovascular Disease Biomarkers
and suPAR in Predicting Decline in
Renal Function: A Prospective
Cohort Study
Salim S.Hayek1Yi
AnKo12MosaabAwad1HinaAhmed1BrandonGray1Kareem
MohammedHosny1HiroshiAida1Melissa
J.Tracy3ChangliWei3SanjaSever4JochenReiser3Arshed A.
Discussion
hs-CRP, FDP, HSP-70, and hs-TnI were not associated with eGFR decline. The
specific association of suPAR with eGFR decline supported its involvement in
pathways specific to the pathogenesis of kidney disease.
Figure 5
Kidney International 2017 91, 1300-1311DOI: (10.1016/j.kint.2016.10.046)
Copyright © 2017 International Society of Nephrology
KFD
• Plasma high- sensitive troponin T
predicts ESRD and CVD and All
Cause mortality in DM
• Desai. AM J Kidney disease
• Galsgaard. KI, 2017
Saulnier, diabetes care, 2017
Prospective study of association of circulating biomarkers (
Adrenomodulin, sTNFR1, and N- terminal prohormone brain naturetic
peptide) with renal function decline in DM type 2
1,135 pts,
GFR 76
ml/min
RFL= > 40%
decline in
GFR
Rapid
decline=
slope < -5
ml/min/yr.
diabetes
care, 2017
KFD Conclusions
• CKD has Variable course
• 9 out of 10 will die before reaching ESRD
• eGFR and albumin/Cr ratio slopes are
good outcome measures to study kidney
disease progression
• Surrogate biomarkers can be added to
study protocols on disease progression
KFD
•Conclusions
• Rates of decline in eGFR,
albumin/creatinine ratio and
biomarkers can be implemented
in National Egyptian studies as a
priority over isolated
biochemical/ molecular studies
Rate of kidney function decline (KFD) and subsequent ESRD - prof. Ahmed Shokr

Rate of kidney function decline (KFD) and subsequent ESRD - prof. Ahmed Shokr

  • 1.
    RATE of KIDNEYFUNCTION DECLINE (KFD) and SUBSEQUENT ESRD Ahmed Shoker
  • 3.
    KFD •Aim: • Highlight SIGNIFICANCEof rate of kidney function decline (KFD) as a potential Predictive outcome measure to manage and study CKD progression to ESRD, and perhaps for the study of CKD in Egypt • as highlighted in the 2016 ISN Global kidney health Summit outputs published in KI , volume 7, issue 2, October 2017 and thereafter
  • 4.
    Kidney function decline •Background: •ISN Global kidney health Summit outputs published in KI , volume 7, issue 2, October 2017
  • 5.
    KFD •Background • Output ofsummit included suggested plans to : • 1) determine and monitor prevalence of CKD
  • 6.
    KFD •Background • Output ofsummit included suggested plans to : • 2) Genetic and environmental risk factors for CKD • Heavy metals • Agriculture chemicals • Occupational exposure • Traditional herbals • Sugary beverages • Salty foods • Infections
  • 7.
    Kidney function decline •Background •Output of summit included suggested plans to : • 3) Closing the gap between evidence and practice in CKD • 4) Systemic kidney disease and complications associated with decline in kidney function • 5) Establish and validate novel therapeutic targets to retard progression of CKD • 6) optimize design of clinical trials in CKD
  • 8.
    Kidney Function decline •Background •Output of summit included suggested plans to : • 7) Strategies to improve monitoring disease progression, assessing CVD risk, and defining prognostic biomarkers in CKD
  • 9.
    KFD •Aim: • Highlight SIGNIFICANCEof rate of kidney function decline (KFD) as a potential predictive outcome measure to study CKD progression to ESRD, and perhaps for the study of CKD in Egypt.
  • 10.
    KFD • GFR TIME Threshold forintervention Rate of decline in kidney function= delta change in GFR per time unit
  • 11.
    KFD •Aim:• highlight SIGNIFICANCEof rate of kidney function decline (KFD) as a potential predictive outcome measure to study CKD progression to ESKD, and perhaps for the study of CKD in Egypt. •Q # 1 •Why is the focus on Study of CKD?
  • 12.
    KFD •Quiz • In populationstudies of kidney disease, what is the percentage of CKD patients who will make it to ESRD • 1-2 % • 10- 20 % • 40- 60% • 70- 80 % • 90%
  • 13.
    KFD • Incidence/Prevalence ofESRD, • 150/1800 per million= .0001% • Incidence/ Prevalence of CKD= 3- 11% • Ratio (Incidence/Prevalence) of ESRD/CKD= • 1/500 • 1/1000 • eGFR< 60 ml/min is attributed to 4% of deaths worldwide • Thomas B, JASN, 2017
  • 14.
    Risk of nephrectomy •Study natural history of CKD in 27,998 with eGFR below 90 ml/m • 5 yrs follow up • ESRD= 1.1% (stage 2) ****Mortality= 19.5% • ESRD= 1.3% (stage 3) ****mortality= 24.3% • ESRD= 19.9% (stage 4)****Mortality= 45.7% • Conclusion” Only 2% will progress to ESRD” • Keith D,et al • Arch Intern Med 2004;164: 659
  • 15.
    KFD • Why isthe focus on CKD? • 1) 9 out of 10 will die before ESRD • 2) Manage CKD differs by stage • 3) High prevalence of CKD and it’s association with modifiable causes and increased CVD and mortality rates, long before dialysis • 4) Early intervention and avoidance of nephrotoxic exposure can be done
  • 16.
    KFD • Why isthe focus on CKD?, because; Early intervention before it’s to late •Q #2 • Can we predict patients who progresses to ESRD/ high risk mortality? •Q # 3 • Can we develop Predictor outcome measures ( ESRD, etc) for clinical studies and patient management with CKD?
  • 17.
    Kidney function decline •Thestory of potential outcome measures in CKD
  • 18.
    KFD • Outcome measuresin nephrology clinical studies • Differs between CKD/ HD/ PD/TX • Different priorities of Pts, clinicians, researchers, caregivers • Outcome: is something that can be measured, and can arise or change because of a health condition or treatment • Core outcome set: is an agreed standardized set of outcomes that should be measured and reported, as a minimum, in all clinical trials in specific areas of health or health care. Researchers may add other outcomes to the core outcome set • Nistor, NDT, 2017
  • 19.
    KFD • Standardized OutcomesIn Nephrology (SONG) • Initiative to establish set of outcome measures • SONG- Tx • SONG- Kids • SONG-PD • SONG-CKD • SONG- PCKD • SONG handbook,2017 • Transplant, 2017 • Tong, A. NDT, 2017
  • 20.
    Kidney function decline •Thestory of rate of kidney function decline (KFD) as a potential predictive outcome measure for subsequent ESRD
  • 22.
    Kidney Function Decline •Mean rates ( ml/min/yr) of eGFR decline ( is variable, but constantin individual pts) • DM .0 - 12.6 • IGA 1.4 - 9.5 • MN 4.6 - 9.5 • Chronic GN 2 - 10.4 • TID 2 - 5.4 • PCKD 3.8- 5.4 •Q # 4 • Can we grade rates of kidney function declines into slow/ fast? to use as outcome measure in the study CKD?
  • 23.
    KFD • Meta-analysis of1.7 million pts • Adjusted HR for ESRD, mortality were higher for larger decline in eGFR over 1- 3 yrs • JAMA, 2014,, Coresh et al
  • 24.
    KFD • AHR ofESRD for Pts with eGFR decline over 2 yrs of • > 57% = ESRD of 32.1 • > 30% = ESRD of 6.9 • < 30% = ESRD of 5.4 • AHR for patient mortality adjusted for 10 yrs were similar
  • 25.
    KFD • 1) Declinein EGFR smaller than doubling SCr occurs more commonly • And strongly associate with risk for ESRD • 30% reduction in eGFR over 2 years is alternative end point for CKD progression in 10 yrs. • JAMA, 2014,, Coresh et al • Inker, Am j Kid Dis, 2014 • Badve,NDT,2015 • PLoS One, Tsai,2017
  • 26.
    KFD •Definition of rapid progressionas rate of eGFR > 5 ml/min/yr. • KI,91,issue6, june2017
  • 27.
    KFD • FDA accepts30%- 40% decline in eGFR over 2- 3yrs in eGFR as an end point in clinical studies • Acceptable, shorter duration, smaller population and simple and cheap target • Coresh, JAMA, 2014 Coresh, JASN 2016: 27;2447 • Badve, NDT,,2016 • Carlesson CJASN, 2017. vol12 •
  • 28.
    KFD •The story ofrate of kidney function decline (KFD) as a potential predictive outcome measure for subsequent ESRD Continues
  • 30.
    Patterns of progressionof chronic kidney disease at later stages Fernando Caravaca-Fontán Lilia Azevedo Enrique Luna Francisco Caravaca Clinical Kidney Journal, sfx083, https://doi.org/10.1093/ckj/sfx083 Published: 28 July 2017 Conclusions: A majority of patients with advanced CKD show patterns of renal function decline different from linear, and several of the main determinants of CKD progression are potentially modifiable.
  • 31.
    From: Patterns ofprogression of chronic kidney disease at later stages Clin Kidney J. Published online July 28, 2017. doi:10.1093/ckj/sfx083 Clin Kidney J | © The Author 2017.
  • 32.
    From: Patterns ofprogression of chronic kidney disease at later stages Clin Kidney J. Published online July 28, 2017. doi:10.1093/ckj/sfx083 Clin Kidney J | © The Author 2017.
  • 33.
    Fast renal declineto end-stage renal disease: an unrecognized feature of nephropathy in diabetes. Krolewski AS1, Skupien J2, Rossing P3, Warram JH4. Kidney Int. 2017 Jun;91(6):1300-1311. doi: 10.1016/j.kint.2016.10.046. Epub 2017 Mar 31.
  • 34.
    Distribution of categoriesof progressive renal decline during 6–10 years of follow-up in patients with type 1 diabetes and type 2 diabetes in the Joslin Kidney Studies according to category of albuminuria at entry into follow-up
  • 35.
    Distribution of categoriesof progressive renal decline during 6–10 years of follow-up in patients with type 1 diabetes and type 2 diabetes in the Joslin Kidney Studies according to category of albuminuria at entry into follow-up
  • 36.
    Figure 3 Kidney International2017 91, 1300-1311DOI: (10.1016/j.kint.2016.10.046) Copyright © 2017 International Society of Nephrology
  • 37.
    Kidney function decline •Definition of rapid progression as rate of eGFR > 5 ml/min/yr. • Newer definitions; very fast, fast, moderate and slow • KI,91,issue6, june2017
  • 38.
    KFD Suggested outcomes inmeasuring kidney disease status in randomized studies • eGFR > 45 ml/min ( Stages G1- G3a) : • slope of eGFR or surrogate biomarkers • Rapid progression = 30- 40 % decline over 2yrs • Later stages. • Slow progression = 30%- 40% decline in eGFR • Rapid progression = > than 40% decline in GFR • Baigent. KI, 92, 297
  • 39.
    KFD • Limitations ofrate of KFD as an outcome measure • 1) Is the rate of decline in eGFR linear? • 22-18% Non linear in PCKD • 20% in DM • 30% in GN •Q # 5 • Can we improve on rate of KFD as outcome measure?
  • 40.
    KFD • Limitations ofrate of KFD as an outcome • 1) Is the rate of decline in eGFR linear? • 22-18% Non linear in PCKD • 20% in DM • 30% in GN •Q # 6 • Can we further, improve on rate of KFD as measure of progressive CKD?
  • 41.
    KFD • Contribution ofpast decline VS current eGFR and subsequent risk of ESKD • eGFR decline of 18 ml/min /3 yrs • AHR of 2.28 • Current eGFR of 30 ml VS 50 ml= AHR of 19.9 • Conclusion; Current eGFR and rate of decline contribute to risk of ESRD • Kovesdy, JASN. 2017
  • 42.
    KFD •Q # 7 •To what extend proteinuria predicts progressive decline in eGFR??? • Remains controversial • Proteinuria course may not be linear • Need for improved outcome measures using biomarkers
  • 43.
    Distribution of GFRslope/ yr. and proteinuria in the AASK study
  • 44.
    Mild albuminuria isa risk factor for GFR decline in nondiabetic normal population. Melsom,KI,2018 Optimum ACR< 3.4 mg/mmol is too high ACR of .11- .12 mg/mmol has a .28 ml/min/yr. steeper rate of FGR decline than < .1 mg/mmol
  • 45.
    Cardiovascular Disease Biomarkers andsuPAR in Predicting Decline in Renal Function: A Prospective Cohort Study Salim S.Hayek1Yi AnKo12MosaabAwad1HinaAhmed1BrandonGray1Kareem MohammedHosny1HiroshiAida1Melissa J.Tracy3ChangliWei3SanjaSever4JochenReiser3Arshed A. Discussion hs-CRP, FDP, HSP-70, and hs-TnI were not associated with eGFR decline. The specific association of suPAR with eGFR decline supported its involvement in pathways specific to the pathogenesis of kidney disease.
  • 46.
    Figure 5 Kidney International2017 91, 1300-1311DOI: (10.1016/j.kint.2016.10.046) Copyright © 2017 International Society of Nephrology
  • 47.
    KFD • Plasma high-sensitive troponin T predicts ESRD and CVD and All Cause mortality in DM • Desai. AM J Kidney disease • Galsgaard. KI, 2017
  • 48.
  • 49.
    Prospective study ofassociation of circulating biomarkers ( Adrenomodulin, sTNFR1, and N- terminal prohormone brain naturetic peptide) with renal function decline in DM type 2 1,135 pts, GFR 76 ml/min RFL= > 40% decline in GFR Rapid decline= slope < -5 ml/min/yr. diabetes care, 2017
  • 50.
    KFD Conclusions • CKDhas Variable course • 9 out of 10 will die before reaching ESRD • eGFR and albumin/Cr ratio slopes are good outcome measures to study kidney disease progression • Surrogate biomarkers can be added to study protocols on disease progression
  • 51.
    KFD •Conclusions • Rates ofdecline in eGFR, albumin/creatinine ratio and biomarkers can be implemented in National Egyptian studies as a priority over isolated biochemical/ molecular studies