Download as PDF, PPTX

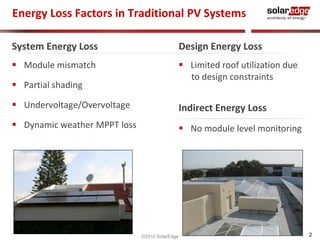
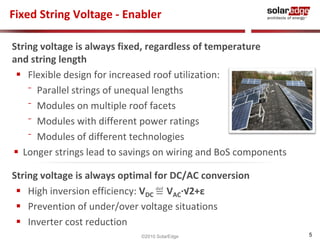
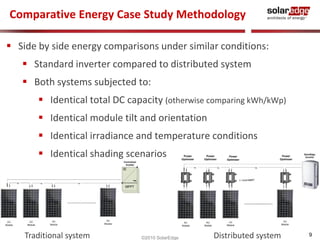
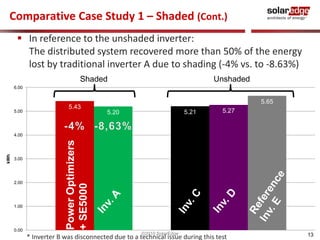
![Comparative Case Study 4 – Results
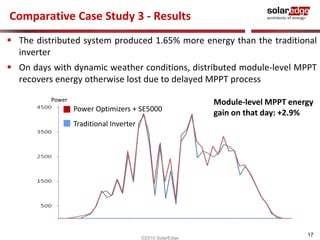
The distributed system produced 4% - 8% more energy than the
traditional inverter on most days of the month
Distributed system production was lower on days with very low
irradiance, due to sizable self consumption of the prototype DSP
version of the unit, now replaced by an efficient ASIC
SolarEdge Daily Energy gain
vs. traditional inverter [%]
Introduction
20
©2010 SolarEdge](https://image.slidesharecdn.com/solaredgeeupvsecconference08-09-10submission-100926010657-phpapp01/85/Maximum-Energy-Case-Studies-EUPVSEC-20-320.jpg)
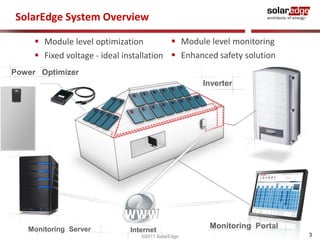
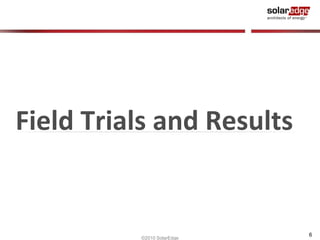
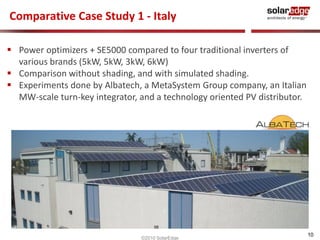
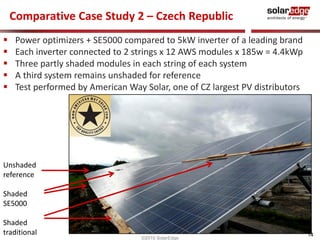
![Comparative Case Study 5 – Results
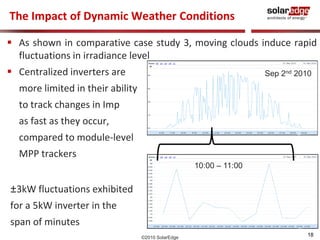
Accumulated Energy comparisons shows the distributed system
consistently produces 4% more energy than the traditional inverter
Traditional [kWh]
SolarEdge [kWh]
Energy Gain in [%]
Weekly Energy
Gain [%]
22
©2010 SolarEdge](https://image.slidesharecdn.com/solaredgeeupvsecconference08-09-10submission-100926010657-phpapp01/85/Maximum-Energy-Case-Studies-EUPVSEC-22-320.jpg)


The document discusses field results of energy-maximizing distributed DC topology for residential and commercial installations using SolarEdge technology. It highlights the advantages of module-level optimization and monitoring, demonstrating that distributed systems produce more energy compared to traditional inverters, especially under shading conditions. Multiple case studies showcase significant energy gains due to enhanced system design and efficiency.


![INDIAN SOLAR ENERGY [Bharat Surya Urja]](https://cdn.slidesharecdn.com/ss_thumbnails/bharatsuryaurja-210701124350-thumbnail.jpg?width=640&height=640&fit=bounds)


![[Case Study] 42.2 kW K-Electric Net Metering Services](https://cdn.slidesharecdn.com/ss_thumbnails/mr-200324081242-thumbnail.jpg?width=640&height=640&fit=bounds)


