Downloaded 325 times
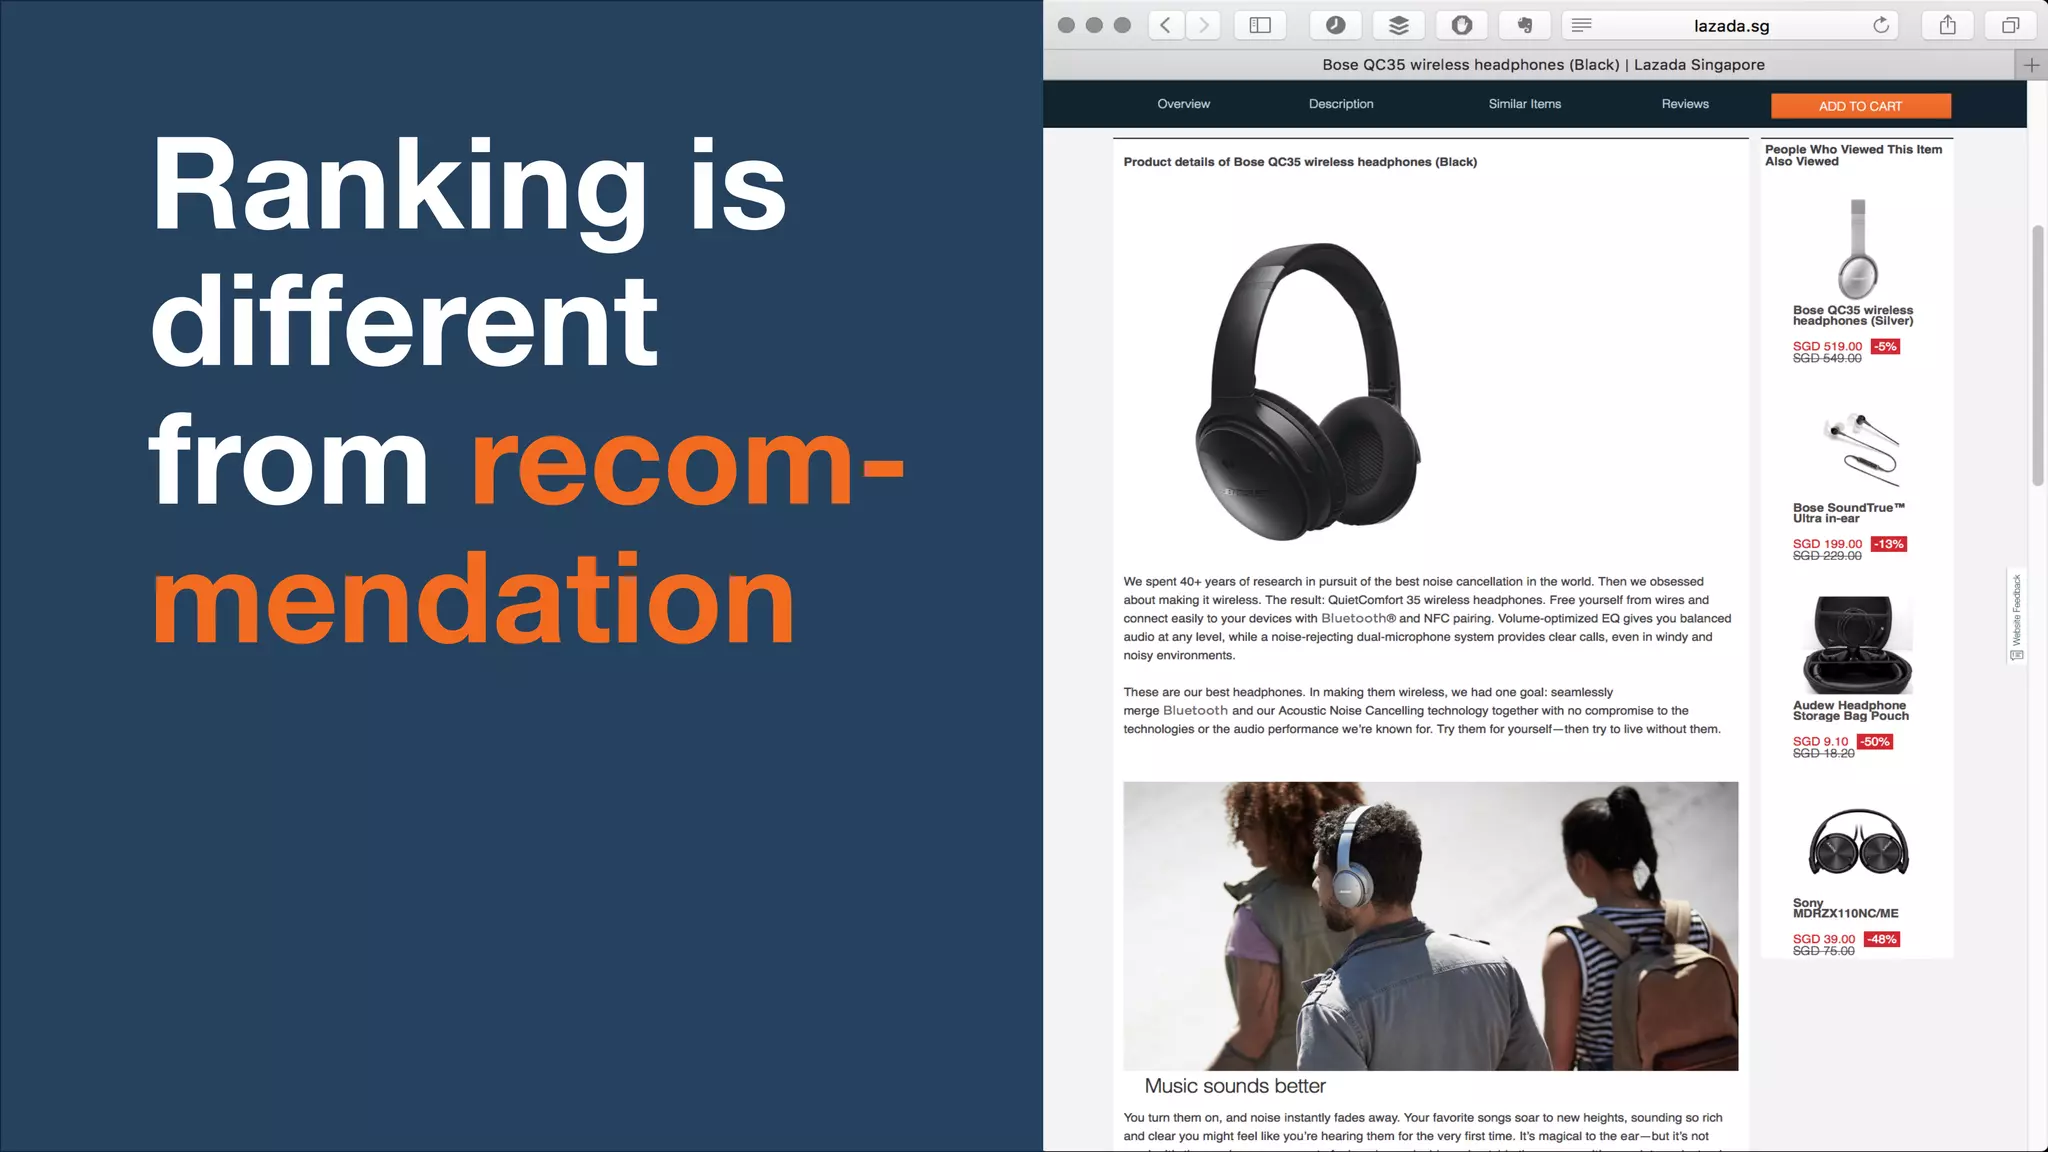


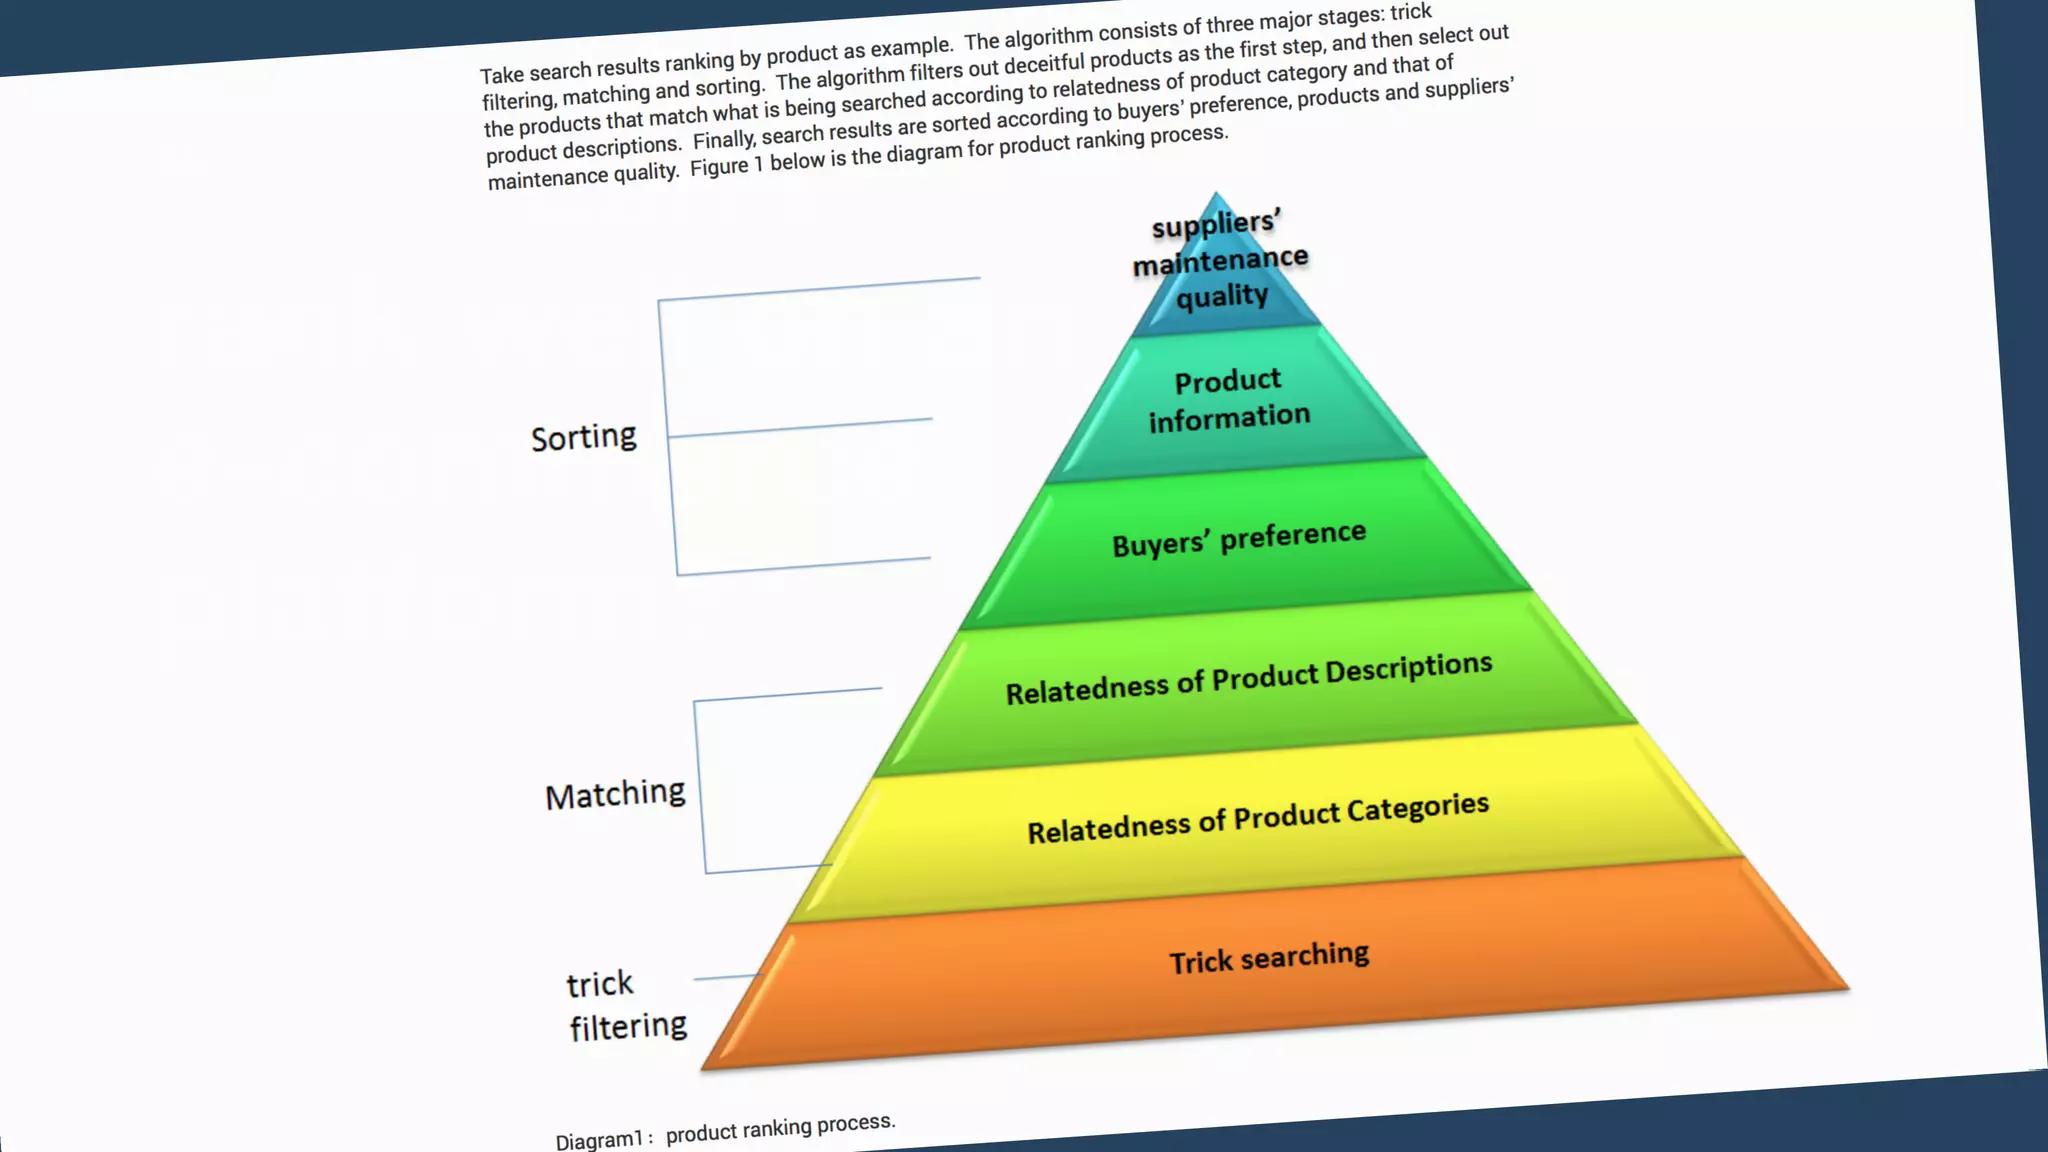


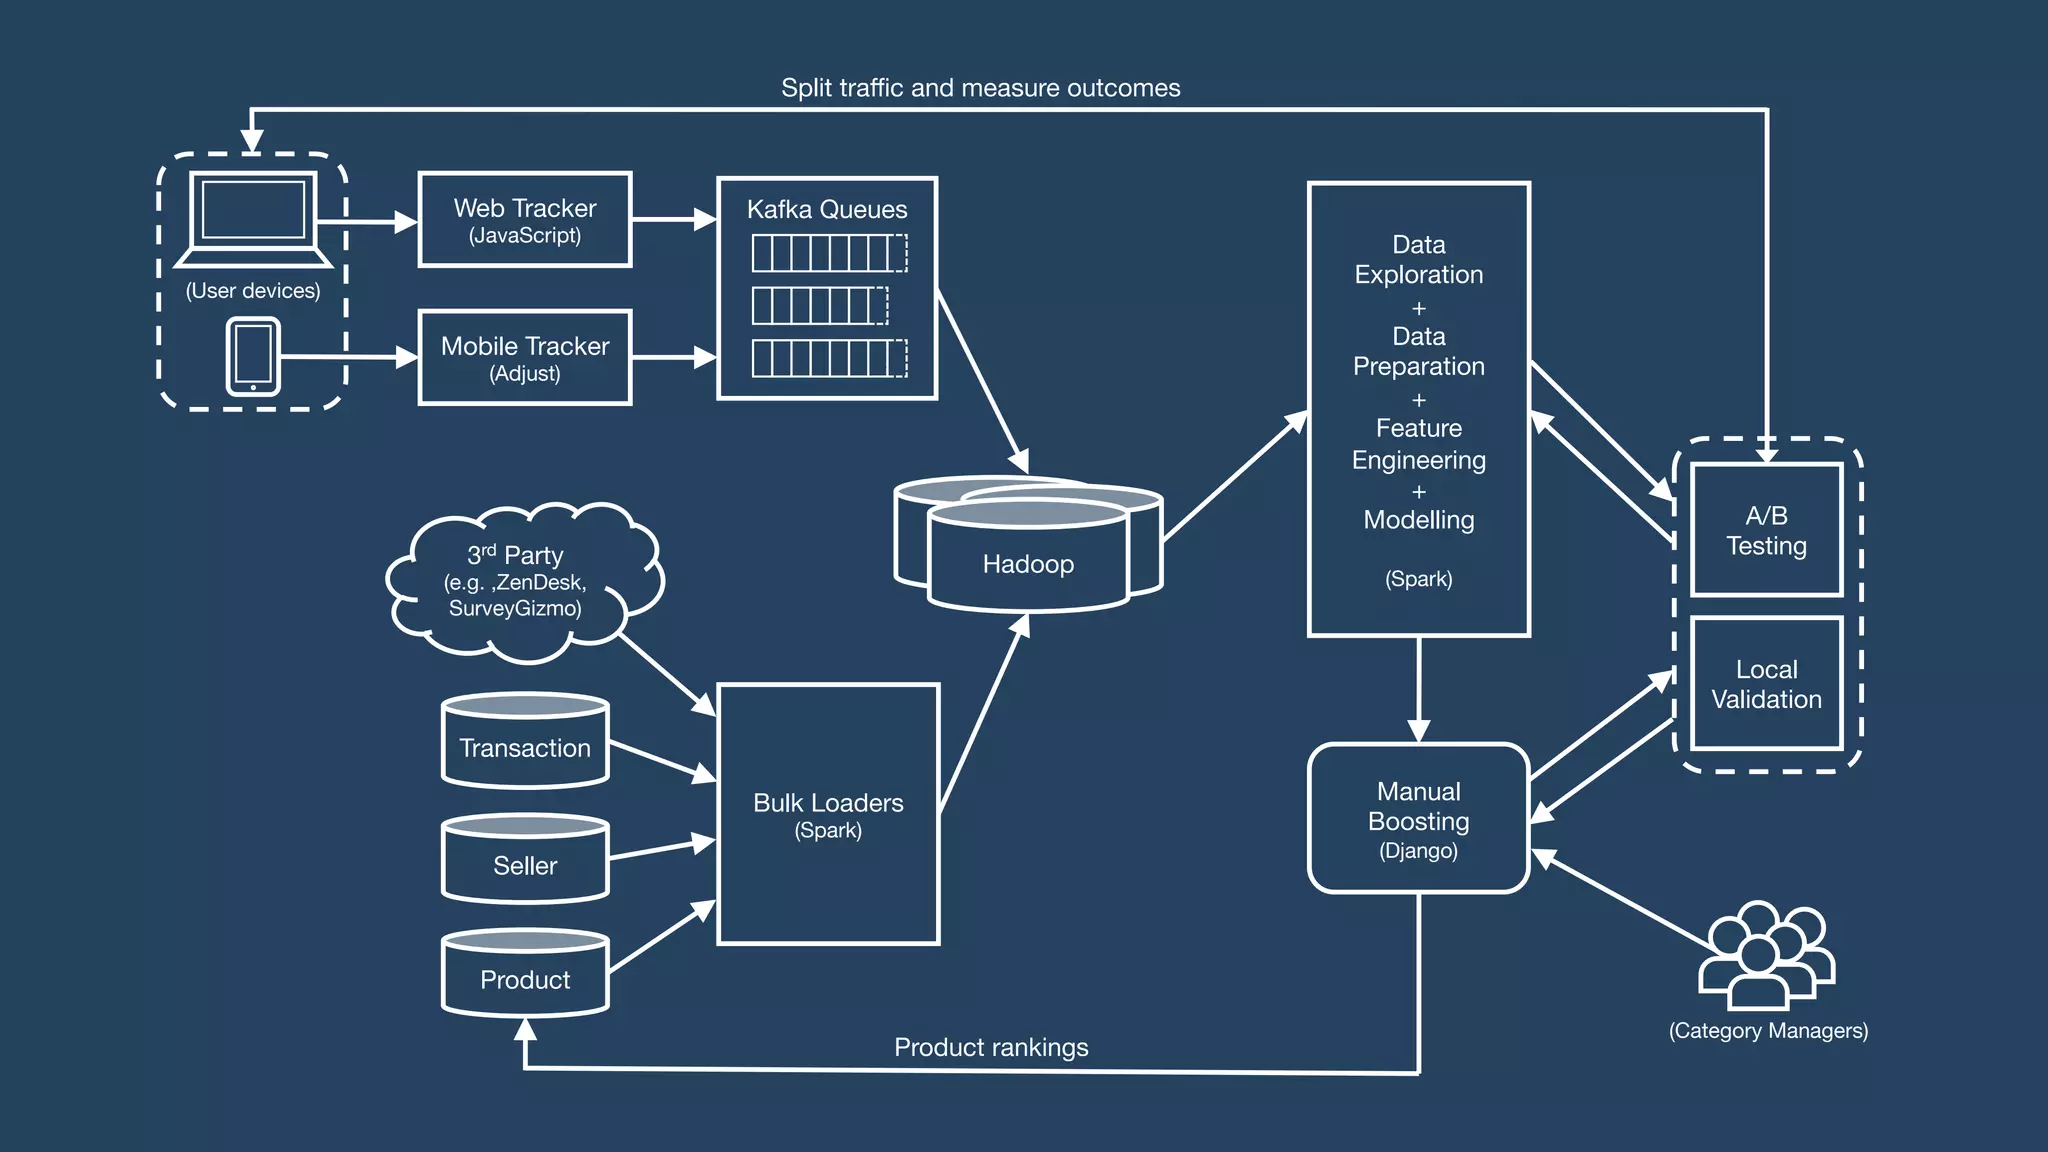
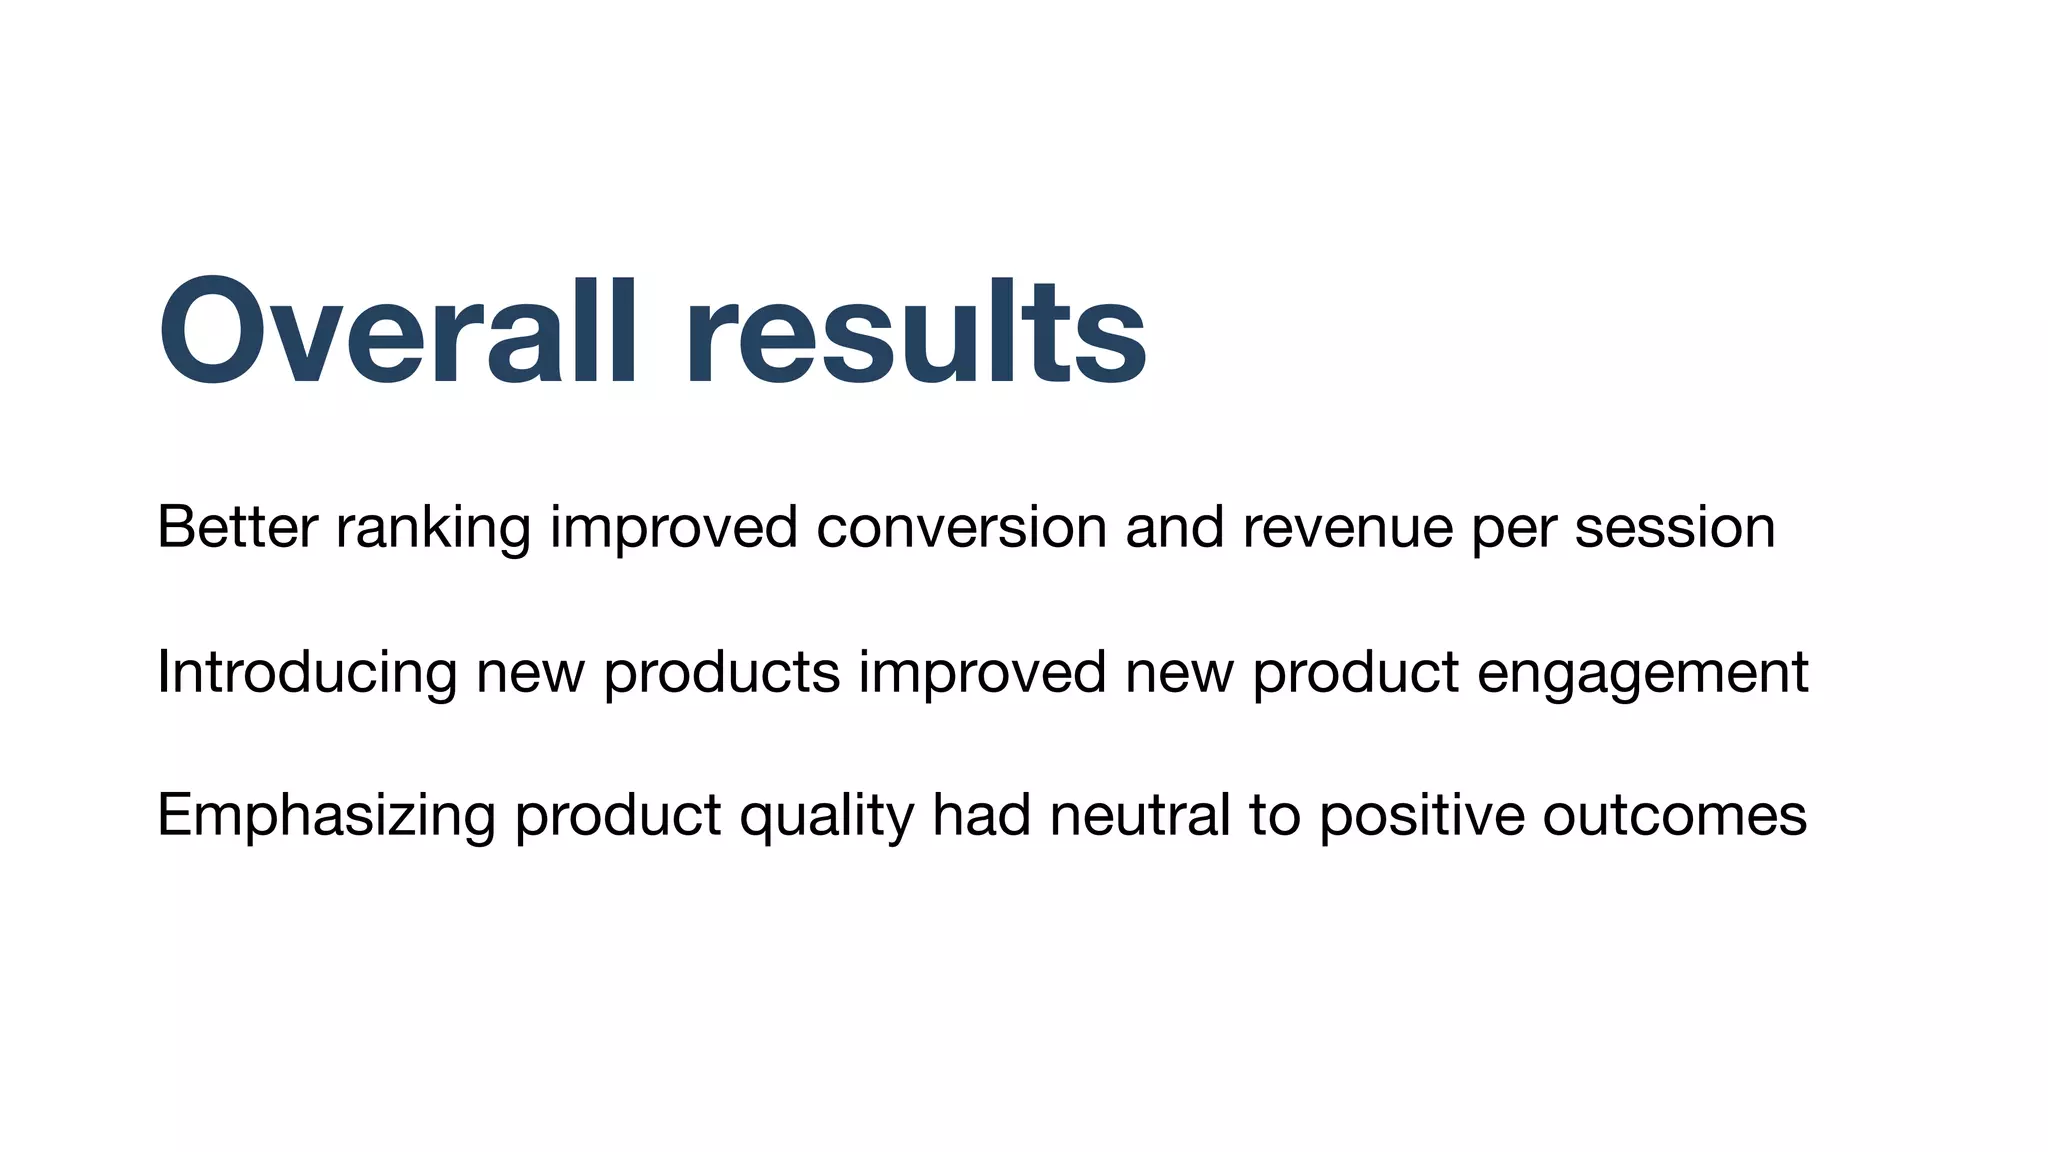


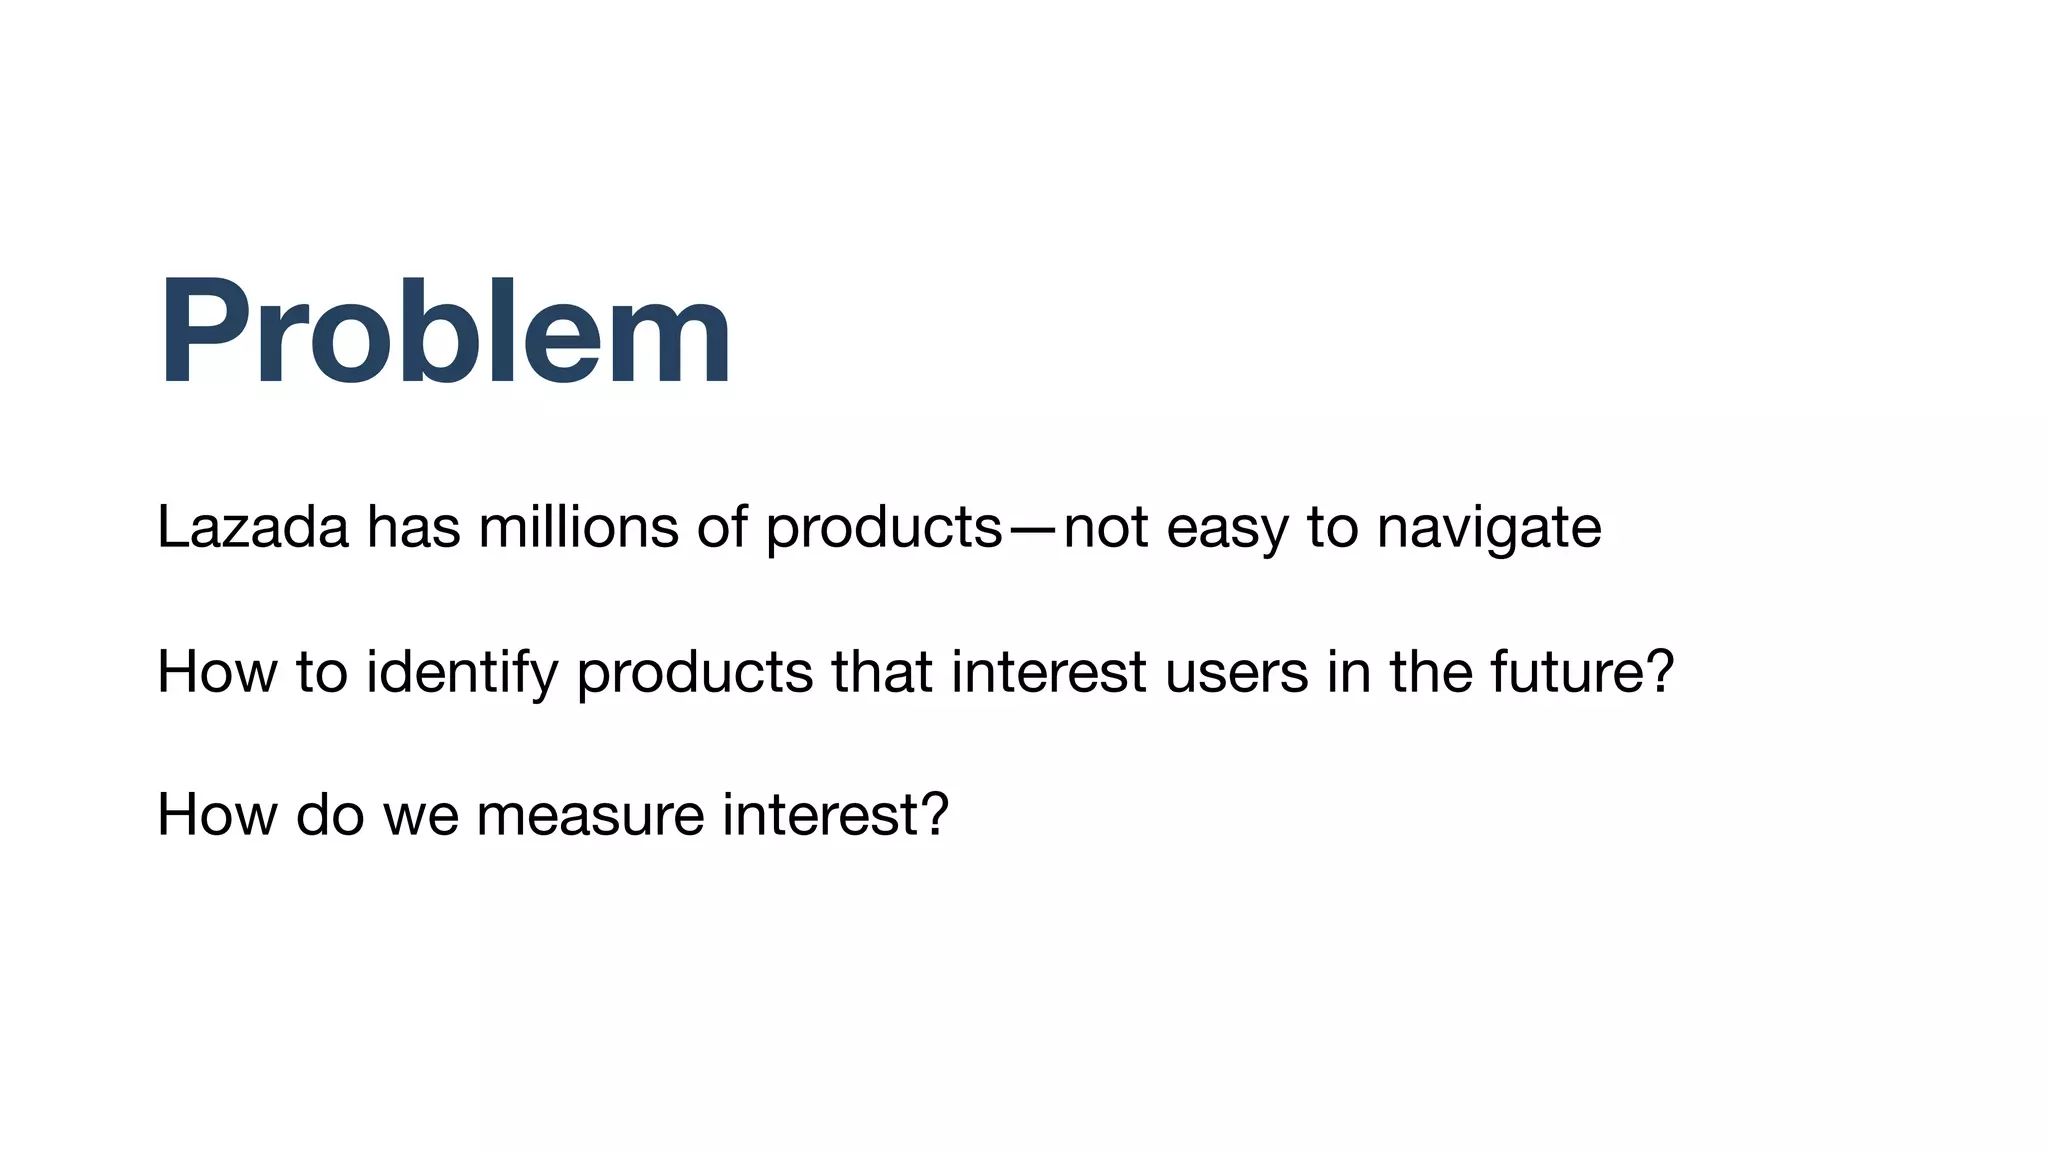
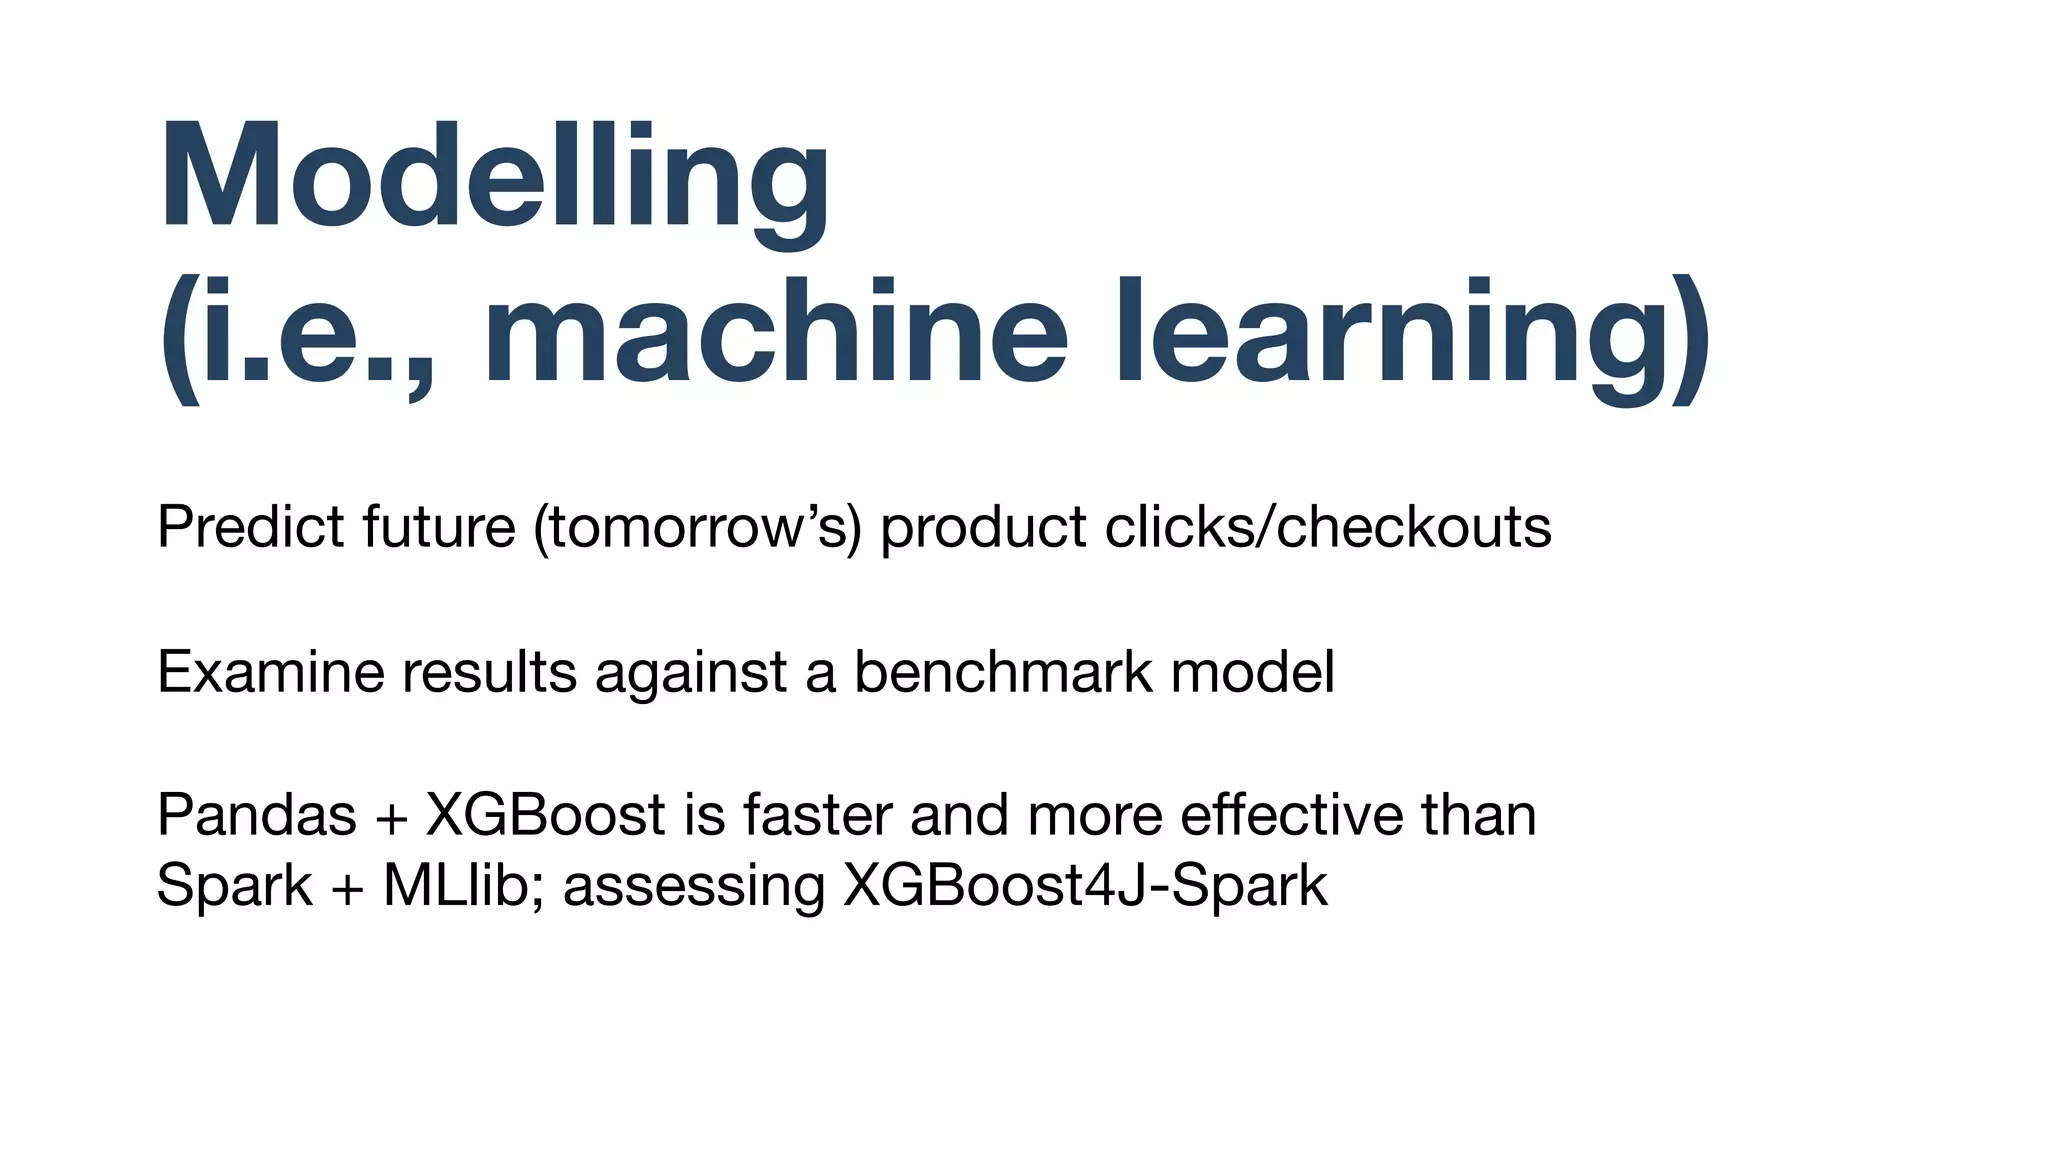
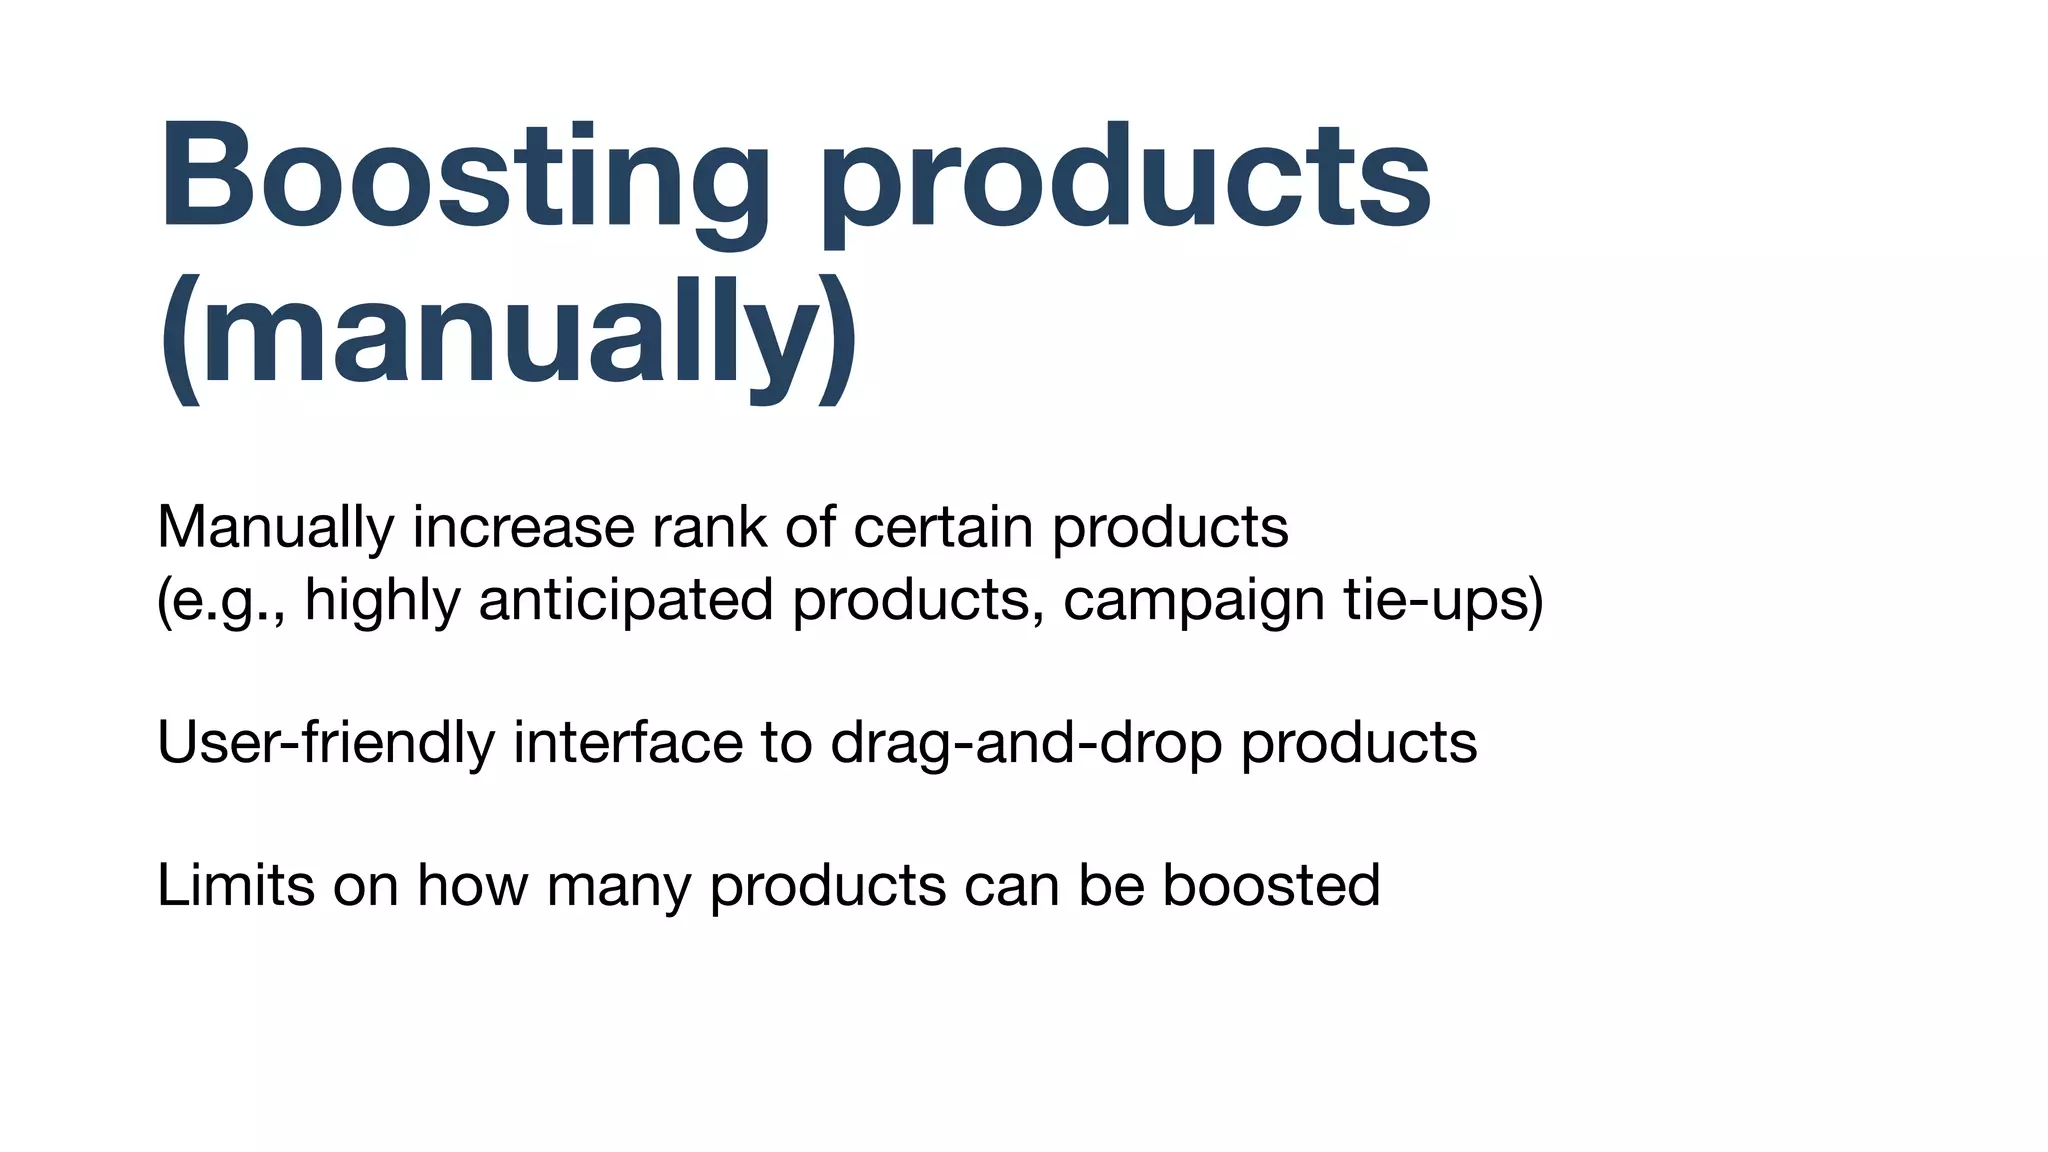
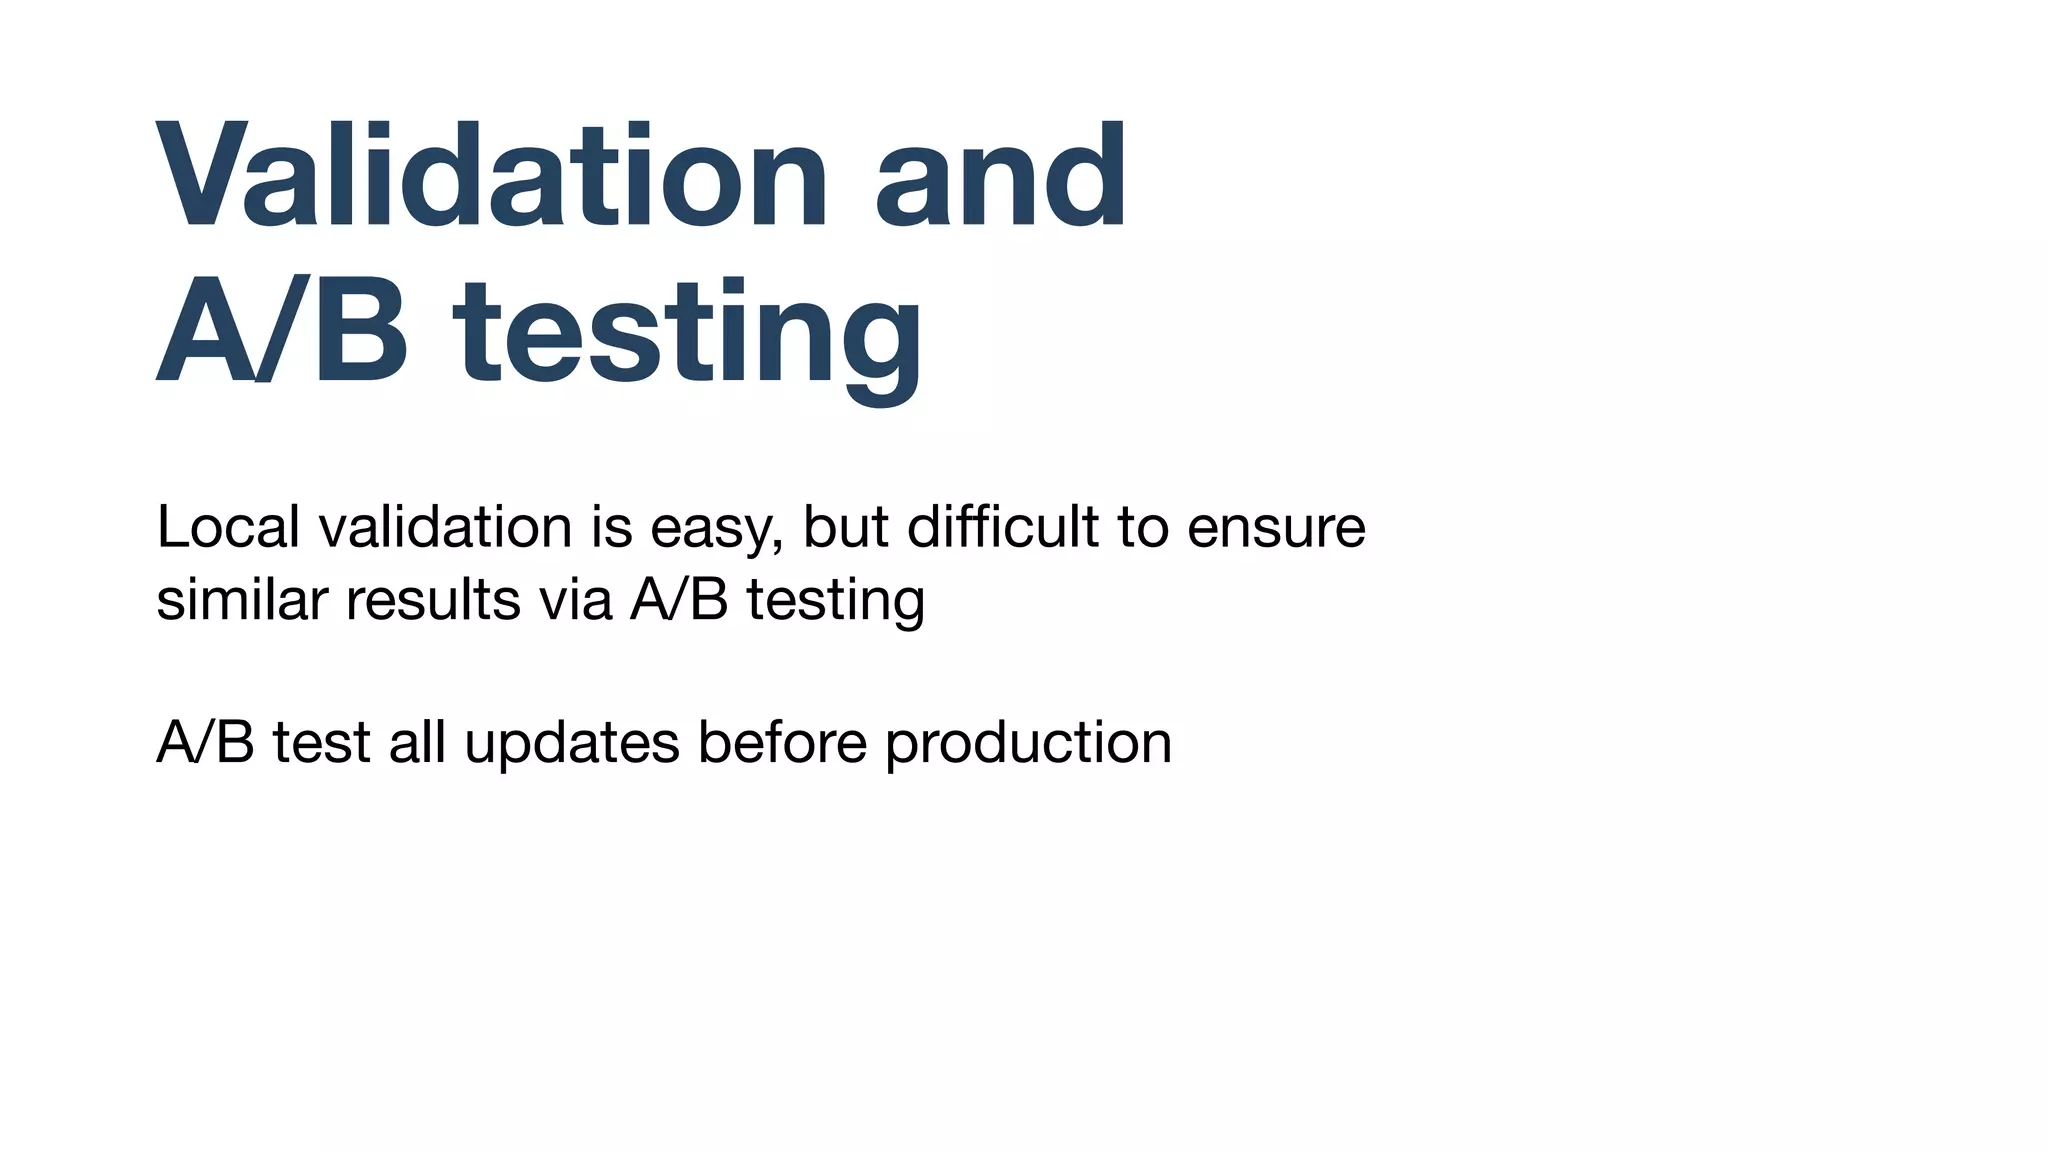
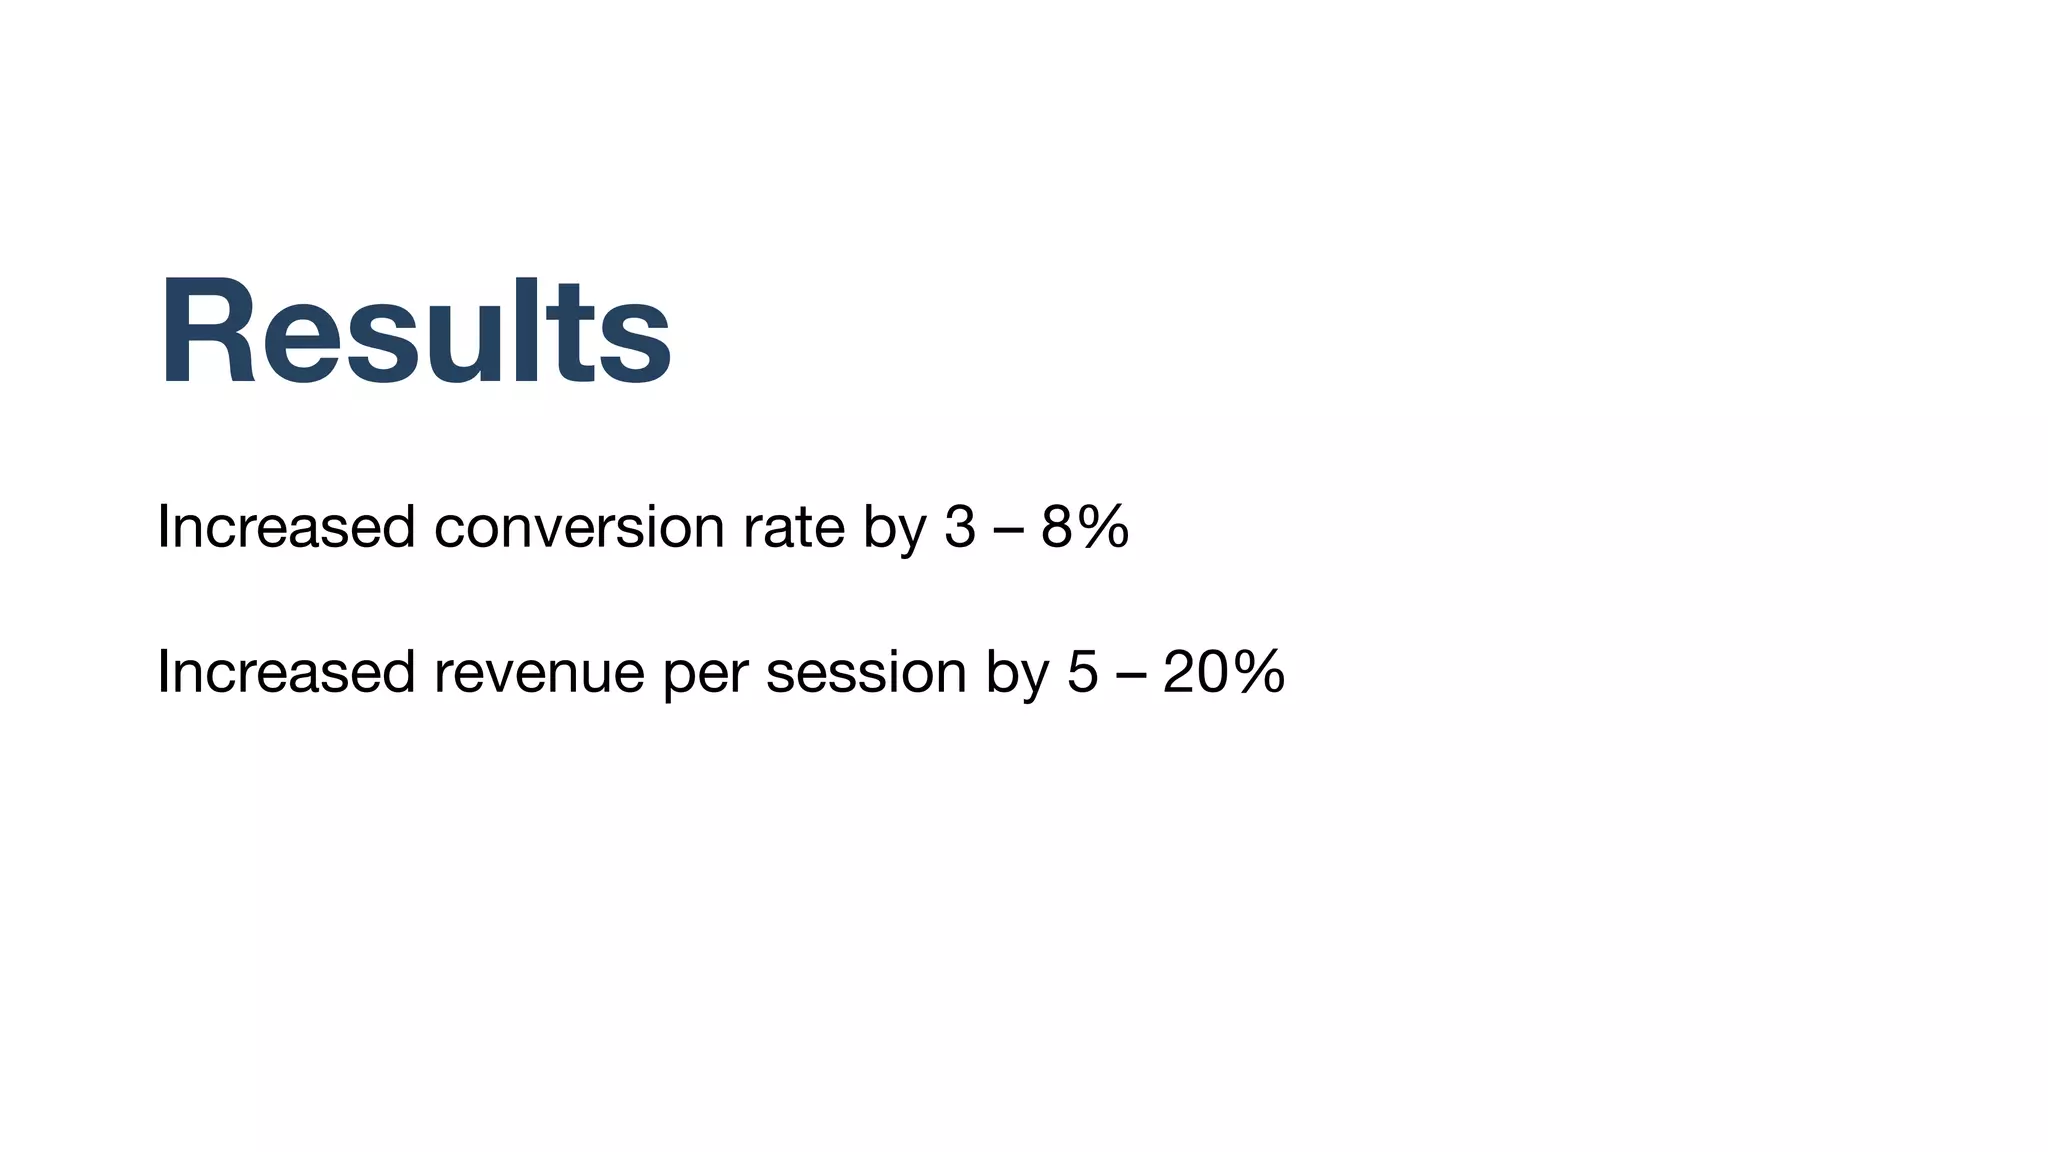

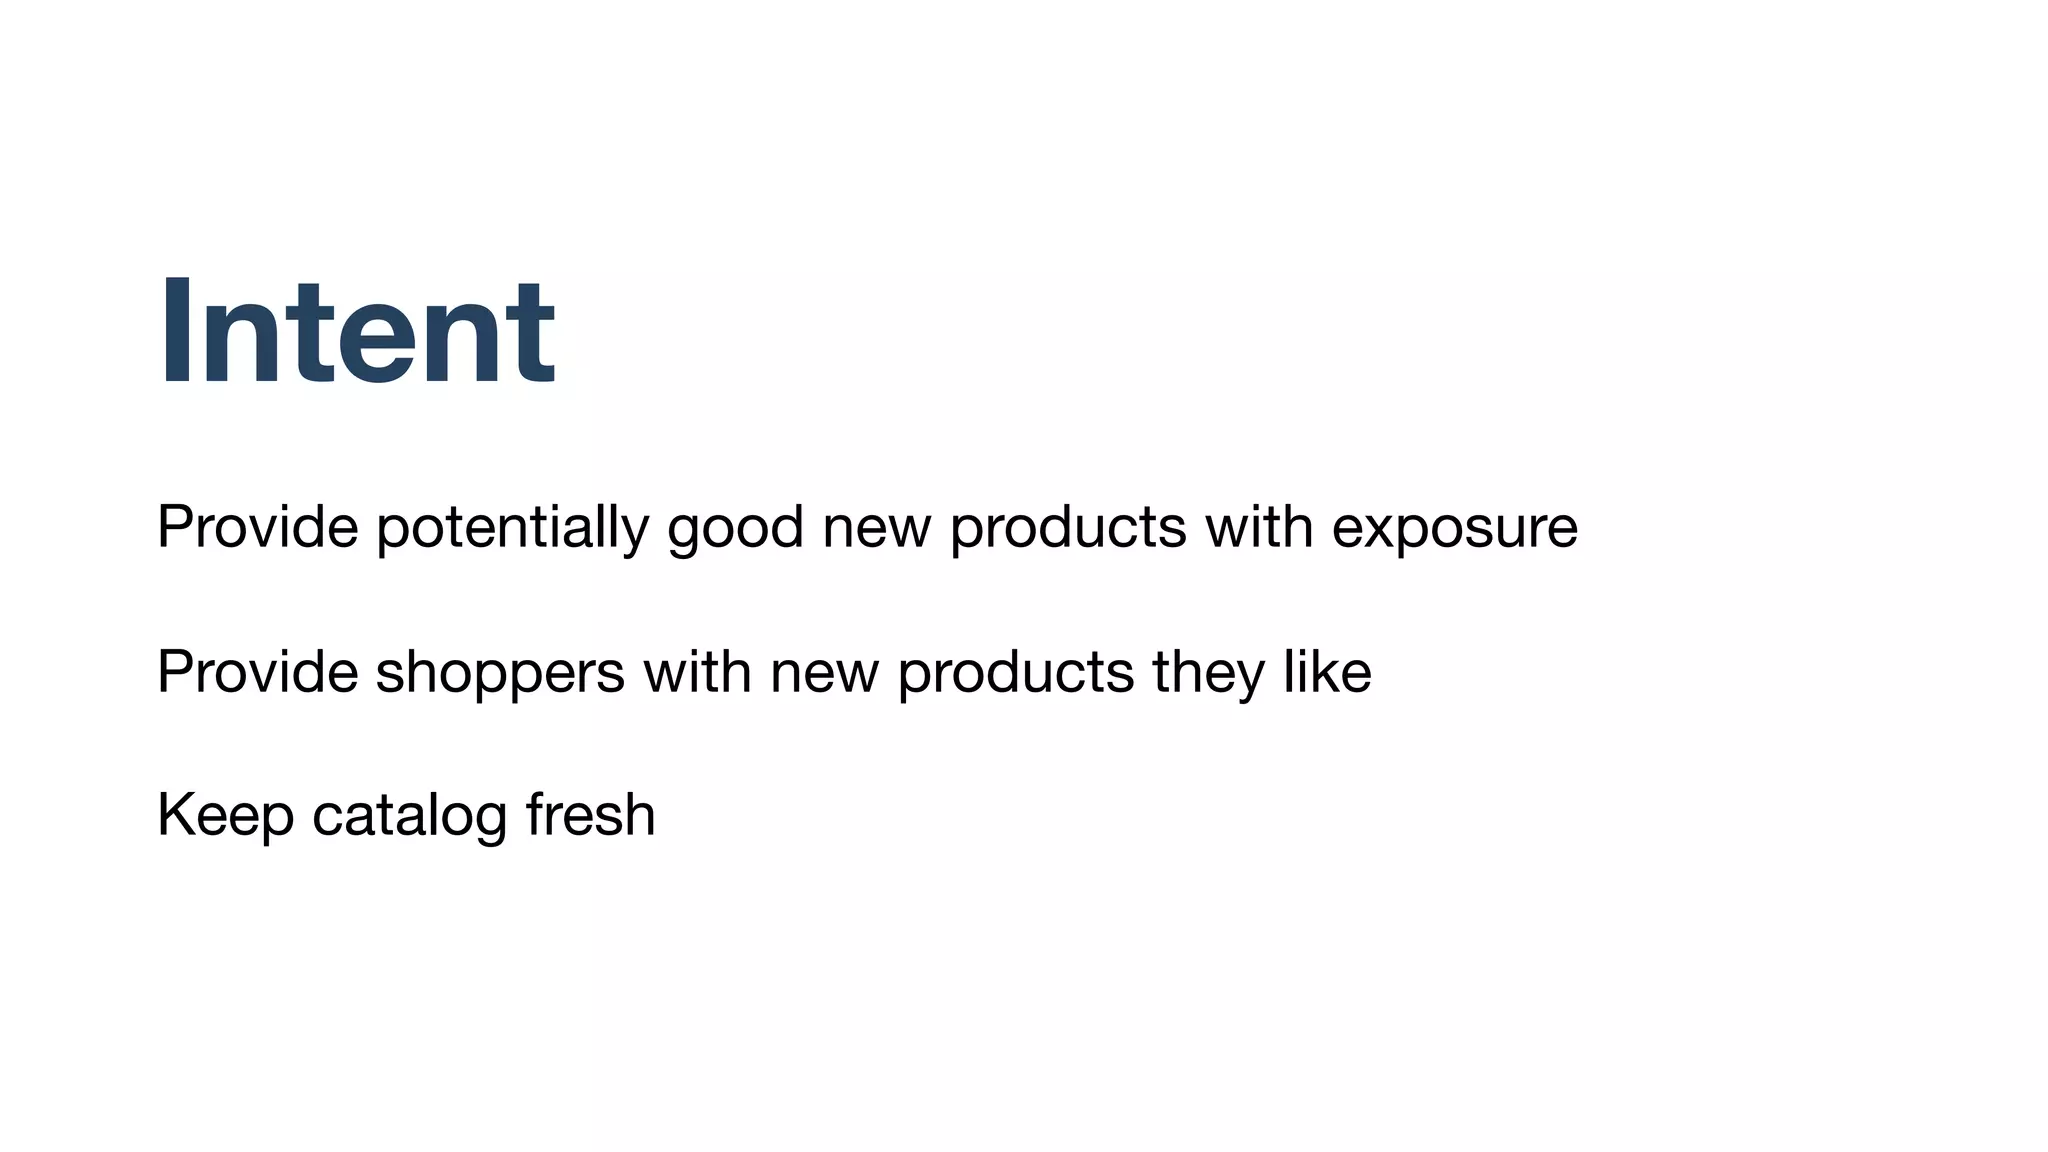
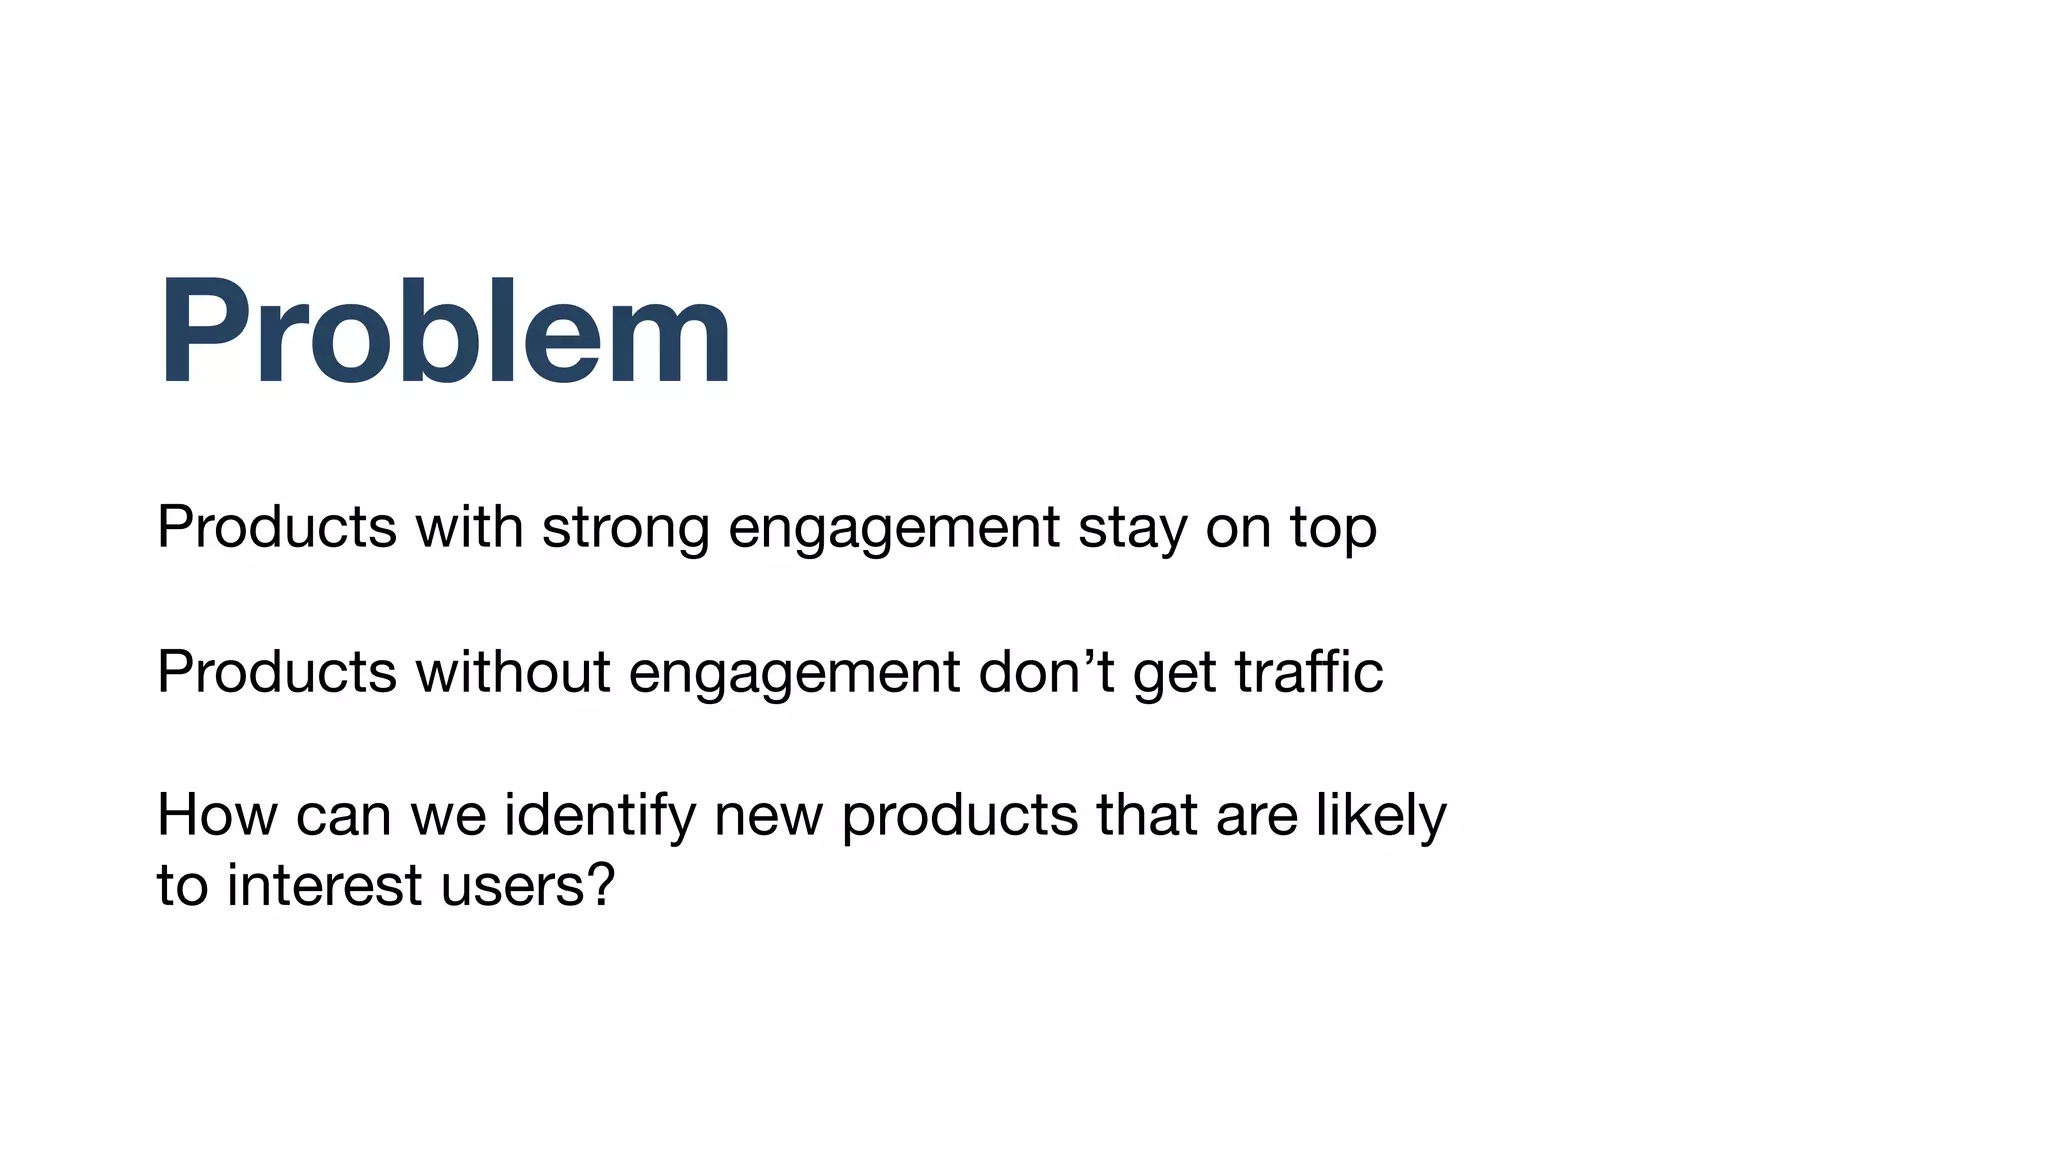
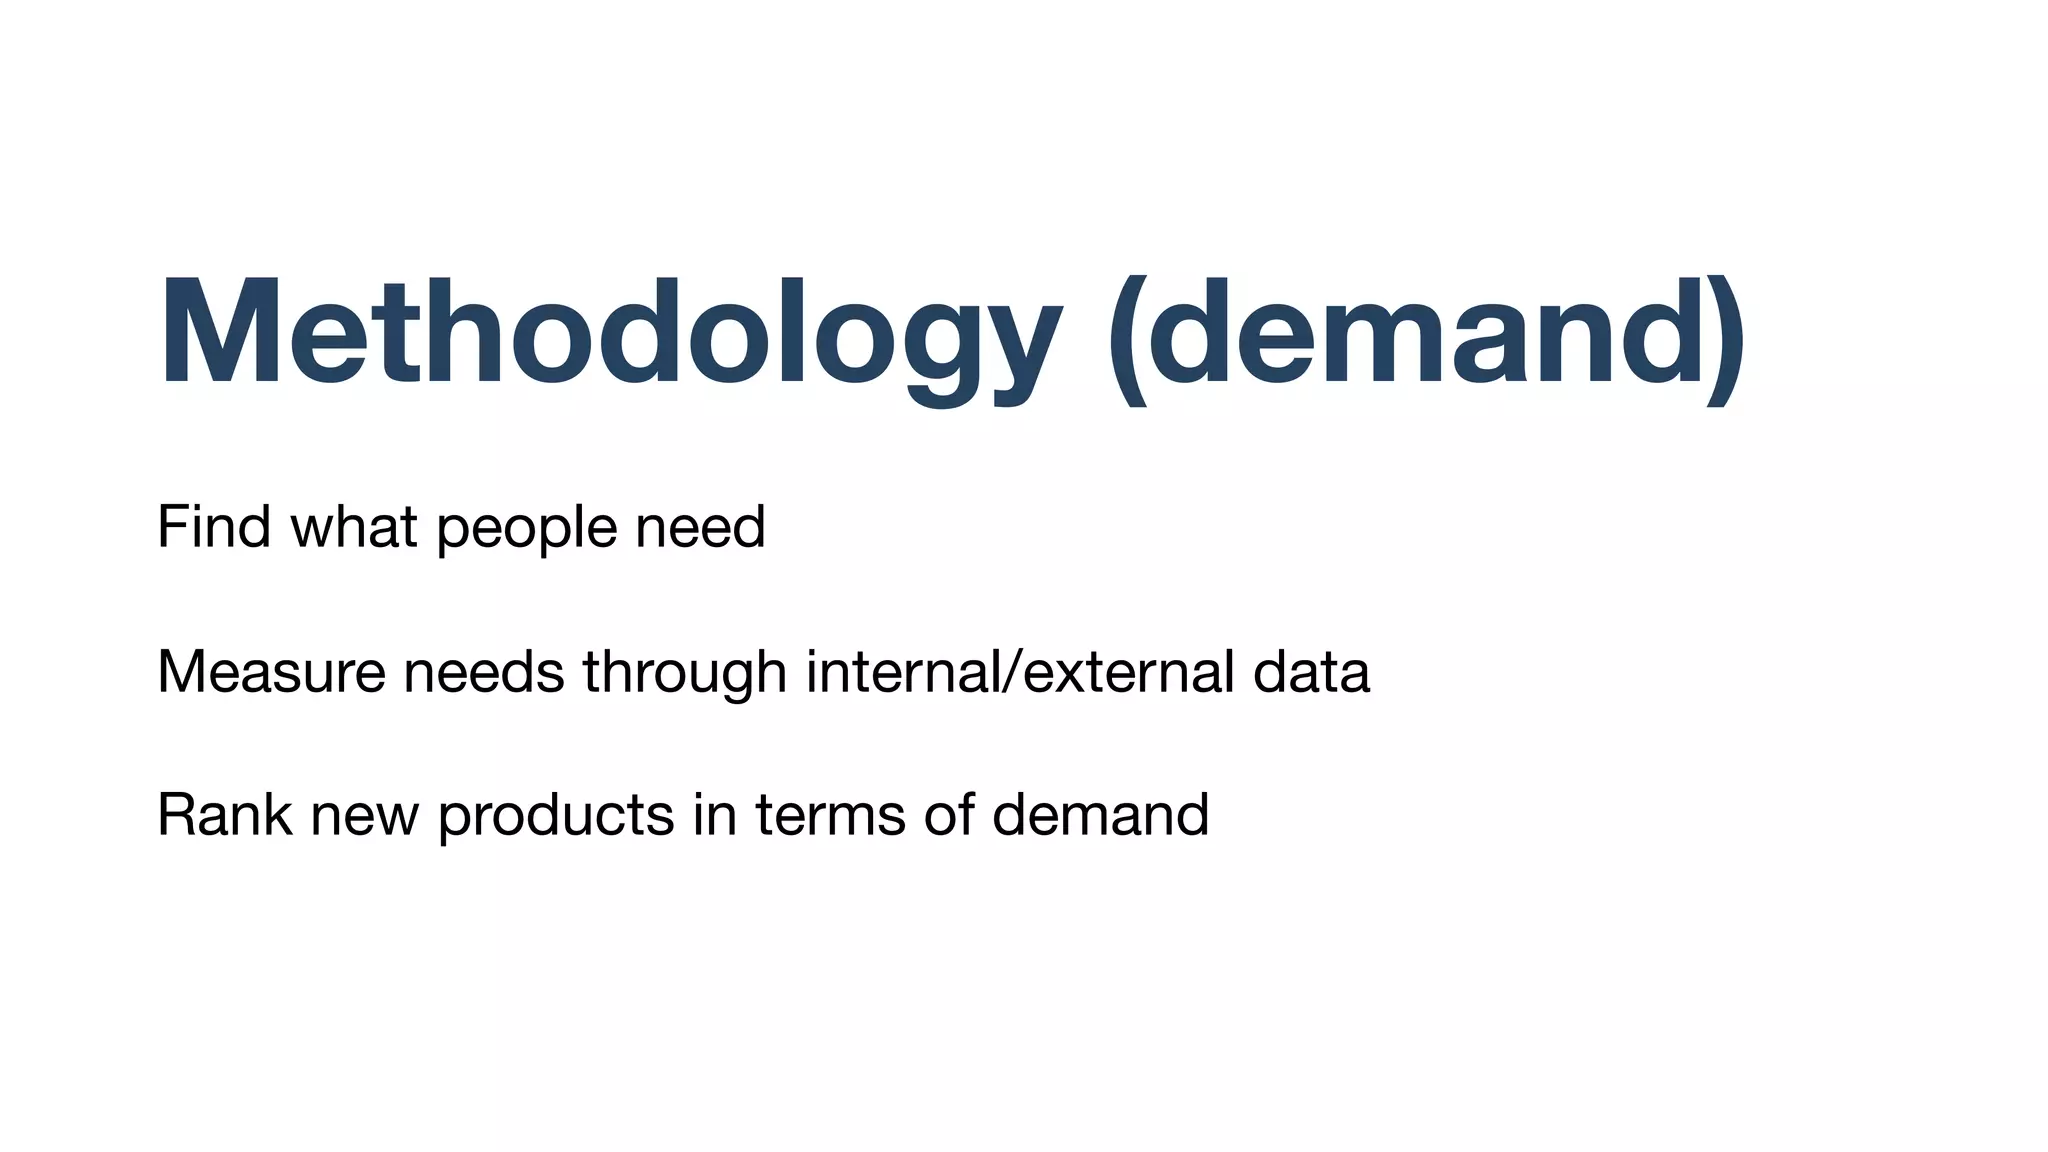
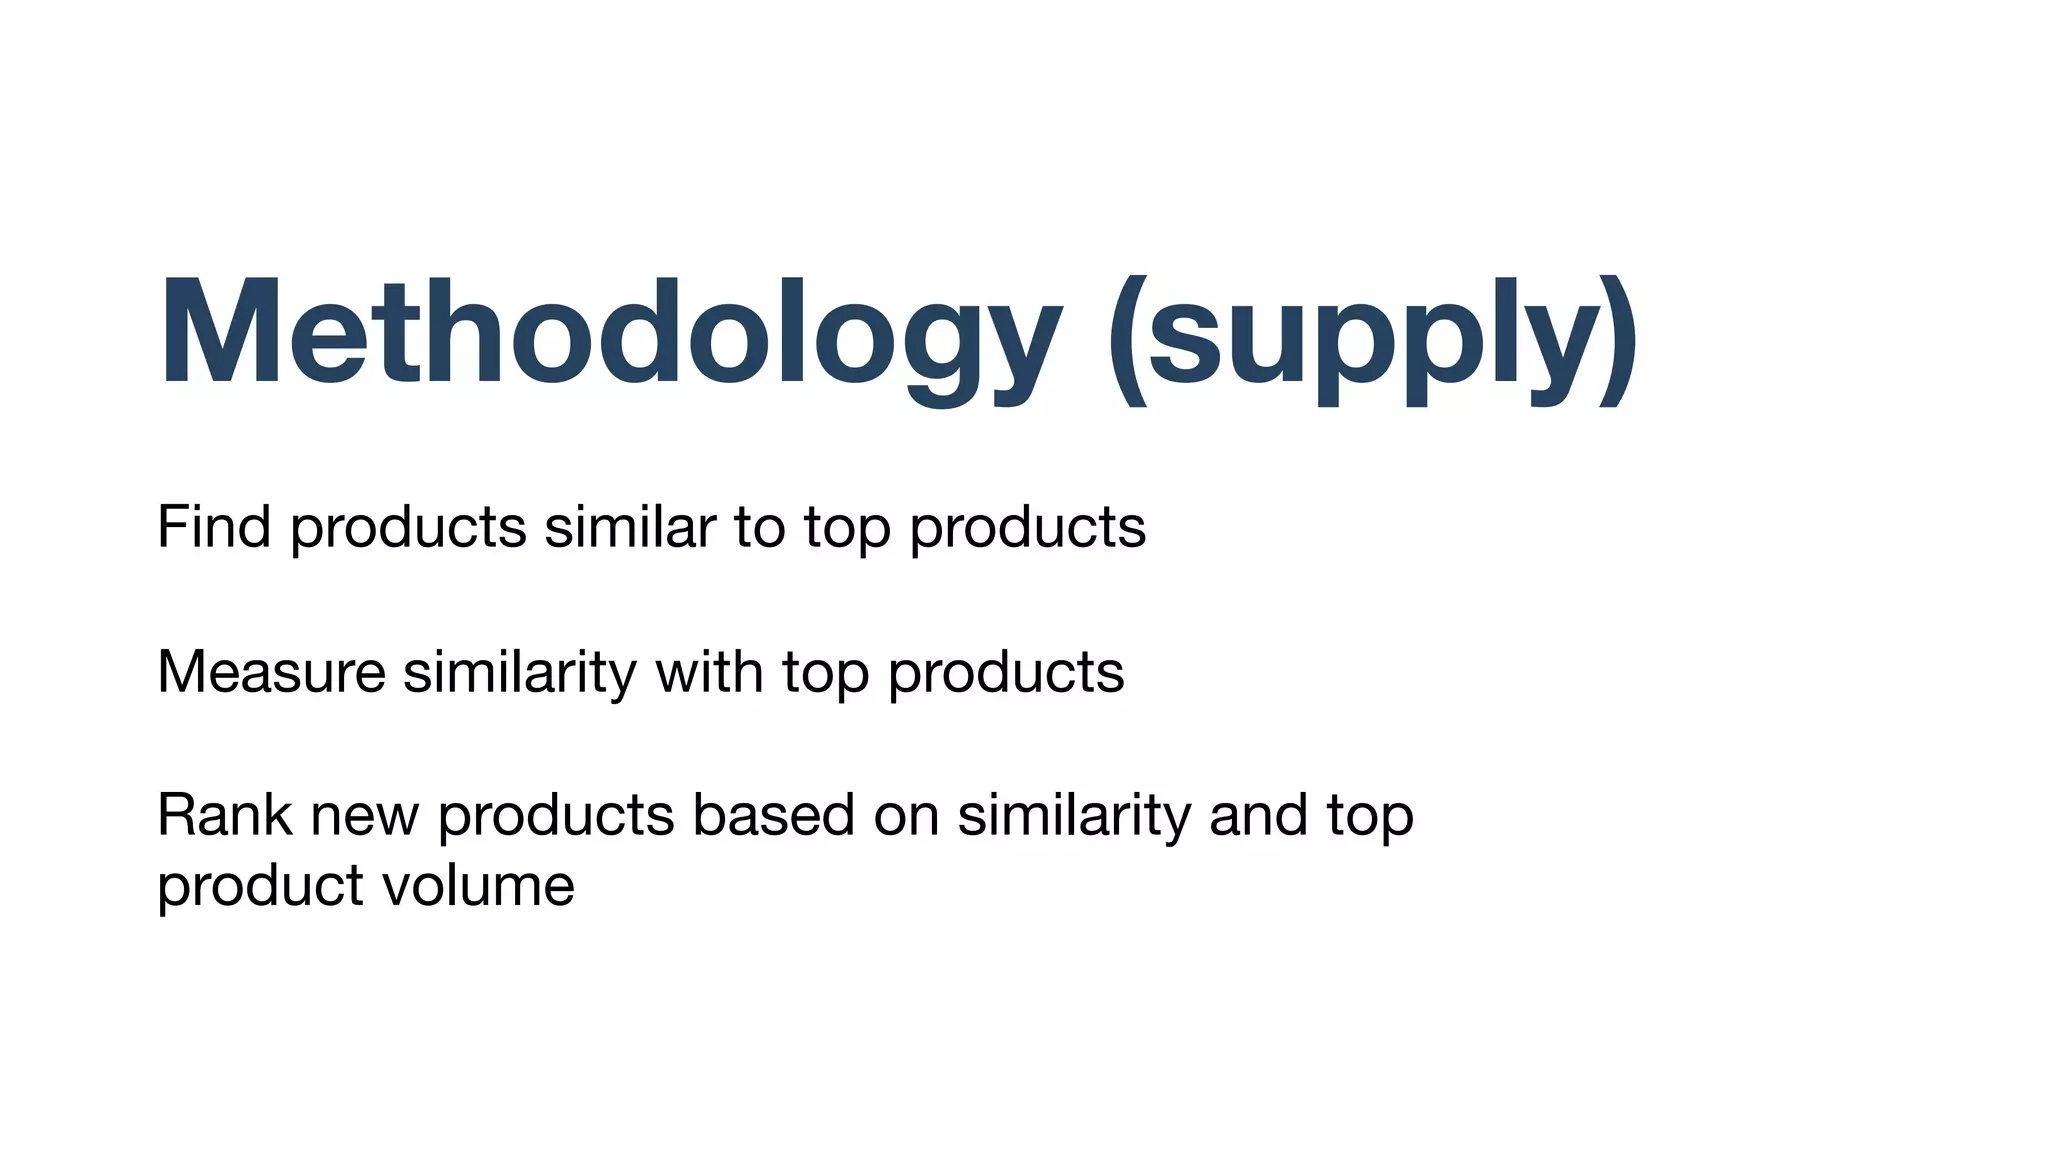

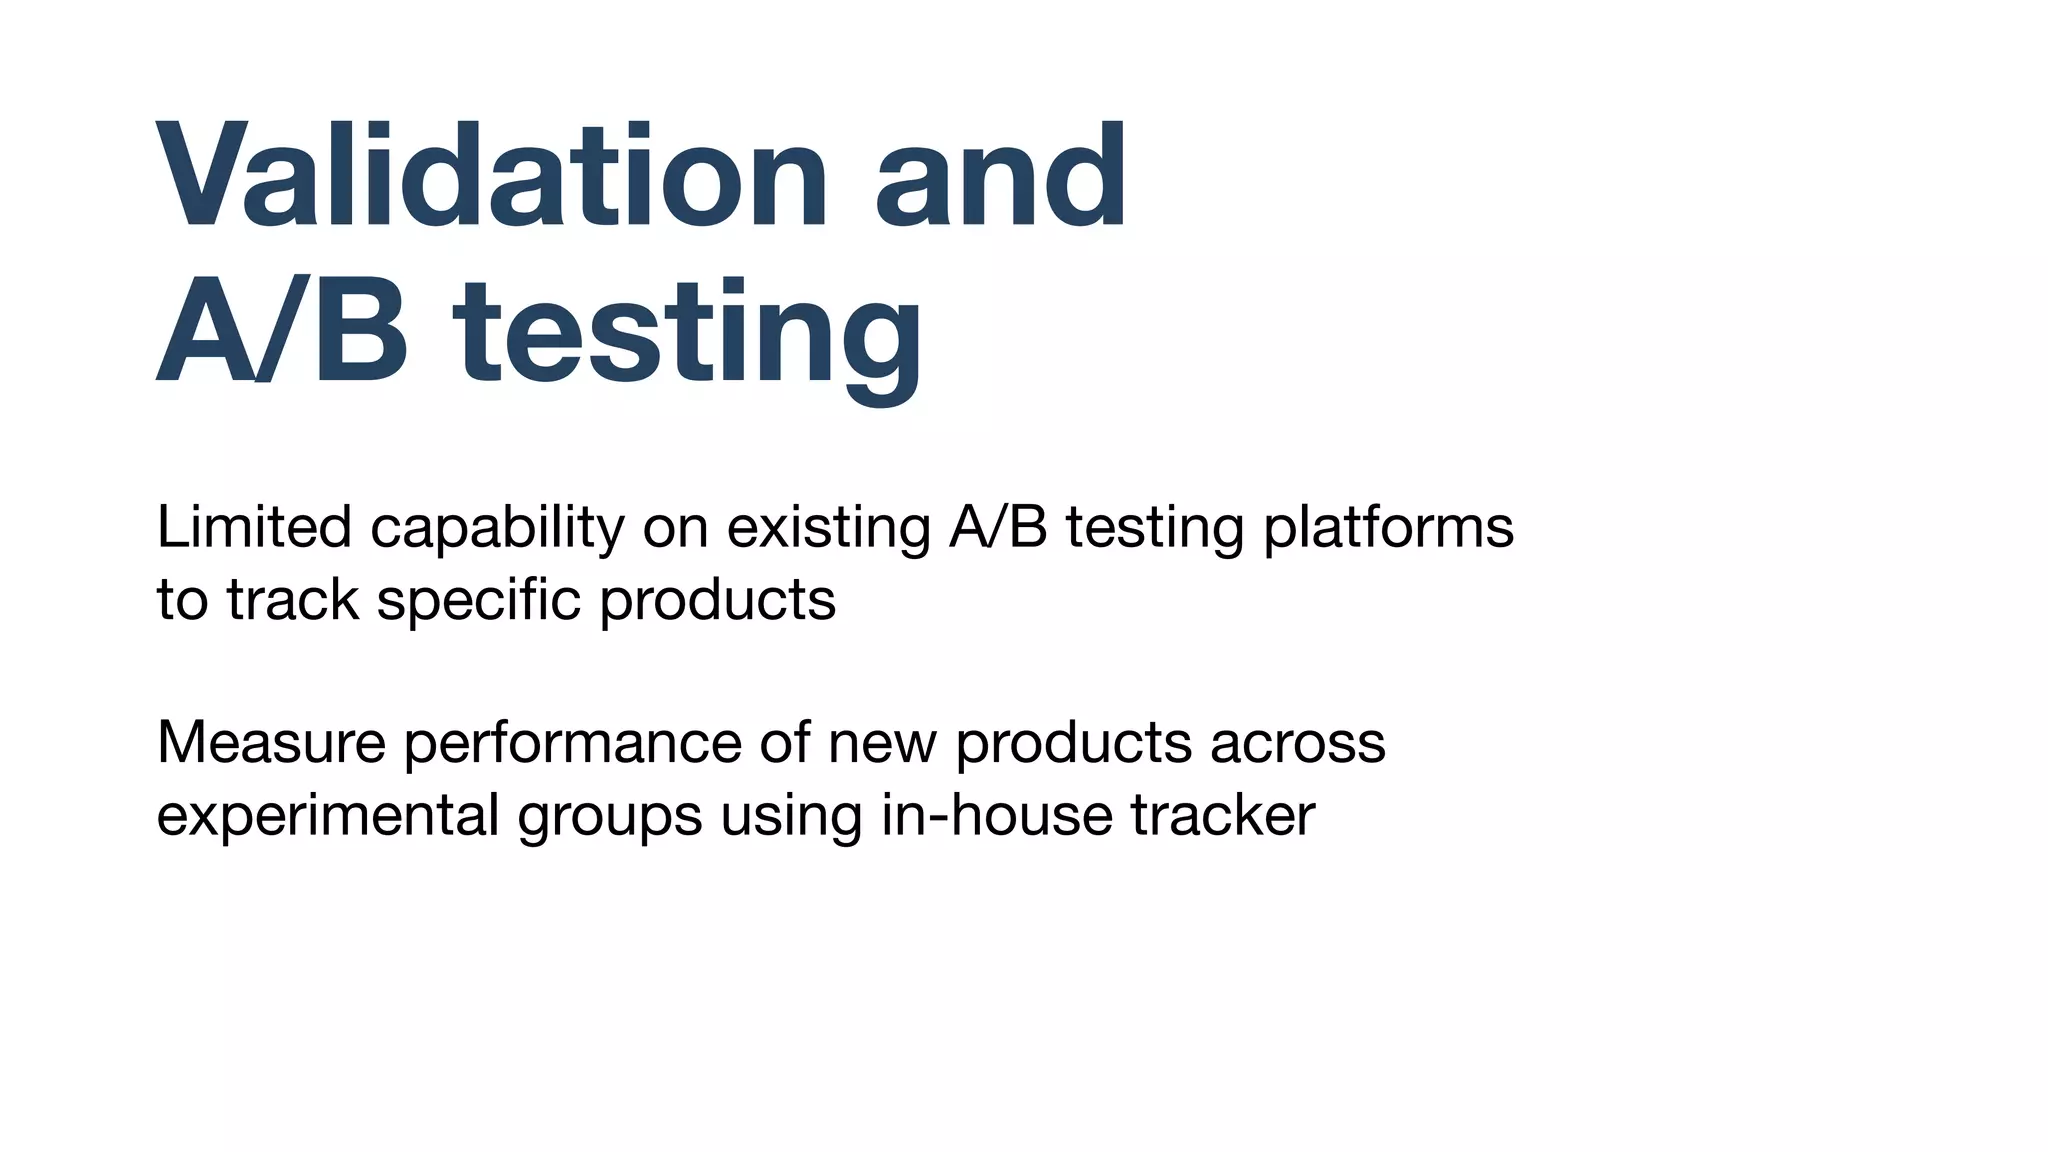
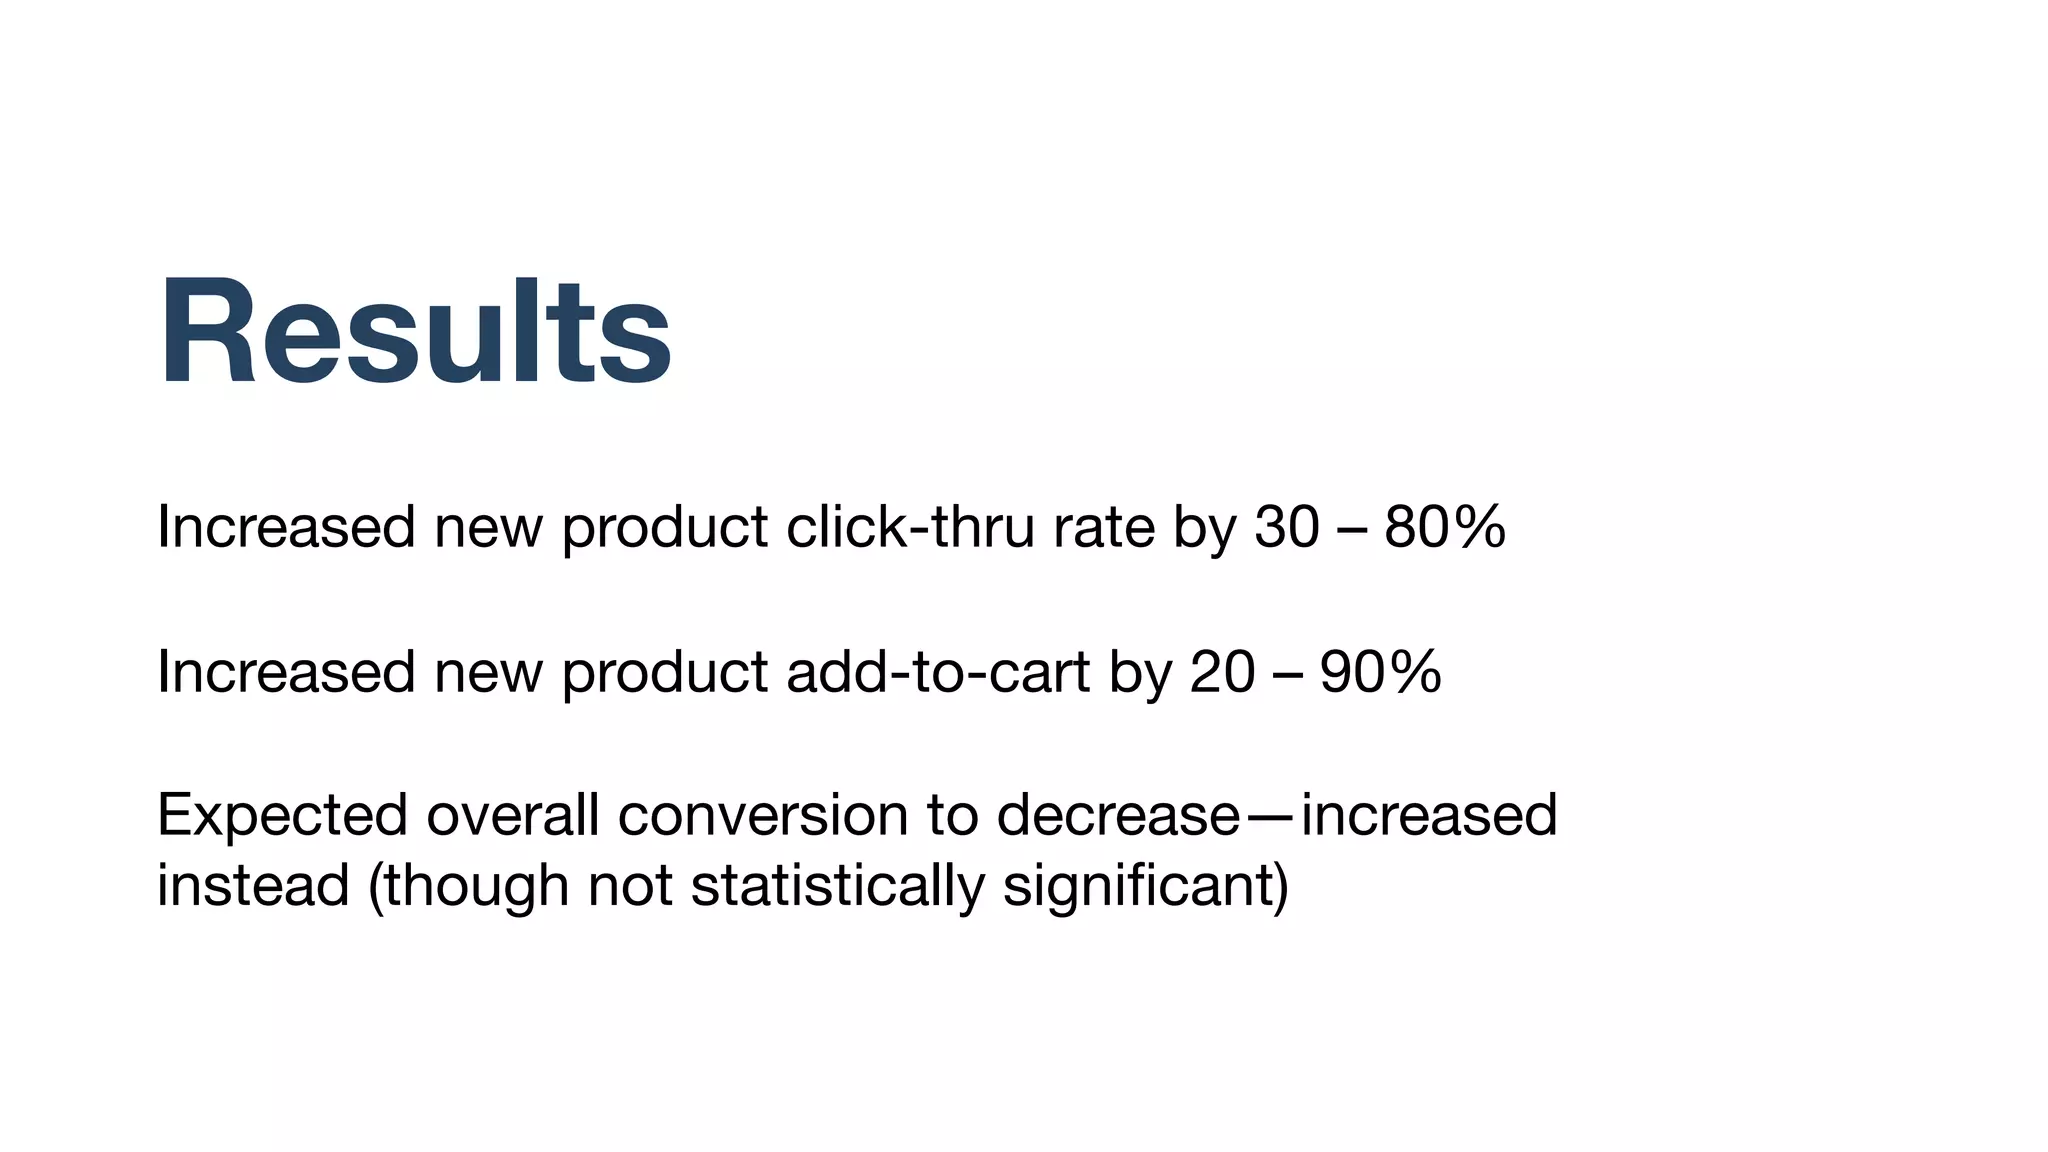

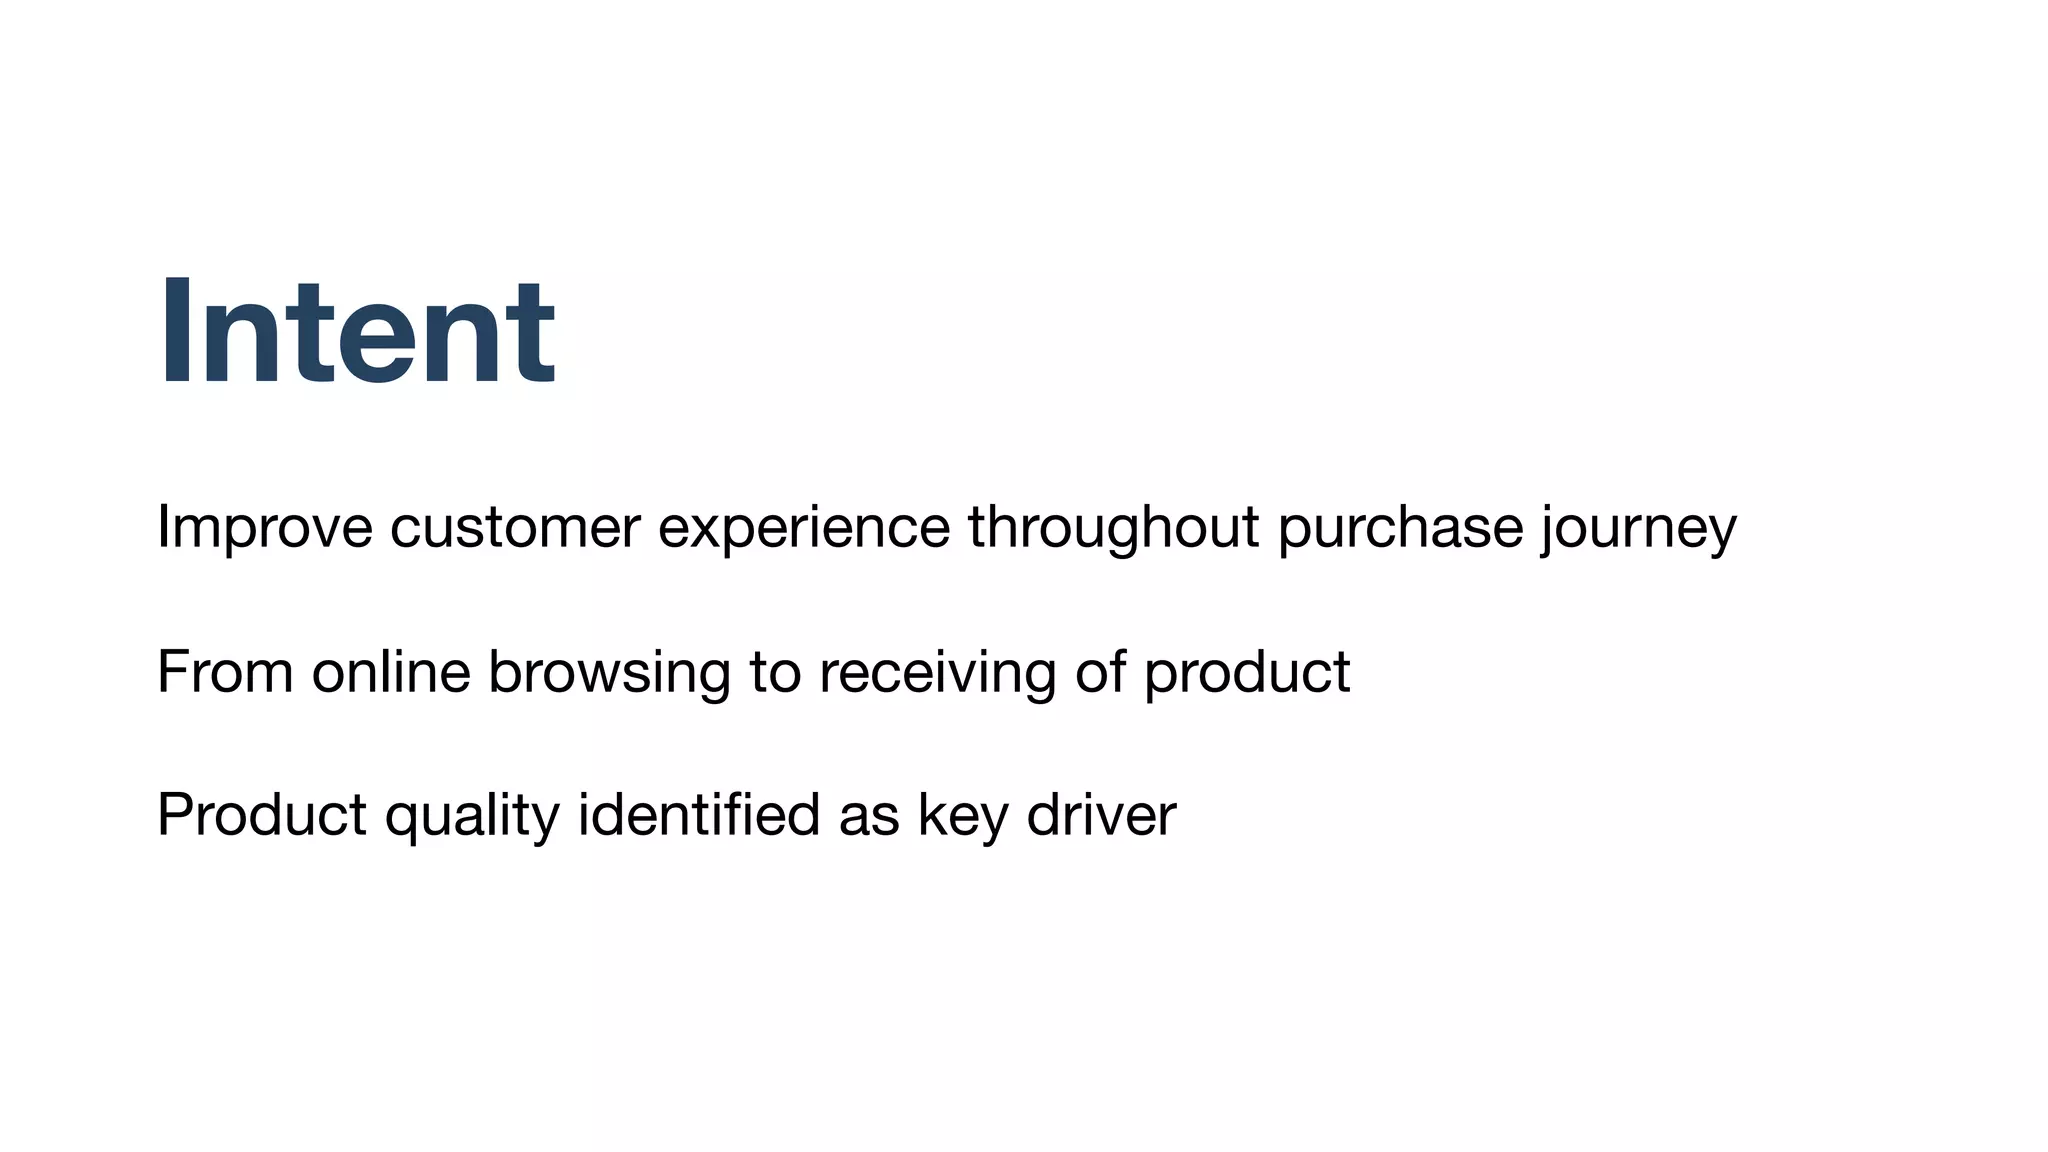
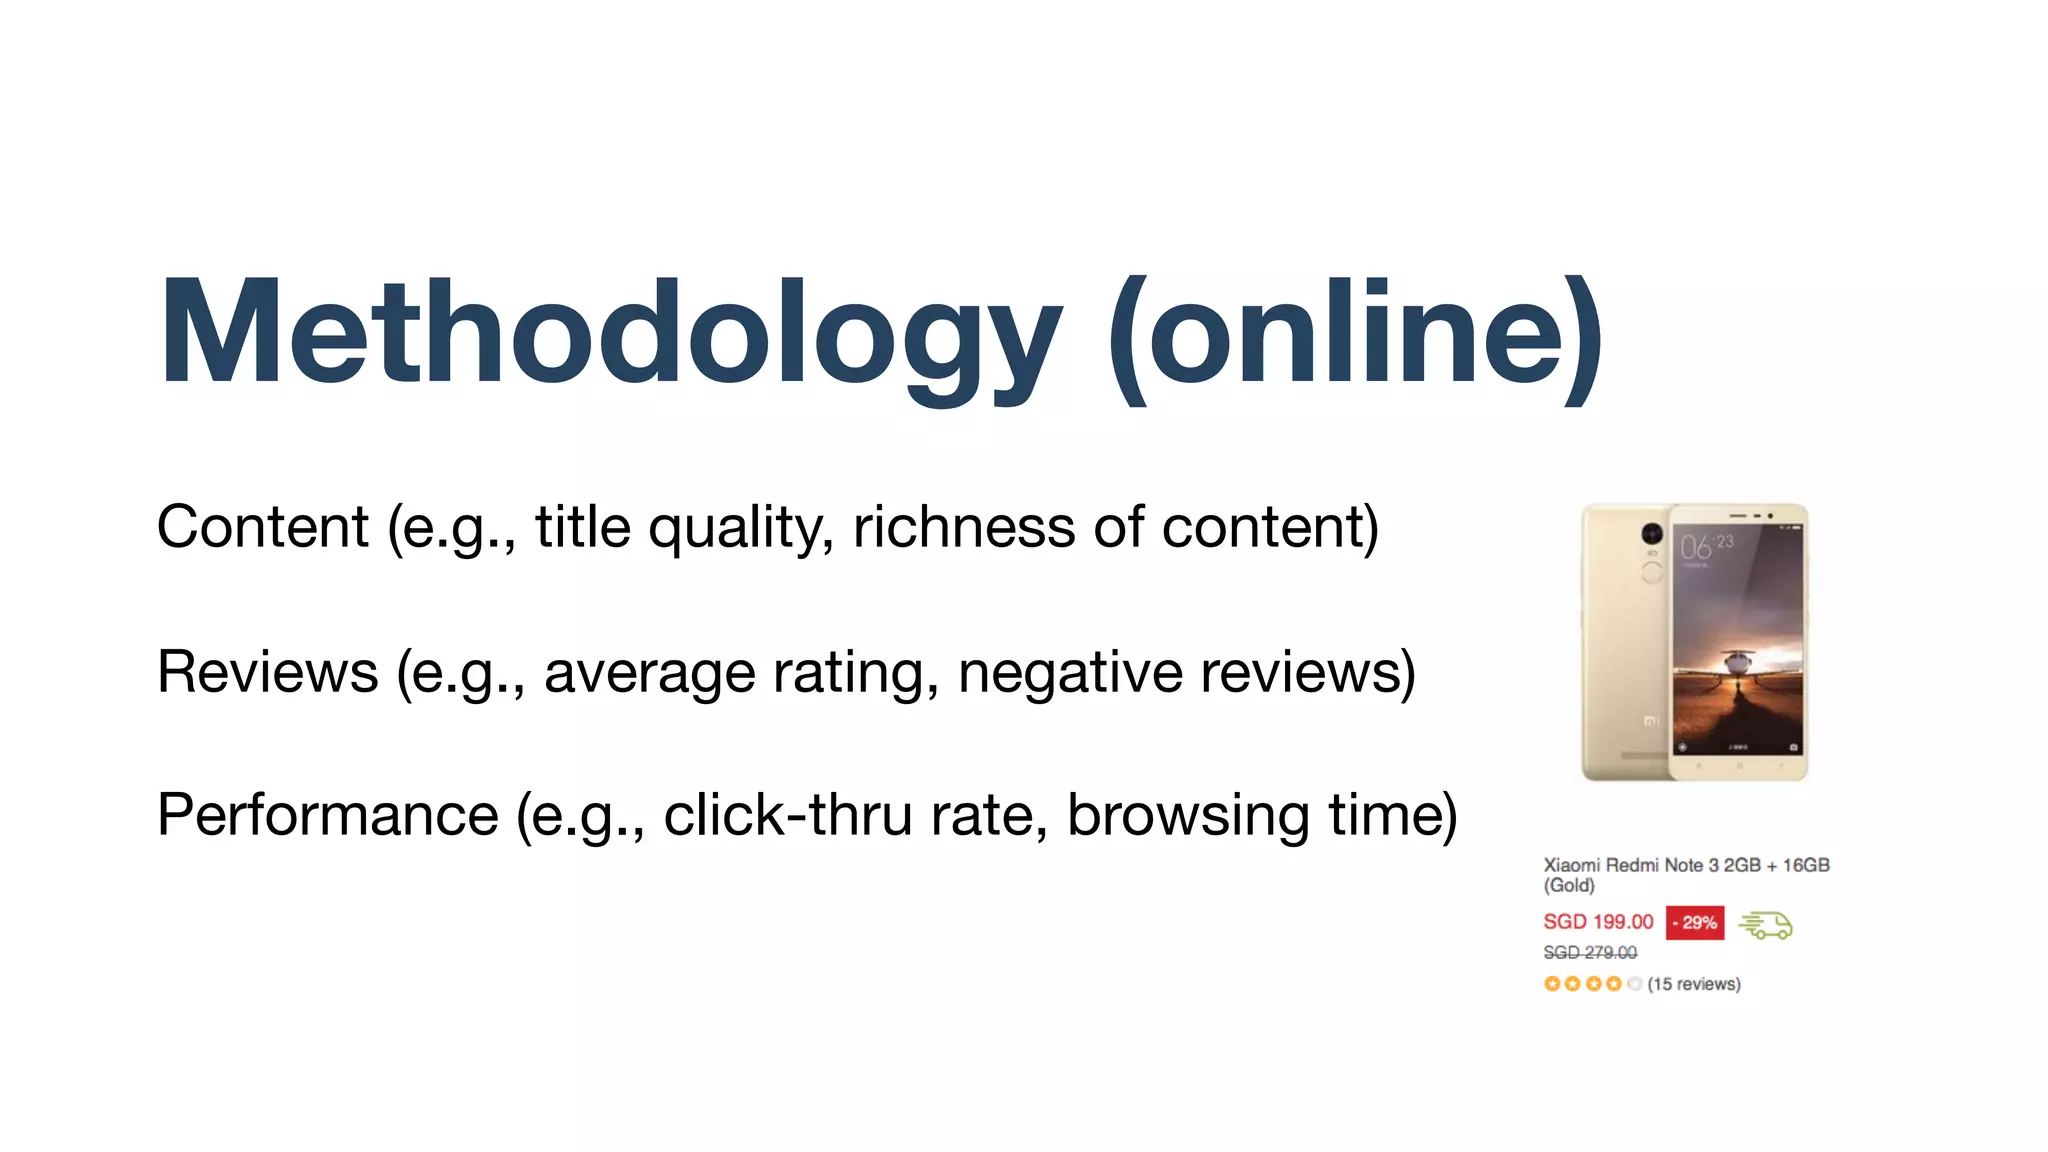
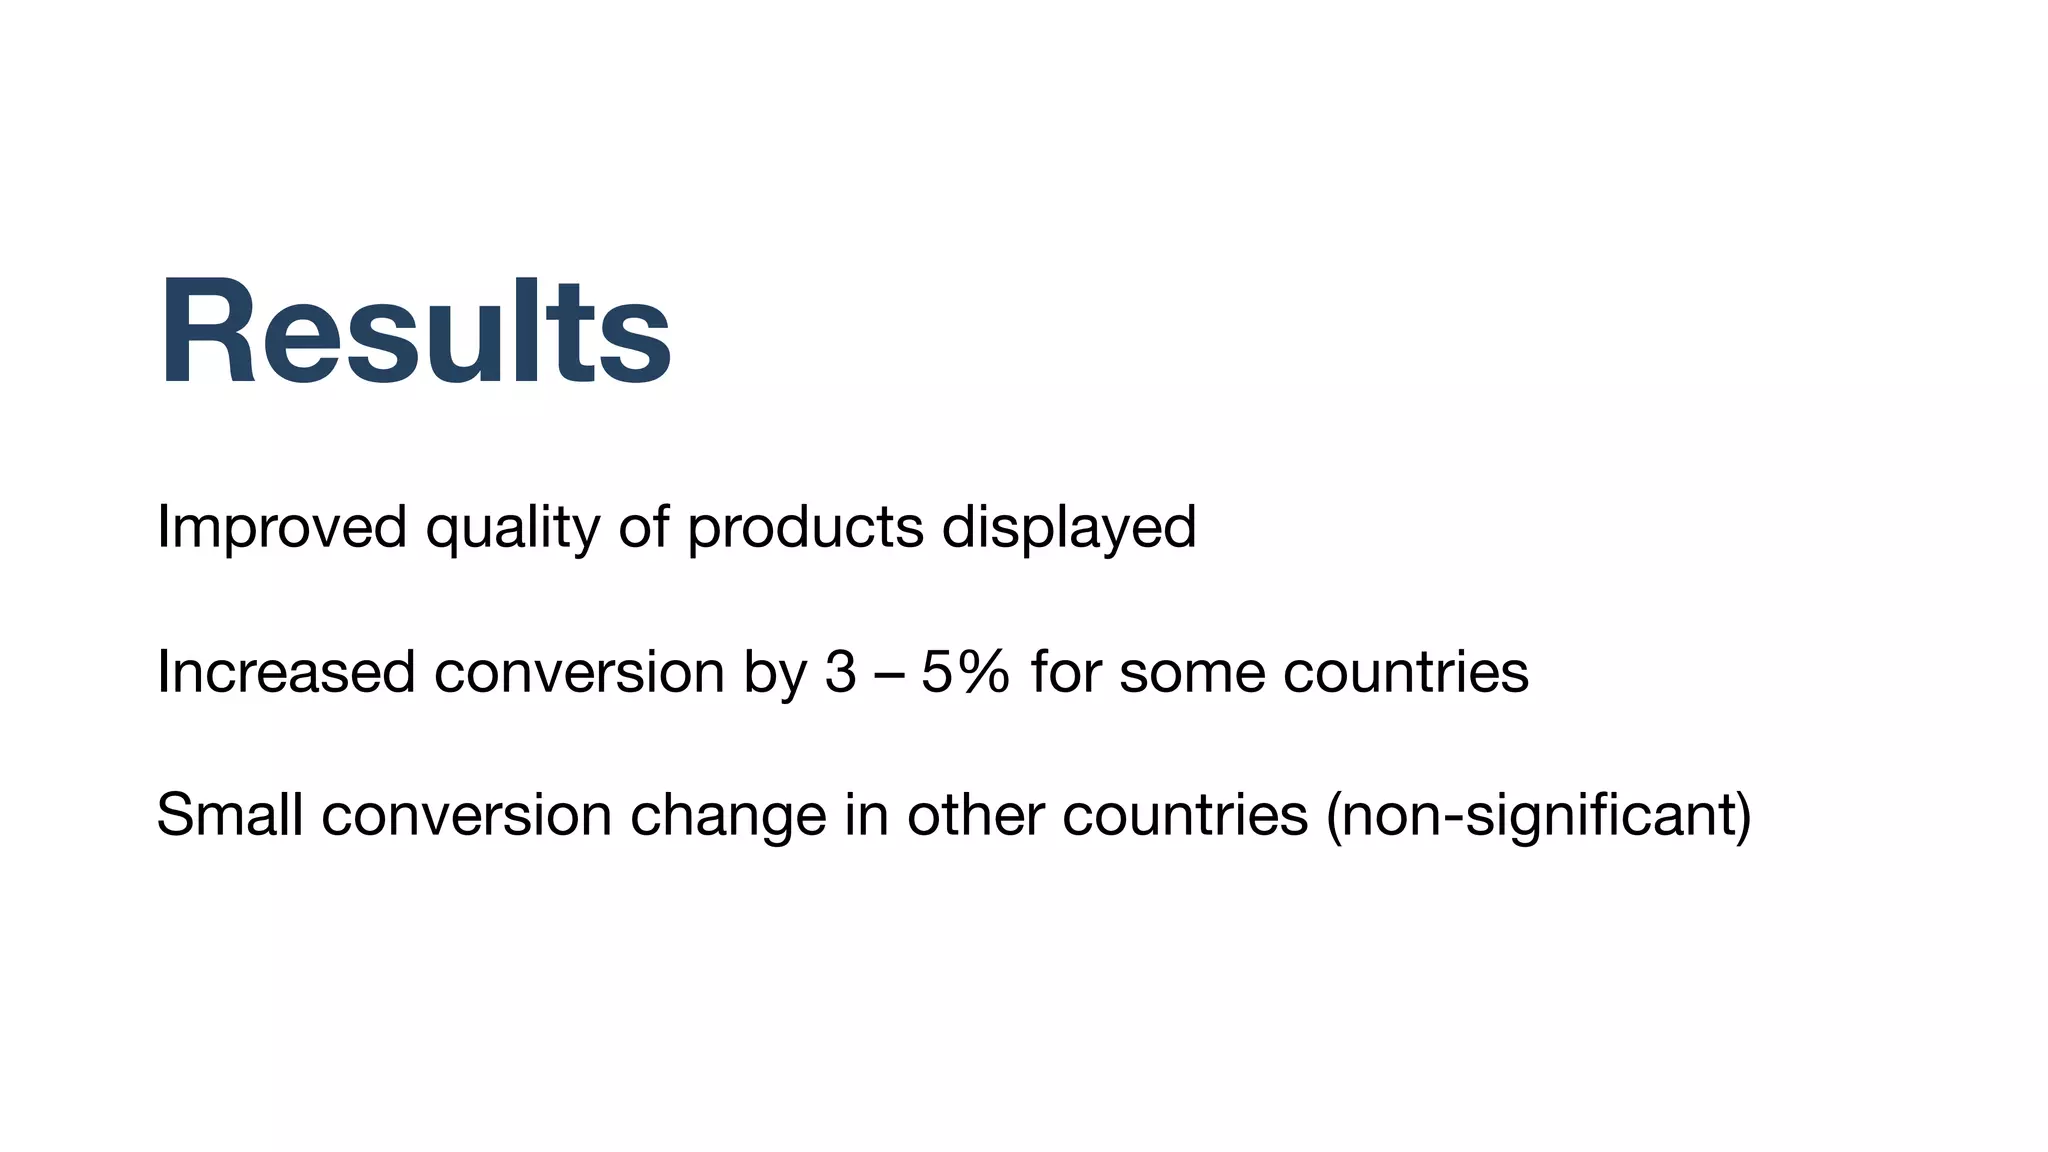
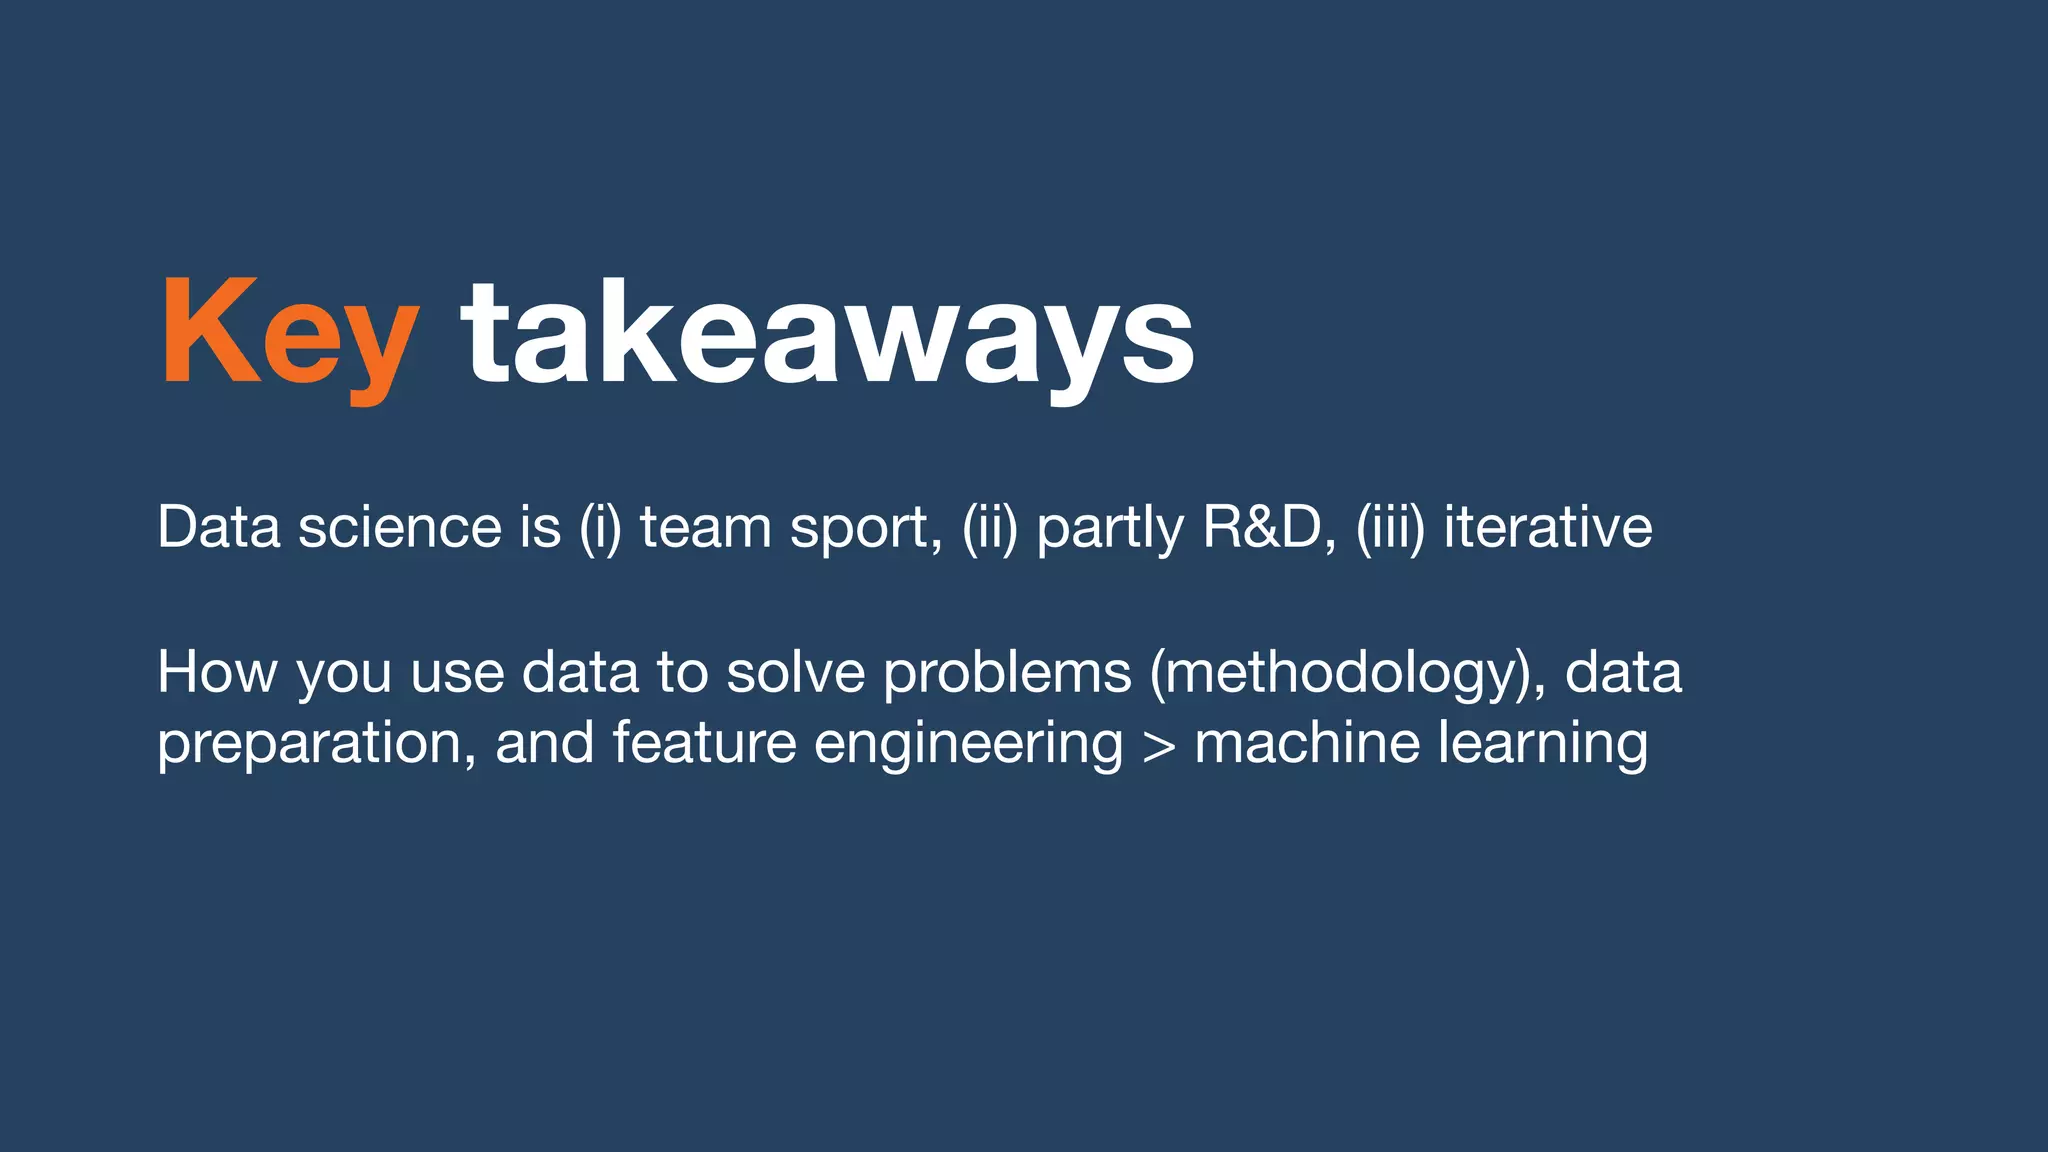


Lazada enhances product rankings to improve customer experience and conversion through data-driven methods that analyze user behavior and product engagement. The document discusses how Lazada employs machine learning and various metrics to identify and boost new and quality products, resulting in increased conversion rates and user engagement. Key methodologies involve measuring shopper interest, product similarity, and quality, alongside testing changes to ensure effective outcomes.


![[DSC Europe 23][AICommerce]Ratko Nikolic Fashion-forward Transforming E-Comme...](https://cdn.slidesharecdn.com/ss_thumbnails/2afkxsqertkstgjolsrp-ratko-nikolic-fashion-forward-transforming-e-commerce-with-ai-based-customer-se-231130105118-bc947e0a-thumbnail.jpg?width=640&height=640&fit=bounds)


![[DSC Europe 25] Ivan Petrovic - Is it really that expensive to build an AI sy...](https://cdn.slidesharecdn.com/ss_thumbnails/ybqhdwvusbg7jms3doxh-9-251216105605-7aab5a10-thumbnail.jpg?width=640&height=640&fit=bounds)


![[DSC Europe 25] Mathias Halkjær Petersen - The AI workforce revolution.pptx](https://cdn.slidesharecdn.com/ss_thumbnails/3xviexv7q5gojhdsyvat-the-ai-workforce-revolution-251218084820-f3c286ed-thumbnail.jpg?width=640&height=640&fit=bounds)
![[DSC Europe 25] Debmalya Biswas - Agentification: the art of transforming man...](https://cdn.slidesharecdn.com/ss_thumbnails/r5azlggvtqiaiiusrqdr-4-251212103249-5a12c89b-thumbnail.jpg?width=640&height=640&fit=bounds)
![[DSC Europe 25] Katherine Forrest - AI NOW: Understanding the Velocity of Cha...](https://cdn.slidesharecdn.com/ss_thumbnails/wvvbruqfrci0sfq9xwgb-4-251212104007-e5ad1987-thumbnail.jpg?width=640&height=640&fit=bounds)
![[DSC Europe 25] Miodrag Pesovic & Vladislav Radonjic - Federated Data Archite...](https://cdn.slidesharecdn.com/ss_thumbnails/gsbe3y5it5uhndi4e08e-1-251212103249-f1008e0c-thumbnail.jpg?width=640&height=640&fit=bounds)

![[DSC Europe 25] Hans Kleinsman - The Compliance Gearbox: How Tax Tech Mediate...](https://cdn.slidesharecdn.com/ss_thumbnails/dxdytie1toel0hr90bjs-2-251212103250-174fdbe7-thumbnail.jpg?width=640&height=640&fit=bounds)
![[DSC Europe 25] Behzad Hosseini - AI Agents in the Wild: Deploying Models tha...](https://cdn.slidesharecdn.com/ss_thumbnails/3qtejajvsjqrzwfept2c-10-251212103250-7f2b1068-thumbnail.jpg?width=640&height=640&fit=bounds)


