Download as PDF, PPTX

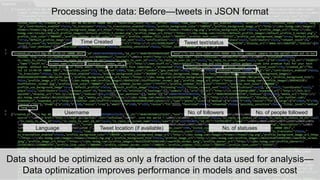
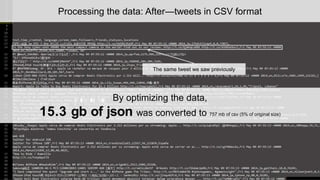
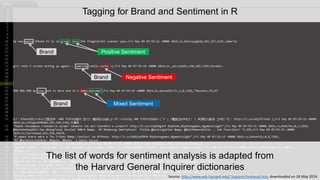
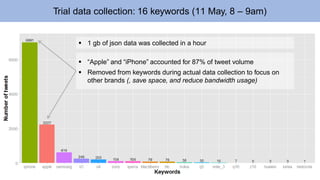
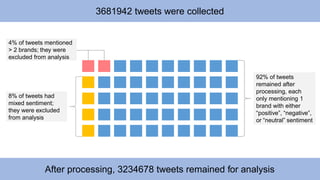
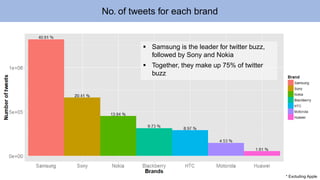
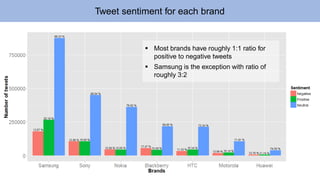


This document summarizes an analysis of Twitter data related to consumer electronic brands collected between May 13-25, 2014. It was found that Apple and iPhone accounted for 87% of tweet volume. The data was optimized by converting 15.3GB of JSON data to 757MB of CSV format. Tweets mentioning seven brands were analyzed for sentiment and found to have roughly equal ratios of positive to negative tweets, except Samsung which had a ratio of roughly 3:2. Spikes in tweet volume coincided with product launches. The analysis revealed differences in users tweeting about different brands as well as opportunities for future analysis.