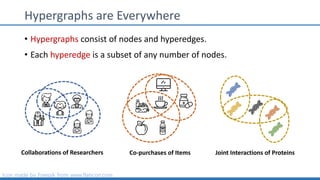
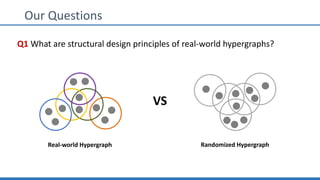
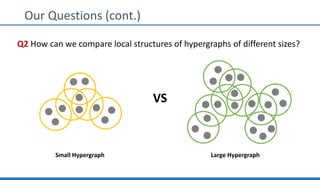
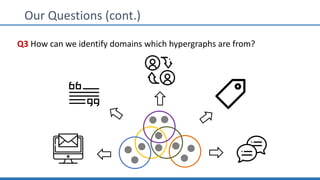
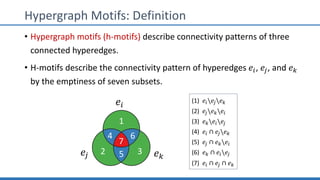
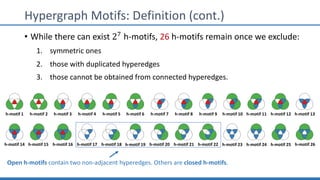
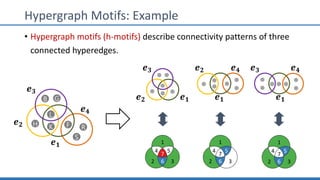
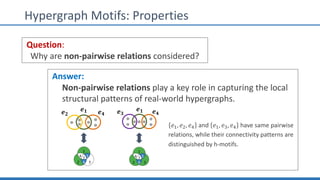
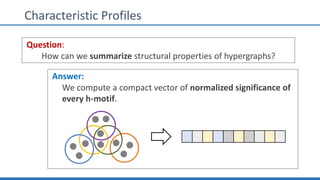
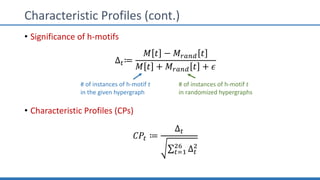
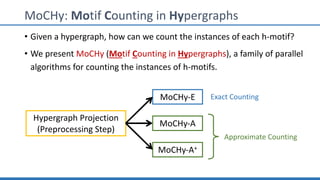
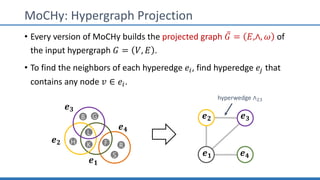
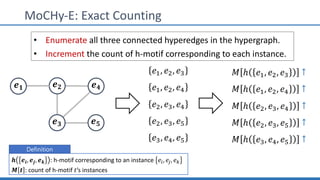
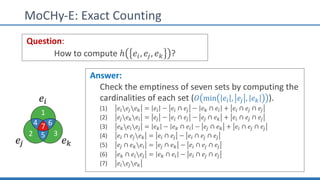
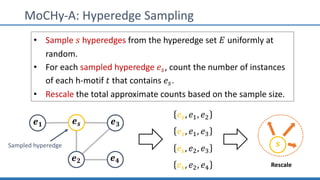
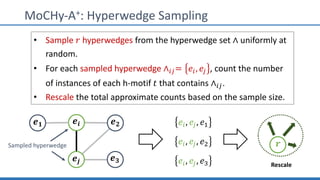
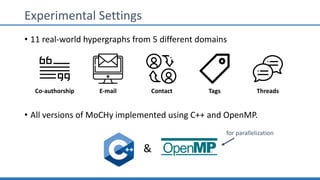
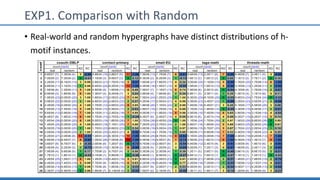
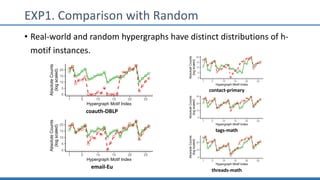
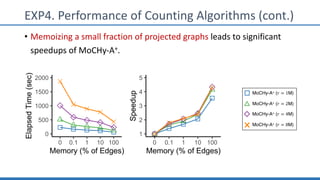
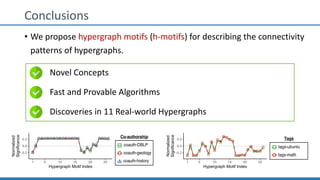
The document discusses hypergraph motifs, which describe connectivity patterns between three connected hyperedges in a hypergraph. It proposes MoCHy, a family of parallel algorithms for counting instances of hypergraph motifs in large hypergraphs. Experimental results on real-world hypergraphs from different domains show that their motif distributions differ significantly from randomized hypergraphs, and MoCHy can efficiently count motifs in large hypergraphs.
"SSumM: Sparse Summarization of Massive Graphs", KDD 2020KyuhanLee4
A presentation slides of Kyuhan Lee, Hyeonsoo Jo, Jihoon Ko, Sungsu Lim, Kijung Shin, "SSumM: Sparse Summarization of Massive Graphs", KDD 2020.
Given a graph G and the desired size k in bits, how can we summarize G within k bits, while minimizing the information loss?
Large-scale graphs have become omnipresent, posing considerable computational challenges. Analyzing such large graphs can be fast and easy if they are compressed sufficiently to fit in main memory or even cache. Graph summarization, which yields a coarse-grained summary graph with merged nodes, stands out with several advantages among graph compression techniques. Thus, a number of algorithms have been developed for obtaining a concise summary graph with little information loss or equivalently small reconstruction error. However, the existing methods focus solely on reducing the number of nodes, and they often yield dense summary graphs, failing to achieve better compression rates. Moreover, due to their limited scalability, they can be applied only to moderate-size graphs.
In this work, we propose SSumM, a scalable and effective graph-summarization algorithm that yields a sparse summary graph. SSumM not only merges nodes together but also sparsifies the summary graph, and the two strategies are carefully balanced based on the minimum description length principle. Compared with state-of-the-art competitors, SSumM is (a) Concise: yields up to 11.2X smaller summary graphs with similar reconstruction error, (b) Accurate: achieves up to 4.2X smaller reconstruction error with similarly concise outputs, and (c) Scalable: summarizes 26X larger graphs while exhibiting linear scalability. We validate these advantages through extensive experiments on 10 real-world graphs.
"Incremental Lossless Graph Summarization", KDD 2020지훈 고
A presentation slides of Jihoon Ko*, Yunbum Kook* and Kijung Shin, "Incremental Lossless Graph Summarization", KDD 2020.
Given a fully dynamic graph, represented as a stream of edge insertions and deletions, how can we obtain and incrementally update a lossless summary of its current snapshot?
As large-scale graphs are prevalent, concisely representing them is inevitable for efficient storage and analysis. Lossless graph summarization is an effective graph-compression technique with many desirable properties. It aims to compactly represent the input graph as (a) a summary graph consisting of supernodes (i.e., sets of nodes) and superedges (i.e., edges between supernodes), which provide a rough description, and (b) edge corrections which fix errors induced by the rough description. While a number of batch algorithms, suited for static graphs, have been developed for rapid and compact graph summarization, they are highly inefficient in terms of time and space for dynamic graphs, which are common in practice.
In this work, we propose MoSSo, the first incremental algorithm for lossless summarization of fully dynamic graphs. In response to each change in the input graph, MoSSo updates the output representation by repeatedly moving nodes among supernodes. MoSSo decides nodes to be moved and their destinations carefully but rapidly based on several novel ideas. Through extensive experiments on 10 real graphs, we show MoSSo is (a) Fast and 'any time': processing each change in near-constant time (less than 0.1 millisecond), up to 7 orders of magnitude faster than running state-of-the-art batch methods, (b) Scalable: summarizing graphs with hundreds of millions of edges, requiring sub-linear memory during the process, and (c) Effective: achieving comparable compression ratios even to state-of-the-art batch methods.
Identification of unknown parameters and prediction of missing values. Compar...Alexander Litvinenko
H-matrix approximation of large Mat\'{e}rn covariance matrices, Gaussian log-likelihoods.
Identifying unknown parameters and making predictions
Comparison with machine learning methods.
kNN is easy to implement and shows promising results.
Hierarchical matrix techniques for maximum likelihood covariance estimationAlexander Litvinenko
1. We apply hierarchical matrix techniques (HLIB, hlibpro) to approximate huge covariance matrices. We are able to work with 250K-350K non-regular grid nodes.
2. We maximize a non-linear, non-convex Gaussian log-likelihood function to identify hyper-parameters of covariance.
Low-rank matrix approximations in Python by Christian Thurau PyData 2014PyData
Low-rank approximations of data matrices have become an important tool in machine learning and data mining. They allow for embedding high dimensional data in lower dimensional spaces and can therefore mitigate effects due to noise, uncover latent relations, or facilitate further processing. These properties have been proven successful in many application areas such as bio-informatics, computer vision, text processing, recommender systems, social network analysis, among others. Present day technologies are characterized by exponentially growing amounts of data. Recent advances in sensor technology, internet applications, and communication networks call for methods that scale to very large and/or growing data matrices. In this talk, we will describe how to efficiently analyze data by means of matrix factorization using the Python Matrix Factorization Toolbox (PyMF) and HDF5. We will briefly cover common methods such as k-means clustering, PCA, or Archetypal Analysis which can be easily cast as a matrix decomposition, and explain their usefulness for everyday data analysis tasks.
Identification of unknown parameters and prediction with hierarchical matrice...Alexander Litvinenko
We compare four numerical methods for the prediction of missing values in four different datasets.
These methods are 1) the hierarchical maximum likelihood estimation (H-MLE), and three machine learning (ML) methods, which include 2) k-nearest neighbors (kNN), 3) random forest, and 4) Deep Neural Network (DNN).
From the ML methods, the best results (for considered datasets) were obtained by the kNN method with three (or seven) neighbors.
On one dataset, the MLE method showed a smaller error than the kNN method, whereas, on another, the kNN method was better.
The MLE method requires a lot of linear algebra computations and works fine on almost all datasets. Its result can be improved by taking a smaller threshold and more accurate hierarchical matrix arithmetics. To our surprise, the well-known kNN method produces similar results as H-MLE and worked much faster.
Machine Learning Tutorial Part - 1 | Machine Learning Tutorial For Beginners ...Simplilearn
This presentation on Machine Learning will help you understand why Machine Learning came into picture, what is Machine Learning, types of Machine Learning, Machine Learning algorithms with a detailed explanation on linear regression, decision tree & support vector machine and at the end you will also see a use case implementation where we classify whether a recipe is of a cupcake or muffin using SVM algorithm. Machine learning is a core sub-area of artificial intelligence; it enables computers to get into a mode of self-learning without being explicitly programmed. When exposed to new data, these computer programs are enabled to learn, grow, change, and develop by themselves. So, to put simply, the iterative aspect of machine learning is the ability to adapt to new data independently. Now, let us get started with this Machine Learning presentation and understand what it is and why it matters.
Below topics are explained in this Machine Learning presentation:
1. Why Machine Learning?
2. What is Machine Learning?
3. Types of Machine Learning
4. Machine Learning Algorithms
- Linear Regression
- Decision Trees
- Support Vector Machine
5. Use case: Classify whether a recipe is of a cupcake or a muffin using SVM
About Simplilearn Machine Learning course:
A form of artificial intelligence, Machine Learning is revolutionizing the world of computing as well as all people’s digital interactions. Machine Learning powers such innovative automated technologies as recommendation engines, facial recognition, fraud protection and even self-driving cars. This Machine Learning course prepares engineers, data scientists and other professionals with knowledge and hands-on skills required for certification and job competency in Machine Learning.
Why learn Machine Learning?
Machine Learning is taking over the world- and with that, there is a growing need among companies for professionals to know the ins and outs of Machine Learning
The Machine Learning market size is expected to grow from USD 1.03 Billion in 2016 to USD 8.81 Billion by 2022, at a Compound Annual Growth Rate (CAGR) of 44.1% during the forecast period.
We recommend this Machine Learning training course for the following professionals in particular:
1. Developers aspiring to be a data scientist or Machine Learning engineer
2. Information architects who want to gain expertise in Machine Learning algorithms
3. Analytics professionals who want to work in Machine Learning or artificial intelligence
4. Graduates looking to build a career in data science and Machine Learning
Learn more at: https://www.simplilearn.com/
a paper review. This presentation introduces Abductive Commonsense Reasoning which is the published paper in ICLR 2020. In this paper, the authors use commonsense to generate plausible hypotheses. They generate new data set 'ART' and propose new models for 'aNLI', 'aNLG' using BERT, and GPT.
A new CPXR Based Logistic Regression Method and Clinical Prognostic Modeling ...Vahid Taslimitehrani
Presented at 15th International Conference on BioInformatics and BioEngineering (BIBE2014)
Prognostic modeling is central to medicine, as it is often used to predict patients’ outcome and response to treatments and to identify important medical risk factors. Logistic regression is one of the most used approaches for clinical pre- diction modeling. Traumatic brain injury (TBI) is an important public health issue and a leading cause of death and disability worldwide. In this study, we adapt CPXR (Contrast Pattern Aided Regression, a recently introduced regression method), to develop a new logistic regression method called CPXR(Log), for general binary outcome prediction (including prognostic modeling), and we use the method to carry out prognostic modeling for TBI using admission time data. The models produced by CPXR(Log) achieved AUC as high as 0.93 and specificity as high as 0.97, much better than those reported by previous studies. Our method produced interpretable prediction models for diverse patient groups for TBI, which show that different kinds of patients should be evaluated differently for TBI outcome prediction and the odds ratios of some predictor variables differ significantly from those given by previous studies; such results can be valuable to physicians.
The slides include a condensed explanation of Transformers and their advantages in compared to CNN and RNN. The presentation begins with a brief explanation of Transformers. Then, the advantages and disadvantages of Transformers relative to CNNs and RNNs are discussed. The attention mechanism is next presented, followed by an illustration of the structure of the document "Attention all you need."
Medical Conferences, Pharma Conferences, Engineering Conferences, Science Conferences, Manufacturing Conferences, Social Science Conferences, Business Conferences, Scientific Conferences Malaysia, Thailand, Singapore, Hong Kong, Dubai, Turkey 2014 2015 2016
Global Research & Development Services (GRDS) is a leading academic event organizer, publishing Open Access Journals and conducting several professionally organized international conferences all over the globe annually. GRDS aims to disseminate knowledge and innovation with the help of its International Conferences and open access publications. GRDS International conferences are world-class events which provide a meaningful platform for researchers, students, academicians, institutions, entrepreneurs, industries and practitioners to create, share and disseminate knowledge and innovation and to develop long-lasting network and collaboration.
GRDS is a blend of Open Access Publications and world-wide International Conferences and Academic events. The prime mission of GRDS is to make continuous efforts in transforming the lives of people around the world through education, application of research and innovative ideas.
Global Research & Development Services (GRDS) is also active in the field of Research Funding, Research Consultancy, Training and Workshops along with International Conferences and Open Access Publications.
International Conferences 2014 – 2015
Malaysia Conferences, Thailand Conferences, Singapore Conferences, Hong Kong Conferences, Dubai Conferences, Turkey Conferences, Conference Listing, Conference Alerts
Graph Summarization with Quality GuaranteesTwo Sigma
Given a large graph, the authors we aim at producing a concise lossy representation (a summary) that can be stored in main memory and used to approximately answer queries about the original graph much faster than by using the exact representation.
Technical presentation of the gesture based NUI I developed for the Aigaio smart conference room in IIT Demokritos
Demo In Greek:
https://www.youtube.com/watch?v=5C_p7MHKA4g
Slides for "Do Deep Generative Models Know What They Don't know?"Julius Hietala
My slides that discuss different deep generative models, mainly normalizing flows for density estimation at a deep learning seminar at Aalto University fall 2019.
Computer Vision: Correlation, Convolution, and GradientAhmed Gad
Three important operations in computer vision are explained starting with each one got explained and implemented in Python.
Generally, all of these three operations have many similarities in as they follow the same general steps but there are some subtle changes. The main change is using different masks.
Symbolic Computation via Gröbner BasisIJERA Editor
The purpose of this paper is to find the orthogonal projection of a rational parametric curve onto a rational parametric surface in 3-space. We show that the orthogonal projection problem can be reduced to the problem of finding elimination ideals via Gröbnerbasis. We provide a computational algorithm to find the orthogonal projection, and include a few illustrative examples. The presented method is effective and potentially useful for many applications related to the design of surfaces and other industrial and research fields.
Adjusting primitives for graph : SHORT REPORT / NOTESSubhajit Sahu
Graph algorithms, like PageRank Compressed Sparse Row (CSR) is an adjacency-list based graph representation that is
Multiply with different modes (map)
1. Performance of sequential execution based vs OpenMP based vector multiply.
2. Comparing various launch configs for CUDA based vector multiply.
Sum with different storage types (reduce)
1. Performance of vector element sum using float vs bfloat16 as the storage type.
Sum with different modes (reduce)
1. Performance of sequential execution based vs OpenMP based vector element sum.
2. Performance of memcpy vs in-place based CUDA based vector element sum.
3. Comparing various launch configs for CUDA based vector element sum (memcpy).
4. Comparing various launch configs for CUDA based vector element sum (in-place).
Sum with in-place strategies of CUDA mode (reduce)
1. Comparing various launch configs for CUDA based vector element sum (in-place).
Data Centers - Striving Within A Narrow Range - Research Report - MCG - May 2...pchutichetpong
M Capital Group (“MCG”) expects to see demand and the changing evolution of supply, facilitated through institutional investment rotation out of offices and into work from home (“WFH”), while the ever-expanding need for data storage as global internet usage expands, with experts predicting 5.3 billion users by 2023. These market factors will be underpinned by technological changes, such as progressing cloud services and edge sites, allowing the industry to see strong expected annual growth of 13% over the next 4 years.
Whilst competitive headwinds remain, represented through the recent second bankruptcy filing of Sungard, which blames “COVID-19 and other macroeconomic trends including delayed customer spending decisions, insourcing and reductions in IT spending, energy inflation and reduction in demand for certain services”, the industry has seen key adjustments, where MCG believes that engineering cost management and technological innovation will be paramount to success.
MCG reports that the more favorable market conditions expected over the next few years, helped by the winding down of pandemic restrictions and a hybrid working environment will be driving market momentum forward. The continuous injection of capital by alternative investment firms, as well as the growing infrastructural investment from cloud service providers and social media companies, whose revenues are expected to grow over 3.6x larger by value in 2026, will likely help propel center provision and innovation. These factors paint a promising picture for the industry players that offset rising input costs and adapt to new technologies.
According to M Capital Group: “Specifically, the long-term cost-saving opportunities available from the rise of remote managing will likely aid value growth for the industry. Through margin optimization and further availability of capital for reinvestment, strong players will maintain their competitive foothold, while weaker players exit the market to balance supply and demand.”
Show drafts
volume_up
Empowering the Data Analytics Ecosystem: A Laser Focus on Value
The data analytics ecosystem thrives when every component functions at its peak, unlocking the true potential of data. Here's a laser focus on key areas for an empowered ecosystem:
1. Democratize Access, Not Data:
Granular Access Controls: Provide users with self-service tools tailored to their specific needs, preventing data overload and misuse.
Data Catalogs: Implement robust data catalogs for easy discovery and understanding of available data sources.
2. Foster Collaboration with Clear Roles:
Data Mesh Architecture: Break down data silos by creating a distributed data ownership model with clear ownership and responsibilities.
Collaborative Workspaces: Utilize interactive platforms where data scientists, analysts, and domain experts can work seamlessly together.
3. Leverage Advanced Analytics Strategically:
AI-powered Automation: Automate repetitive tasks like data cleaning and feature engineering, freeing up data talent for higher-level analysis.
Right-Tool Selection: Strategically choose the most effective advanced analytics techniques (e.g., AI, ML) based on specific business problems.
4. Prioritize Data Quality with Automation:
Automated Data Validation: Implement automated data quality checks to identify and rectify errors at the source, minimizing downstream issues.
Data Lineage Tracking: Track the flow of data throughout the ecosystem, ensuring transparency and facilitating root cause analysis for errors.
5. Cultivate a Data-Driven Mindset:
Metrics-Driven Performance Management: Align KPIs and performance metrics with data-driven insights to ensure actionable decision making.
Data Storytelling Workshops: Equip stakeholders with the skills to translate complex data findings into compelling narratives that drive action.
Benefits of a Precise Ecosystem:
Sharpened Focus: Precise access and clear roles ensure everyone works with the most relevant data, maximizing efficiency.
Actionable Insights: Strategic analytics and automated quality checks lead to more reliable and actionable data insights.
Continuous Improvement: Data-driven performance management fosters a culture of learning and continuous improvement.
Sustainable Growth: Empowered by data, organizations can make informed decisions to drive sustainable growth and innovation.
By focusing on these precise actions, organizations can create an empowered data analytics ecosystem that delivers real value by driving data-driven decisions and maximizing the return on their data investment.
2. Hypergraphs are Everywhere
Icon made by Freepik from www.flaticon.com
Collaborations of Researchers Co-purchases of Items Joint Interactions of Proteins
• Hypergraphs consist of nodes and hyperedges.
• Each hyperedge is a subset of any number of nodes.
3. Our Questions
Q1 What are structural design principles of real-world hypergraphs?
Real-world Hypergraph Randomized Hypergraph
VS
4. Our Questions (cont.)
Q2 How can we compare local structures of hypergraphs of different sizes?
VS
Small Hypergraph Large Hypergraph
10. Hypergraph Motifs: Properties
Exhaustive
H-motifs capture connectivity patterns of all possible three connected
hyperedges.
Unique
Connectivity pattern of any three connected hyperedges is captured
by at most one h-motif.
Size Independent
H-motifs capture connectivity patterns independently of the sizes of
hyperedges.
11. Hypergraph Motifs: Properties
Question:
Why are non-pairwise relations considered?
Answer:
Non-pairwise relations play a key role in capturing the local
structural patterns of real-world hypergraphs.
𝒆 𝟐
𝒆 𝟏 𝒆 𝟒 𝒆 𝟑
𝒆 𝟏 𝒆 𝟒
𝑒), 𝑒*, 𝑒+ and 𝑒), 𝑒,, 𝑒+ have same pairwise
relations, while their connectivity patterns are
distinguished by h-motifs.
12. Characteristic Profiles
Question:
How can we summarize structural properties of hypergraphs?
Answer:
We compute a compact vector of normalized significance of
every h-motif.
13. Characteristic Profiles (cont.)
• Significance of h-motifs
∆0≔
𝑀 𝑡 − 𝑀5678 𝑡
𝑀 𝑡 + 𝑀5678 𝑡 + 𝜖
• Characteristic Profiles (CPs)
𝐶𝑃0 ≔
∆0
∑0>?
@A
∆0
@
# of instances of h-motif 𝑡
in the given hypergraph
# of instances of h-motif 𝑡
in randomized hypergraphs
15. MoCHy: Motif Counting in Hypergraphs
• Given a hypergraph, how can we count the instances of each h-motif?
• We present MoCHy (Motif Counting in Hypergraphs), a family of parallel
algorithms for counting the instances of h-motifs.
Hypergraph Projection
(Preprocessing Step)
MoCHy-A
MoCHy-E
MoCHy-A+
Exact Counting
Approximate Counting
16. MoCHy: Hypergraph Projection
• Every version of MoCHy builds the projected graph ̅𝐺 = 𝐸,∧, 𝜔 of
the input hypergraph 𝐺 = 𝑉, 𝐸 .
• To find the neighbors of each hyperedge 𝑒", find hyperedge 𝑒# that
contains any node 𝑣 ∈ 𝑒".
FH
L
K
B G
S
R
𝒆 𝟏
𝒆 𝟐
𝒆 𝟑
𝒆 𝟒
𝒆 𝟐 𝒆 𝟑
𝒆 𝟏 𝒆 𝟒
hyperwedge ∧*,
17. MoCHy-E: Exact Counting
𝒆 𝟐 𝒆 𝟒
𝒆 𝟑 𝒆 𝟓
𝒆 𝟏
• Enumerate all three connected hyperedges in the hypergraph.
• Increment the count of h-motif corresponding to each instance.
𝑒?, 𝑒@, 𝑒L
𝑒?, 𝑒@, 𝑒M
𝑒@, 𝑒L, 𝑒M
𝑒@, 𝑒L, 𝑒N
𝑒L, 𝑒M, 𝑒N
Definition
𝒉 𝒆𝒊, 𝒆𝒋, 𝒆 𝒌 : h-motif corresponding to an instance 𝑒", 𝑒#, 𝑒$
𝑴 𝒕 : count of h-motif 𝑡’s instances
𝑀 ℎ 𝑒?, 𝑒@, 𝑒L ↑
𝑀 ℎ 𝑒?, 𝑒@, 𝑒M ↑
𝑀 ℎ 𝑒@, 𝑒L, 𝑒M ↑
𝑀 ℎ 𝑒@, 𝑒L, 𝑒N ↑
𝑀 ℎ 𝑒L, 𝑒M, 𝑒N ↑
19. MoCHy-A: Hyperedge Sampling
𝒆 𝒔 𝒆 𝟑
𝒆 𝟐 𝒆 𝟒
𝒆 𝟏
Sampled hyperedge
𝑒U, 𝑒?, 𝑒@
𝑒U, 𝑒?, 𝑒L
𝑒U, 𝑒@, 𝑒L
𝑒U, 𝑒@, 𝑒M
• Sample 𝑠 hyperedges from the hyperedge set 𝐸 uniformly at
random.
• For each sampled hyperedge 𝑒U, count the number of instances
of each h-motif 𝑡 that contains 𝑒U.
• Rescale the total approximate counts based on the sample size.
𝒔
Rescale
20. MoCHy-A+: Hyperwedge Sampling
𝒆𝒊 𝒆 𝟐
𝒆𝒋 𝒆 𝟑
𝒆 𝟏
Sampled hyperwedge
𝑒", 𝑒#, 𝑒?
𝑒", 𝑒#, 𝑒@
𝑒", 𝑒#, 𝑒L
• Sample 𝑟 hyperwedges from the hyperwedge set ∧ uniformly at
random.
• For each sampled hyperwedge ∧"#= 𝑒", 𝑒# , count the number
of instances of each h-motif 𝑡 that contains ∧"#.
• Rescale the total approximate counts based on the sample size.
𝒓
Rescale
22. Experimental Settings
• 11 real-world hypergraphs from 5 different domains
• All versions of MoCHy implemented using C++ and OpenMP.
Co-authorship E-mail Contact Tags Threads
&
for parallelization
28. EXP3. Observations and Applications (cont.)
• Hyperedge prediction: classify real hyperedges and fake ones.
• H-motifs give informative features.
HM26 HM7 HC
Logistic Regression
ACC 0.754 0.656 0.636
AUC 0.813 0.693 0.691
Random Forest
ACC 0.768 0.741 0.639
AUC 0.852 0.779 0.692
Decision Tree
ACC 0.731 0.684 0.613
AUC 0.732 0.685 0.616
K-Nearest Neighbors
ACC 0.694 0.689 0.640
AUC 0.750 0.743 0.684
MLP Classifier
ACC 0.795 0.762 0.646
AUC 0.875 0.841 0.701
ACC: accuracy, AUC: area under the ROC curve
The number of each h-motif’s instances that
contain each hyperedge.
HM26 (∈ ℝ&'
)
The seven features with the largest variance
among those in HM26.
HM7 (∈ ℝ(
)
The mean, maximum, and minimum degree
and the mean, maximum, and minimum
number of neighbors of the nodes in each
hyperedge and its size.
HC (∈ ℝ()
29. EXP4. Performance of Counting Algorithms
• MoCHy-A+ is up to 25X more accurate than MoCHy-A.
• MoCHy-A+ is up to 32.5X faster than MoCHy-E.
26.3X
5.9X
0.00
0.01
0.02
0.03
0.04
0 2 4 6
Elapsed Time (sec)
RelativeError
28.2X
10.2X
0.00
0.01
0.02
0.03
0 20 40 60
Elapsed Time (sec)
RelativeError
11.1X
8.4X
0.00
0.02
0.04
0.06
0.08
0 2 4 6 8 10
Elapsed Time (sec)
RelativeError
32.5X
24.6X
0.00
0.01
0.02
0.03
0.04
0 1000 2000
Elapsed Time (sec)
RelativeError
24.2X
25X
0.00
0.02
0.04
0.06
0 200 400
Elapsed Time (sec)
RelativeError
7.6X
7.6X
0.00
0.05
0.10
0.15
0.0 0.1 0.2
Elapsed Time (sec)
RelativeError
Definition
Relative Error:
∑'()
*+
* + , -* +
∑'()
*+ * +
threads-ubuntu
contact-high email-Enron coauth-history
contact-primary email-Eu
30. EXP4. Performance of Counting Algorithms (cont.)
• CPs obtained by MoCHy-A+ are estimated near perfectly even with a
smaller number of samples.
-0.2
0.0
0.2
1 6 11 16 21 26
Hypergraph Motif Index
Normalized
Significance
-0.2
0.0
0.2
1 6 11 16 21 26
Hypergraph Motif Index
Normalized
Significance
-0.2
0.0
0.2
1 6 11 16 21 26
Hypergraph Motif Index
Normalized
Significance
MoCHy-A+ (! = ∧ ⋅ 0.01)
MoCHy-A+ (! = ∧ ⋅ 0.05)
MoCHy-A+ (! = ∧ ⋅ 0.001)
MoCHy-A+ (! = ∧ ⋅ 0.005)
MoCHy-E
coauth-history
contact-primary
email-Eu
31. EXP4. Performance of Counting Algorithms (cont.)
• Both MoCHy-E and MoCHy-A+ achieve significant speedups with
multiple threads.
0
1000
2000
1 2 3 4 5 6 7 8
Number of Threads
ElapsedTime(sec)
1
2
3
4
5
6
7
8
1 2 3 4 5 6 7 8
Number of Threads
Speedup
MoCHy-A+ (! = 1M)
MoCHy-A+ (! = 2M)
MoCHy-A+ (! = 4M)
MoCHy-A+ (! = 8M)
MoCHy-E
32. MoCHy-A+ (! = 1M)
MoCHy-A+ (! = 2M)
MoCHy-A+ (! = 4M)
MoCHy-A+ (! = 8M)
0
500
1000
1500
2000
0 0.1 1 10 100
Memory (% of Edges)
ElapsedTime(sec)
1
2
3
4
5
0 0.1 1 10 100
Memory (% of Edges)
Speedup
EXP4. Performance of Counting Algorithms (cont.)
• Memoizing a small fraction of projected graphs leads to significant
speedups of MoCHy-A+.