Download as PDF, PPTX

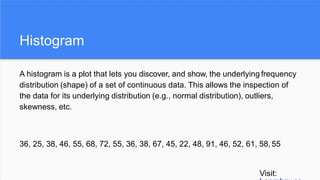
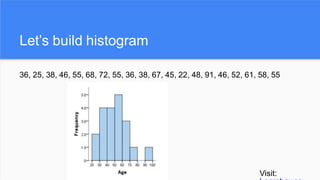


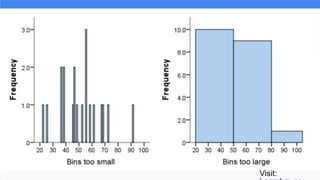


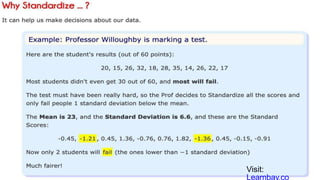

The document provides an overview of histograms and normal distribution, explaining how to plot data using histograms to reveal the underlying frequency distribution. It discusses the importance of bin selection, the relationship between standard deviation and normal distribution, and introduces concepts such as z-scores. Examples and practical problems illustrate these statistical concepts effectively.