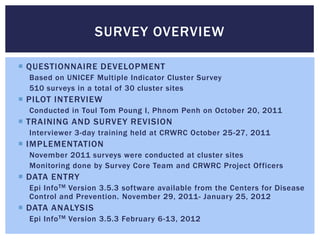
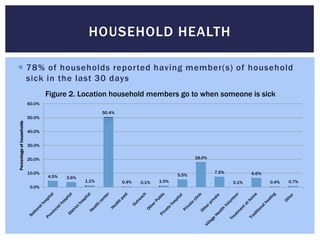
The health survey conducted in Cambodia gathered data from 510 households on topics such as water access, sanitation, household health, maternal health, and child health. Some key findings include:
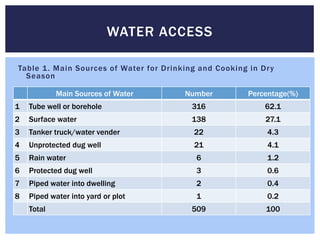
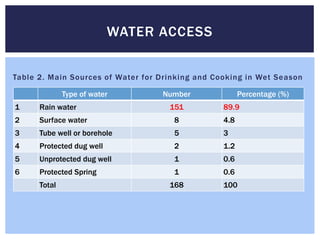
- The majority of households rely on unprotected surface water or open wells as their main water source.
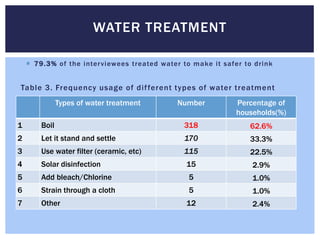
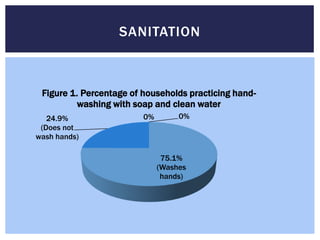
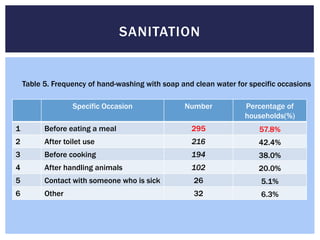
- Most households treat their water by boiling or letting it settle, but sanitation practices like handwashing are still lacking.
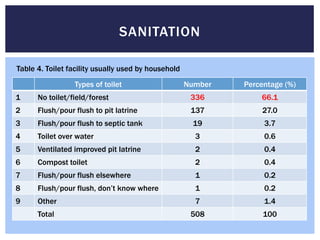
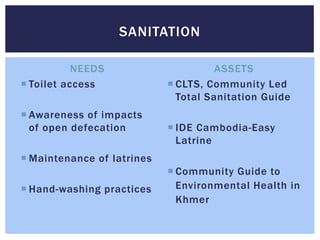
- The majority of households have no toilet facility, with open defecation being common.
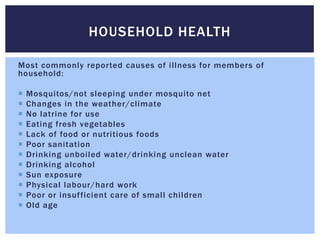
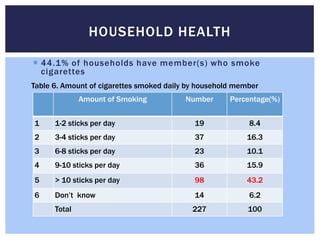
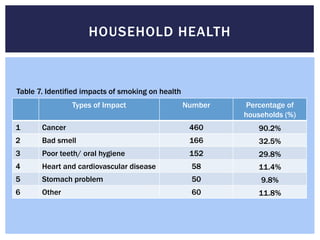
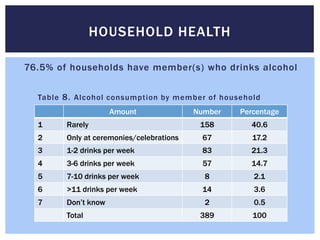
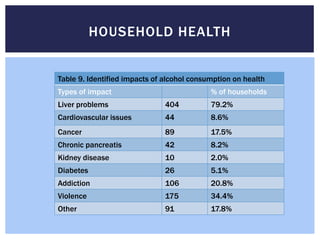
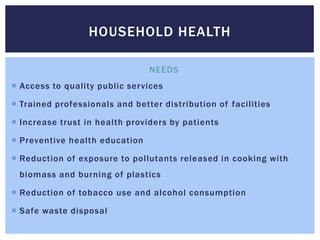
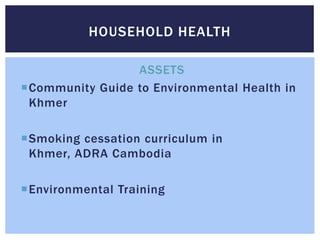
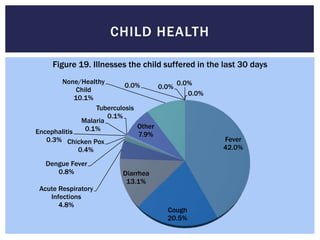
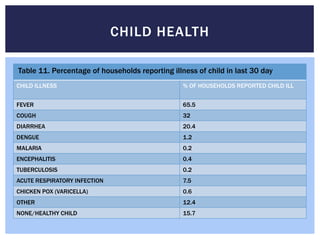
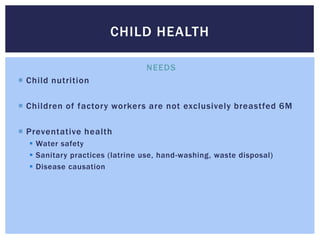
- Common illnesses reported were related to lack of sanitation, nutrition, and mosquitos. Households struggle to access and afford healthcare.
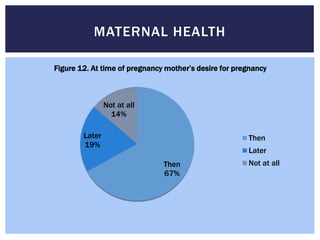
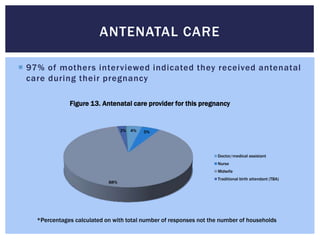
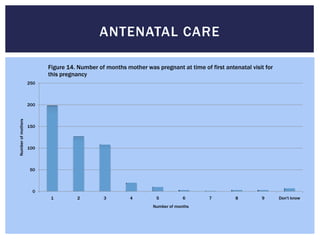
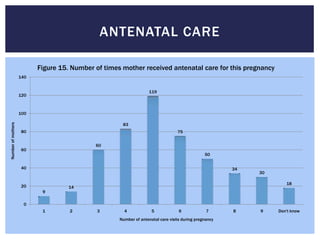
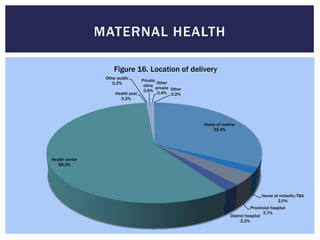
- During pregnancy, most women received some antenatal care, though
Factors Affecting child behavior in Pediatric Dentistry
Health Survey Overview
1. HEALTH REPORT March 2012
CRWRC CAMBODIA
Research by Kimsear Hong and Laurel Koopmans
2. OUTLINE
SURVEY OVERVIEW
WATER AND SANITATION
HOUSEHOLD HEALTH
MATERNAL HEALTH
CHILD HEALTH
PROGRAM PRIORITIES
CONCLUSION
3. SURVEY OVERVIEW
QUESTIONNAIRE DEVELOPMENT
Based on UNICEF Multiple Indicator Cluster Survey
510 surveys in a total of 30 cluster sites
PILOT INTERVIEW
Conducted in Toul Tom Poung I, Phnom Penh on October 20, 2011
TRAINING AND SURVEY REVISION
Interviewer 3-day training held at CRWRC October 25-27, 2011
IMPLEMENTATION
November 2011 surveys were conducted at cluster sites
Monitoring done by Survey Core Team and CRWRC Project Officers
DATA ENTRY
Epi Info TM Version 3.5.3 software available from the Centers for Disease
Control and Prevention. November 29, 2011- January 25, 2012
DATA ANALYSIS
Epi Info TM Version 3.5.3 February 6-13, 2012
4. CRWRC
Cambodia
PRELIMINARY FINDINGS Health
Survey
5. WATER ACCESS
Table 1 . Main Sources of Water for Drinking and Cooking in Dr y
Season
Main Sources of Water Number Percentage(%)
1 Tube well or borehole 316 62.1
2 Surface water 138 27.1
3 Tanker truck/water vender 22 4.3
4 Unprotected dug well 21 4.1
5 Rain water 6 1.2
6 Protected dug well 3 0.6
7 Piped water into dwelling 2 0.4
8 Piped water into yard or plot 1 0.2
Total 509 100
6. WATER ACCESS
Table 2. Main Sources of Water for Drinking and Cooking in Wet Season
Type of water Number Percentage (%)
1 Rain water 151 89.9
2 Surface water 8 4.8
3 Tube well or borehole 5 3
4 Protected dug well 2 1.2
5 Unprotected dug well 1 0.6
6 Protected Spring 1 0.6
Total 168 100
7. WATER TREATMENT
79.3% of the inter viewees treated water to make it safer to drink
Table 3. Frequency usage of dif ferent types of water treatment
Types of water treatment Number Percentage of
households(%)
1 Boil 318 62.6%
2 Let it stand and settle 170 33.3%
3 Use water filter (ceramic, etc) 115 22.5%
4 Solar disinfection 15 2.9%
5 Add bleach/Chlorine 5 1.0%
6 Strain through a cloth 5 1.0%
7 Other 12 2.4%
8. WATER ACCESS
NEEDS ASSE T S
Water testing and quality RDI, Resource Development
International
Water treatment
CAWST, Centre for Af fordable
Water and Sanitation
Well protection and Technology
maintenance
RainWater Cambodia
Alternative water sources
Water for Cambodia
Water conservation
Community Guide to
Environmental Health in
Water safety awareness Khmer
IDE Cambodia
9. SANITATION
Table 4. Toilet facility usually used by household
Types of toilet Number Percentage (%)
1 No toilet/field/forest 336 66.1
2 Flush/pour flush to pit latrine 137 27.0
3 Flush/pour flush to septic tank 19 3.7
4 Toilet over water 3 0.6
5 Ventilated improved pit latrine 2 0.4
6 Compost toilet 2 0.4
7 Flush/pour flush elsewhere 1 0.2
8 Flush/pour flush, don’t know where 1 0.2
9 Other 7 1.4
Total 508 100
10. SANITATION
Figure 1. Percentage of households practicing hand-
washing with soap and clean water
24.9% 0% 0%
(Does not
wash hands)
75.1%
(Washes
hands)
11. SANITATION
Table 5. Frequency of hand-washing with soap and clean water for specific occasions
Specific Occasion Number Percentage of
households(%)
1 Before eating a meal 295 57.8%
2 After toilet use 216 42.4%
3 Before cooking 194 38.0%
4 After handling animals 102 20.0%
5 Contact with someone who is sick 26 5.1%
6 Other 32 6.3%
12. SANITATION
NEEDS ASSETS
Toilet access CLTS, Community Led
Total Sanitation Guide
Awareness of impacts
of open defecation IDE Cambodia-Easy
Latrine
Maintenance of latrines
Community Guide to
Hand-washing practices Environmental Health in
Khmer
13. ANIMAL CARE
NEEDS ASSETS
Animal waste
management Community veterinarians
Increased knowledge of Some partners have done
animal diseases and basic animal
prevention raising, KADRA
Animal raising education
Capacity of veterinarians
living in target
communities
14. HOUSEHOLD HEALTH
78% of households reported having member(s) of household
sick in the last 30 days
Figure 2. Location household members go to when someone is sick
60.0%
50.4%
50.0%
Percentage of households
40.0%
30.0%
20.0% 18.0%
10.0% 7.5% 6.6%
4.5% 5.5%
3.6%
1.1% 0.4% 0.1% 1.0% 0.1% 0.4% 0.7%
0.0%
15. HOUSEHOLD HEALTH
Most commonly reported causes of illness for members of
household:
Mosquitos/not sleeping under mosquito net
Changes in the weather/climate
No latrine for use
Eating fresh vegetables
Lack of food or nutritious foods
Poor sanitation
Drinking unboiled water/drinking unclean water
Drinking alcohol
Sun exposure
Physical labour/hard work
Poor or insufficient care of small children
Old age
16. HOUSEHOLD HEALTH
Figure 3. Distance to accessed health service
Don't know
More than 20 km
Between 10-20km
Between 5-10km
Between 2-5km
Between 1-2 km
1 km or less
0.0% 5.0% 10.0% 15.0% 20.0% 25.0%
Percentage of households
17. HOUSEHOLD HEALTH
Figure 4. Fees paid on last visit to treatment location.
Don't know
Greater than 40 USD
Between 10-40USD
Between 6-10USD
Between 3-6 USD
Between 1-3 USD
1 USD or less
Free
0.0% 5.0% 10.0% 15.0% 20.0% 25.0%
18. HOUSEHOLD HEALTH
Figure 5. Source of funds households use to pay for treatment.
Other
9% Sell animal
23%
Savings/savings Sell land
group 0%
27%
Borrow from Borrow from Sell personal
neighbor relatives property
12% 19% 10%
19. HOUSEHOLD HEALTH
44.1% of households have member(s) who smoke
cigarettes
Table 6. Amount of cigarettes smoked daily by household member
Amount of Smoking Number Percentage(%)
1 1-2 sticks per day 19 8.4
2 3-4 sticks per day 37 16.3
3 6-8 sticks per day 23 10.1
4 9-10 sticks per day 36 15.9
5 > 10 sticks per day 98 43.2
6 Don’t know 14 6.2
Total 227 100
20. HOUSEHOLD HEALTH
Table 7. Identified impacts of smoking on health
Types of Impact Number Percentage of
households (%)
1 Cancer 460 90.2%
2 Bad smell 166 32.5%
3 Poor teeth/ oral hygiene 152 29.8%
4 Heart and cardiovascular disease 58 11.4%
5 Stomach problem 50 9.8%
6 Other 60 11.8%
21. HOUSEHOLD HEALTH
76.5% of households have member(s) who drinks alcohol
Table 8. Alcohol consumption by member of household
Amount Number Percentage
1 Rarely 158 40.6
2 Only at ceremonies/celebrations 67 17.2
3 1-2 drinks per week 83 21.3
4 3-6 drinks per week 57 14.7
5 7-10 drinks per week 8 2.1
6 >11 drinks per week 14 3.6
7 Don’t know 2 0.5
Total 389 100
22. HOUSEHOLD HEALTH
Table 9. Identified impacts of alcohol consumption on health
Types of impact % of households
Liver problems 404 79.2%
Cardiovascular issues 44 8.6%
Cancer 89 17.5%
Chronic pancreatis 42 8.2%
Kidney disease 10 2.0%
Diabetes 26 5.1%
Addiction 106 20.8%
Violence 175 34.4%
Other 91 17.8%
23. HOUSEHOLD NUTRITION
Figure 6. Household Diet During Dry Season
1200
Fermented cheese
1000
Eggs
800
Beans
600
Fruit
(mango, pineapple, etc)
400
Other vegetables
200
Green leafy vegetables
0
Everyday 3-6 times a week 1-2 times a week Rarely Never
Frequency of Food Consumed
24. HOUSEHOLD NUTRITION
Figure 7. Household Diet During Wet Season
1200
Fermented cheese
1000
Eggs
800
Beans
600
Fruit
(mango, pineapple, etc)
400
Other vegetables
200
Green leafy vegetables
0
Everyday 3-6 times a week 1-2 times a week Rarely Never
Frequency of Food Consumed
25. HOUSEHOLD HEALTH
NEEDS
Access to quality public services
Trained professionals and better distribution of facilities
Increase trust in health providers by patients
Preventive health education
Reduction of exposure to pollutants released in cooking with
biomass and burning of plastics
Reduction of tobacco use and alcohol consumption
Safe waste disposal
26. HOUSEHOLD HEALTH
ASSETS
Community Guide to Environmental Health in
Khmer
Smoking cessation curriculum in
Khmer, ADRA Cambodia
Environmental Training
27. FOOD SECURIT Y
Figure 8. Household has worried food would run out before there
was money to buy more
Sales, 0
Never
3%
Often
Sometimes Sometimes
36.6% Often Never
60.4%
28. FOOD SECURIT Y
Figure 9. Household relied on only a few kinds of low-cost food to
feed household because of lack of food or money to buy food.
0%
Often
10%
Never
38% Often
Sometimes
Sometimes Never
52%
29. FOOD SECURIT Y
Figure 10. In the last 12 months, the household cut size of meals or
skipped meals because there wasn't enough money for food.
0%
Often
10%
Never
38% Often
Sometimes
Sometimes Never
52%
30. FOOD SECURIT Y
Figure 11. Number of meals household ate the day prior
to the interview
2.2% 0.2%
40.9%
1 meal
56.7% 2 meals
3 meals
4 meals
(Median number of meals 3)
31. FOOD SECURIT Y
NEEDS ASSETS
Funding opportunities
Rice production
Partner Project, Farmer
Nutrient intake Field Schools
Increase in household Food Resource Bank
gardens
On-going agricultural
Income generation training, SRI
Existing income
generation projects
32. MATERNAL HEALTH
Figure 12. At time of pregnancy mother’s desire for pregnancy
Not at all
14%
Later Then
19%
Later
Then Not at all
67%
33. ANTENATAL CARE
97% of mothers interviewed indicated they received antenatal
care during their pregnancy
Figure 13. Antenatal care provider for this pregnancy
3% 4% 5%
Doctor/medical assistant
Nurse
Midwife
Traditional birth attendant (TBA)
88%
*Percentages calculated on with total number of responses not the number of households
34. ANTENATAL CARE
Figure 14. Number of months mother was pregnant at time of first antenatal visit for
this pregnancy
250
200
Number of mothers
150
100
50
0
1 2 3 4 5 6 7 8 9 Don't know
Number of months
35. ANTENATAL CARE
Figure 15. Number of times mother received antenatal care for this pregnancy
140
119
120
100
83
Number of mothers
80 75
60
60
50
40 34
30
18
20 14
9
0
1 2 3 4 5 6 7 8 9 Don't know
Number of antenatal care visits during pregnancy
36. MATERNAL HEALTH
Figure 16. Location of delivery
Other public
Private
0.2% Other
clinic
private Other
0.6%
Health post 0.4% 0.2%
0.2%
Home of mother
32.4%
Health center
58.2%
Home of midwife/TBA
2.0%
Provincial hospital
3.7%
District hospital
2.2%
37. MATERNAL HEALTH
NEEDS
Maternal nutrition
Family planning
Follow-up post-partum
Breastfeeding practices/alternatives
Maternal Mortality
38. MATERNAL HEALTH
ASSETS
Nancy TenBroek , CRWRC Regional Health Advisor
RHAC, Reproductive Health Association of Cambodia
RACHA, Reproductive and Child Health Alliance
AVI, Australian Volunteers International (AUSAid)
Ministry of Health- Midwife Regional Training Centers
RESOURCE/TRAINING MATERIALS
CORE Group
RACHA
RHAC
39. CHILD BIRTH WEIGHT
Figure 17. Child birth weight
More than 4.0 kg
2%
Less than 1.5 kg
1% Don't know
12%
Between 1.5-2 kg
4%
More than 4.0 kg
Between 3-4 kg
35% Between 3-4 kg
Between 2-3 kg
Between 1.5-2 kg
Less than 1.5 kg
Between 2-3 kg
Don't know
46%
40. CHILD HEALTH
Figure 18. Length of time mother breastfed child
200
180
160
140
Number of mothers
120
100
80
60
40
20
0
Length of time mother breastfed (months)
41. CHILD HEALTH
Table 10. Location Where Child Received the Last Dose of Vitamin A
Location Number Percentage(%)
1 National Immunization Day 179 38.9
2 Other (include HC staff visit to village) 166 36.1
3 Sick child visit to Health Care Center 56 12.2
4 On routine visit to Health Care Center 50 10.9
5 Don’t know 9 2.0
Total 460 100
42. CHILD HEALTH
Figure 19. Illnesses the child suffered in the last 30 days
None/Healthy 0.0%
0.0% 0.0%
Child
0.0%
10.1%
Tuberculosis
0.1%
Malaria
0.1% Other
Encephalitis 7.9%
0.3% Chicken Pox Fever
0.4% 42.0%
Dengue Fever
0.8% Diarrhea
13.1%
Acute Respiratory
Infections
4.8%
Cough
20.5%
43. CHILD HEALTH
Table 11. Percentage of households reporting illness of child in last 30 day
CHILD ILLNESS % OF HOUSEHOLDS REPORTED CHILD ILL
FEVER 65.5
COUGH 32
DIARRHEA 20.4
DENGUE 1.2
MALARIA 0.2
ENCEPHALITIS 0.4
TUBERCULOSIS 0.2
ACUTE RESPIRATORY INFECTION 7.5
CHICKEN POX (VARICELLA) 0.6
OTHER 12.4
NONE/HEALTHY CHILD 15.7
44. CHILD HEALTH
Figure 20. Location where child received most vaccinations if
vaccinated.
Outreach activities
3%
Other (includes in
village)
34%
Health center
Has not been 62%
vaccinated
1% Private
practice/clinic
0%
National, provincial
or district hospital
0%
• 95.8% of mothers had a vaccination card for child at time of interview
45. CHILD HEALTH
Figure 21. Reasons for not vaccinating child
0
0 0 000
14.7% Too busy
2.9%
Unaware of benefits our vacination
29.4%
2.9%
Side affects
Place or timing for vaccination
11.8% unknown
Belief there is no need
Rumours
14.7% 23.5% Other
46. CHILD HEALTH
NUTRITION
Table 12. Food children received the day prior to the interview
% of children
Type of food
who received
Bread, rice, noodle or grain product 76.0%
Sugary foods 71.4%
Dark leaf green vegetables 67.3%
Porridge 67.2%
Eggs 48.5%
Commercially produced baby cereal 42.1%
Beef, pork, lamb, goat, rabbit 39.3%
Other fruits and vegetables 38.7%
47. CHILD HEALTH
NEEDS
Child nutrition
Children of factory workers are not exclusively breastfed 6M
Preventative health
Water safety
Sanitary practices (latrine use, hand-washing, waste disposal)
Disease causation
48. CHILD HEALTH
ASSETS
Nancy TenBroek, CRWRC Regional Health Advisor
Sponsorship schools raising awareness with nutrition program
Government immunization program
Save the Children Cambodia
49. PRIORITIES FOR HEALTH PROGRAMMING
Safe Water Access
Protection of water source
Water treatment
Increased understanding of water-borne diseases
Sanitation
Villages to achieve open defecation free status (ODF)
Hand-washing practices
Waste disposal
Maternal and Child Nutrition
Diversified diet containing necessary nutrients
Preventative Health
Disease causation
Lifestyle
Family planning
50. CONCLUSION
Priorities fall under Primary Health Care
Develop programming and network in areas of
priority
Research further (possibly with PRA) what knowledge
and influences are behind the behaviors ie. Water
treatment
Use data to apply for funding
Editor's Notes
Water testing and quality, ie. Arsenic Treatment of water: Consider alternative methods of treatment besides boilingWell protection and maintenance – uncovered dug wells, rain catchment jar contaminationAlternative water sources, community initiative and contribution for new wells ie. Savings group if necessaryWater conservation ie. Greywater/Use of waste waterWater Safety Awareness- understanding harmful substances in water, ways to treat and conserve. Protection of water source ie. Waste dumping, toilet over waterASSETS:RDI, Resource Development International --- Arsenic testing lab, provide new technology for better water catchment systemsCAWST, Centre for Affordable Water and Sanitation TechnologyWater for Cambodia --- Khmer education visualsCommunity Guide to Environmental Health in Khmer --- can be used by NGO partners and communities to initiate discussions about water issue IDE Cambodia --- marketing of latrines, water filtration, use the CLTS modelRainWater Cambodia- provides their training services to other NGOs working in the WatSan sectorEvery workshop or training session can be tailored to the beneficiary or your own organisations needs
HH8. Households own any livestock, herds or farm animals.Yes84.1%
Range was from 0 to $750 dollars on the last visit
- Only 1.8% of mothers reported having a doctor assist with delivery. 54% of doctors work and live in Phnom Penh, where 9.3% of Cambodia’s population live (Review of Health Leadership and Management Capacity in Cambodia, 2011 Asante & Hall)facilitiesResearch further: Alternative health care providers (beyond Health Centers)- Who are they? Do village members have confidence in the treatment they receive? . What are health centers and VHVs sharing with the population? Are they just treating an illness. private services tends to be by those with more resources. Private personnel do not offer service for free for those at the poverty level that would receive for free at Public Health CenterIssue in District Hospital: Staff takes medicine and supplies for personal use and gain. Supplies are irregular in Health Facilities while it is the responsibility of the Government to supply when requested. -96.5% of households use wood as the main fuel source WHILE 30.6% are cooking indoors and 17.6% under the house. Proper ventilation* is a concern.releases many harmful pollutants [1]. Inhaling these pol- lutants results in excess respiratory morbidity and mortal- ity in women and children [2]. Known as a "silent killer" [1], over 1.6 million children die annually throughout the developing world from the consequences of exposure to biomass fuel smoke [3]. Exposure to indoor air pollution has been linked with i) a reduction of forced vital capacity [4] ii) an increased risk of acute respiratory infections [5] Page 1 of 7 (page number not for citation purposes) BMC International Health and Human Rights 2008, 8:10 http://www.biomedcentral.com/1472-698X/8/10 iii)chronic obstructive pulmonary disease (COPD)[6] and iv) lung cancer [7] in women.
Needs:75.7% of land owners find the land does not produce enough for household to live off of each yearRice production - key to the secure feeling of households
93.7% of households reported a midwife provided antenatal care.
90.3% of mothers had their first antenatal care visit within their first trimester (months1-3)
65.5% of werefacility deliveries
NLC example -- child fed boiled water with sugar in first days of life because milk production was lowOREDA– mother feeding MyBoy in unsterilized bottle, said her husband purchases it as milkIn the same period the Maternal Mortality Ratio (MMR) has barely improved and is still alarmingly high. The World Health Organisation has estimated that every year approximately 2,900 Cambodian women and girls die while another 58,000 to 87,000 women and girls will suffer from disabilities caused by complications during pregnancy and childbirth. Eclampsia- form of toxemia, characterized by hypertension and convulsions