Downloaded 24 times


![TOPIC 5 PERCENTAGES 79
PEDAGOGICAL CONTENT KNOWLEDGE
The introduction of percentages usually follows instruction after the mastery of
basic fraction and decimal mathematical skills.
Teachers should note that various fraction and decimal skills are prerequisite
skills for learning percentages. For example, to solve a percentage problem, the
pupil must be able to convert a percentage into a fraction or a decimal as shown
below:
For example,
26
100
= 26%, and 45% = 45
100
= 0.45
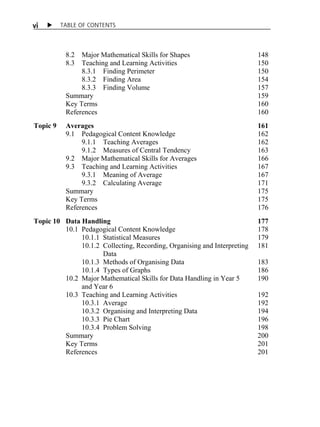
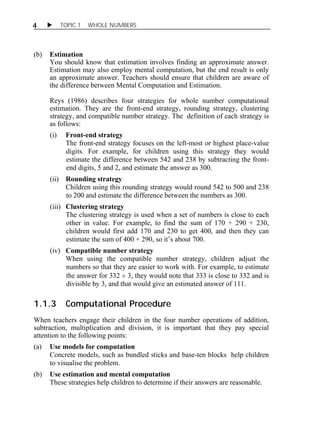
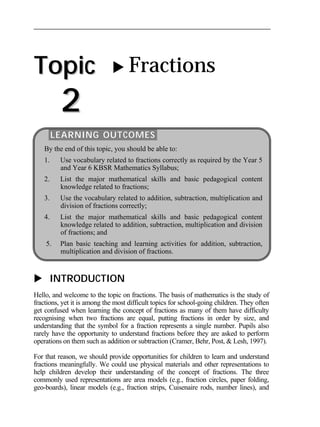
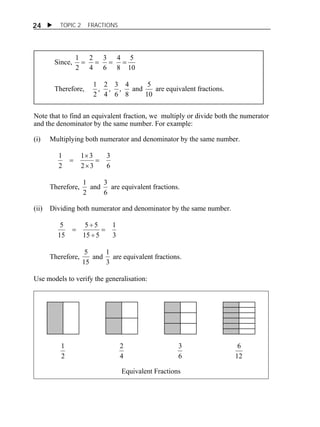
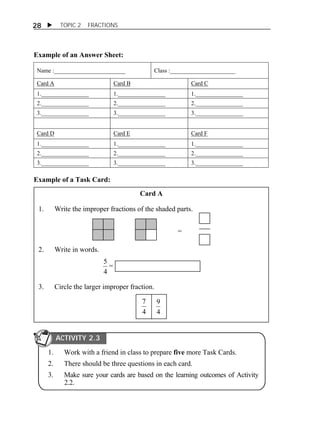
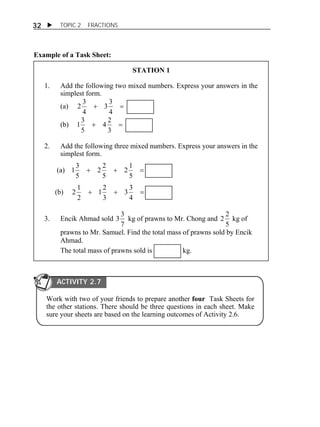
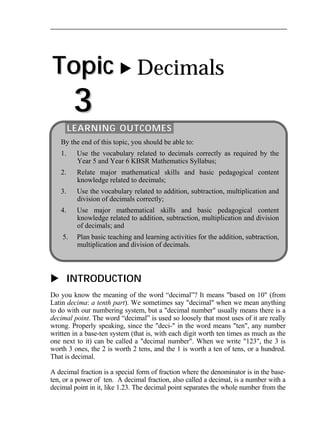
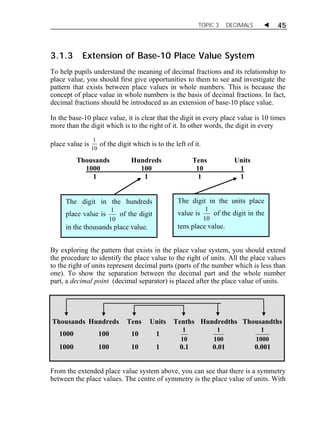
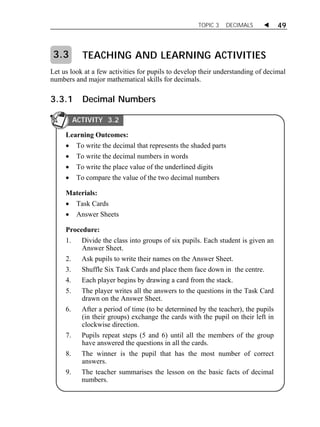
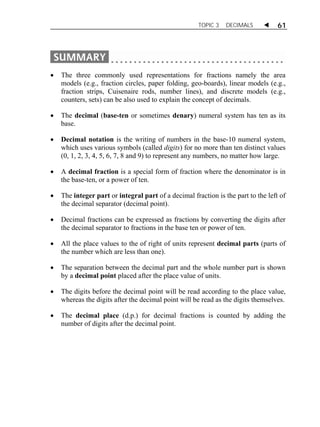
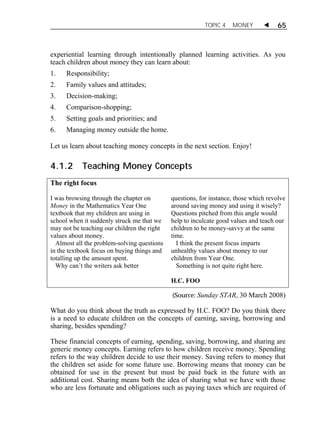
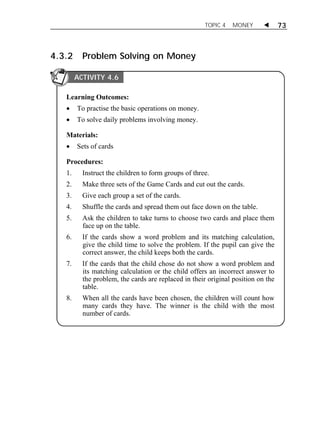
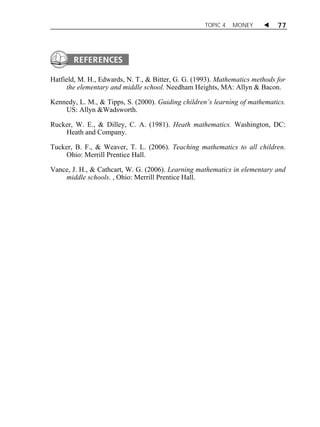
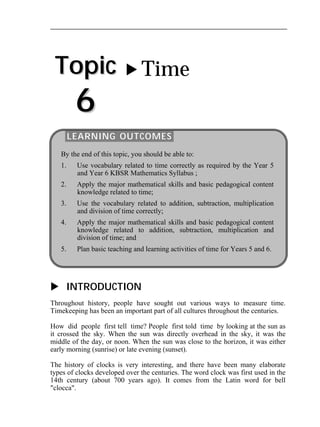
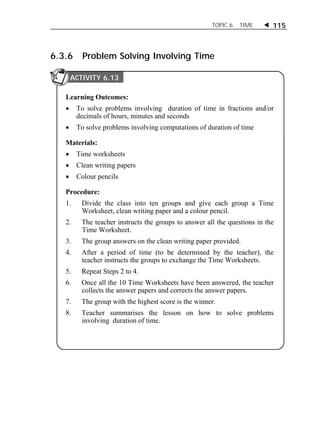
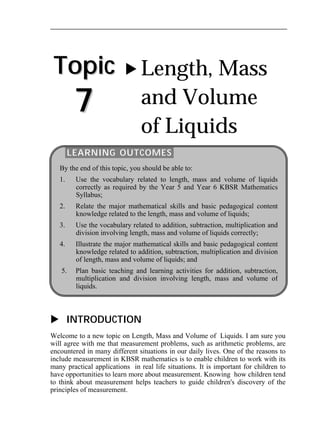
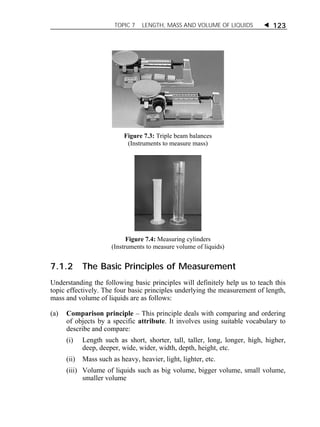
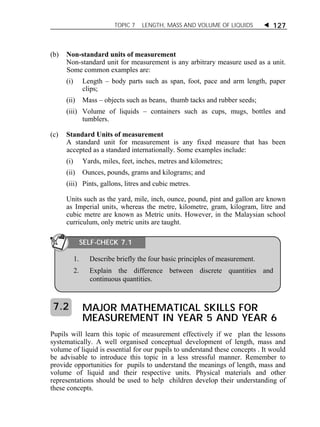
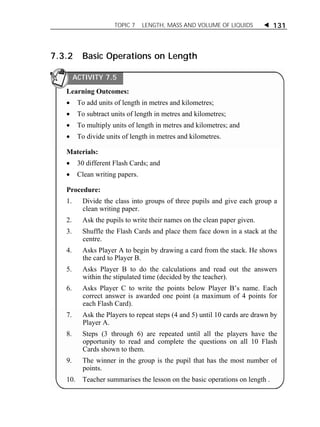
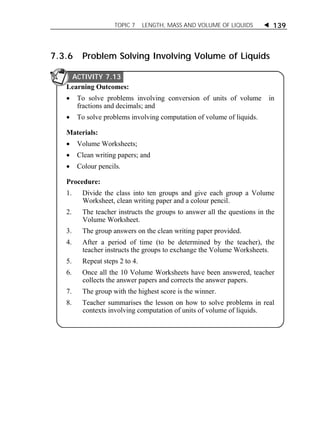
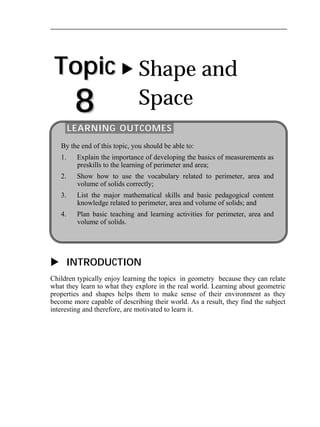
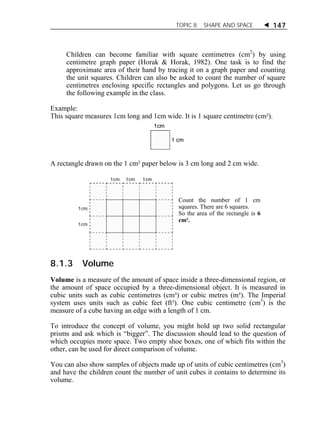
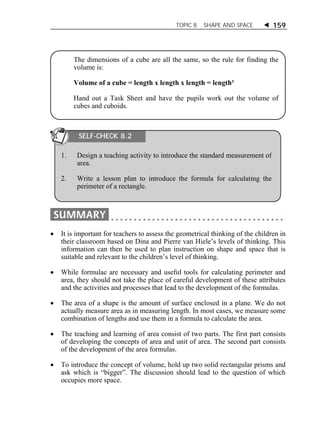
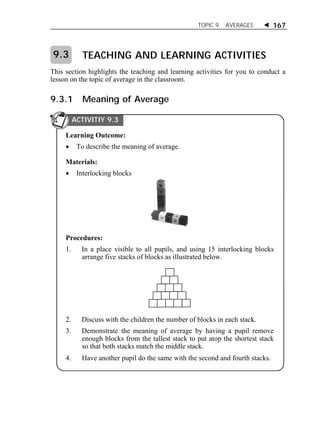
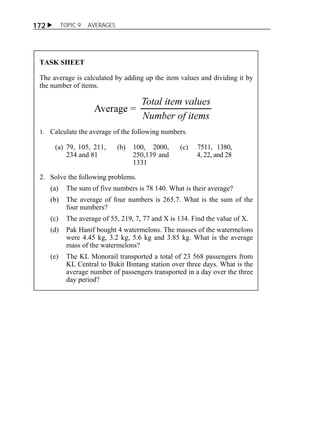
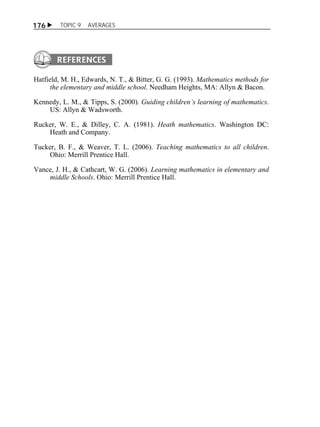
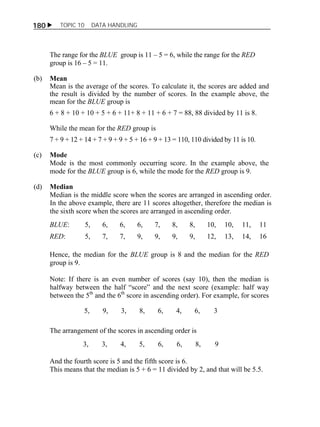
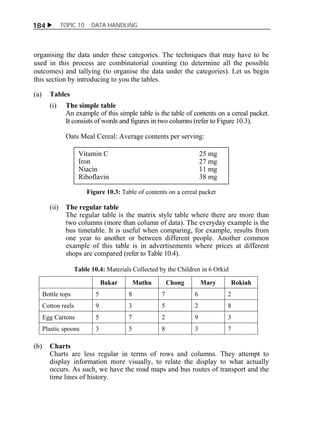
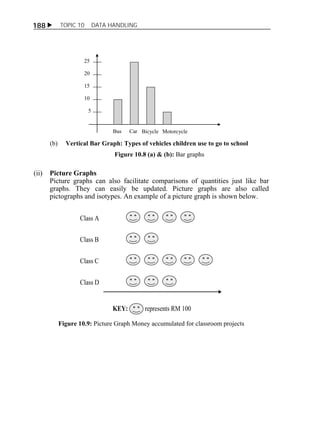
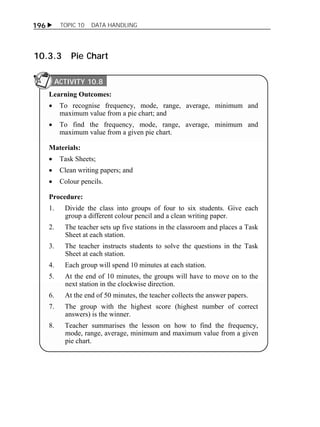
5.1.1 Meaning and Notation of Percent
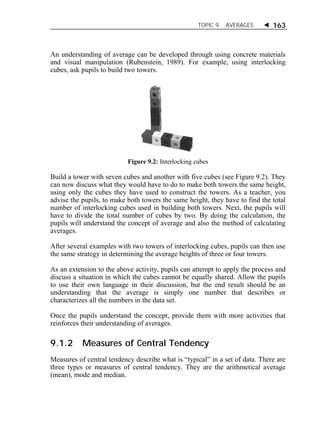
Figure 5.1: The various sales discount signs that we often see in shopping centres.
[Source: http://www.bbc.co.uk]
5.1
ACTIVITY 5.2
1. Change the following percents to decimals: ½ %, ⅘ %, ⅝ %.
2. Develop an instructional sequence to teach pupils how to
change percents like ½ %, ⅘ %, or ⅝ % to decimals.](https://image.slidesharecdn.com/hbmt3203math-141006185850-conversion-gate02/85/HBMT-3203-83-320.jpg)
![TOPIC 5 PERCENTAGES 85
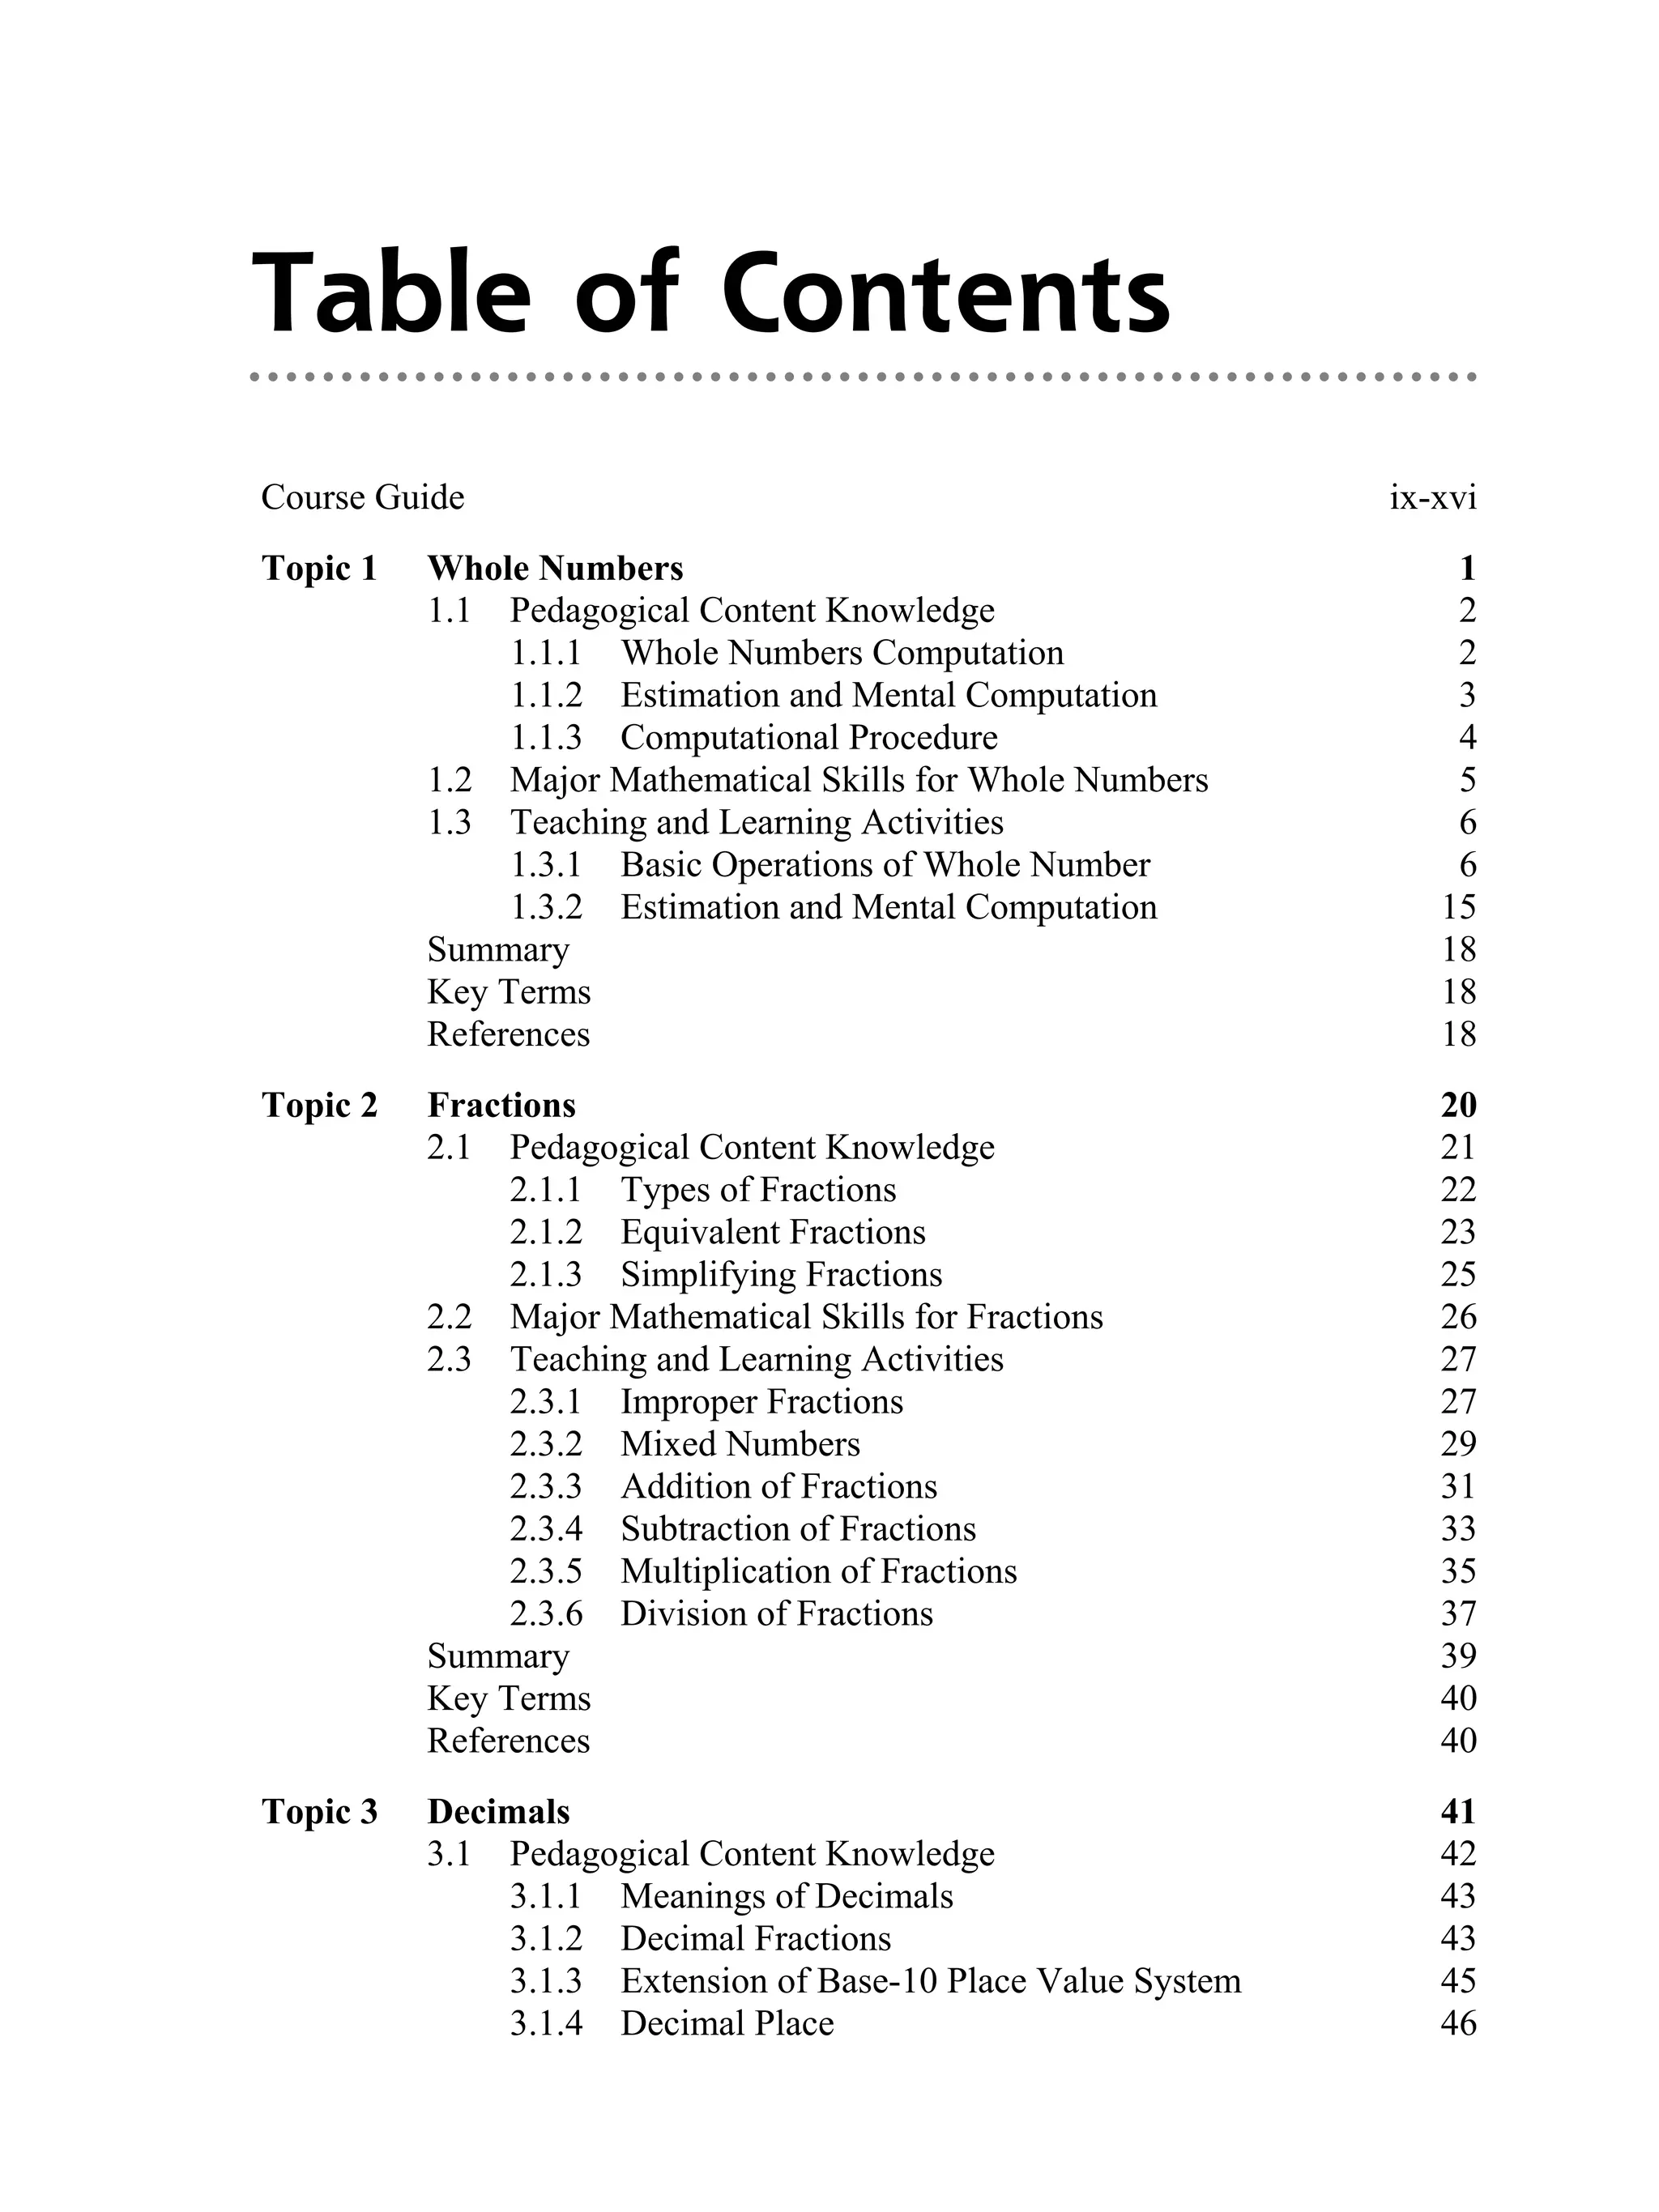
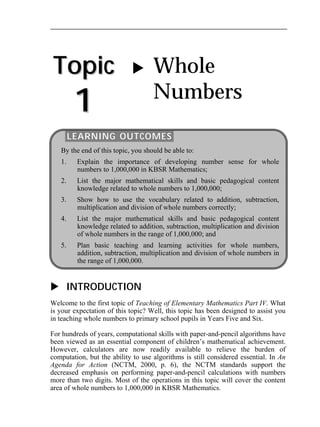
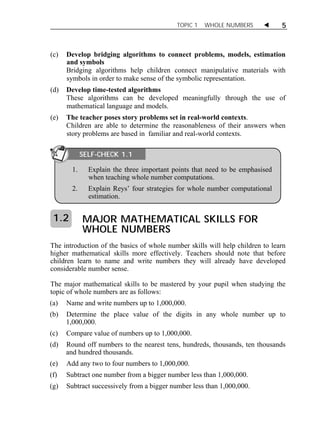
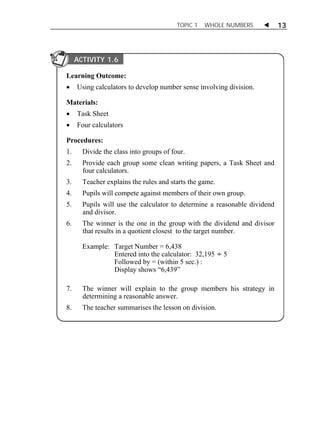
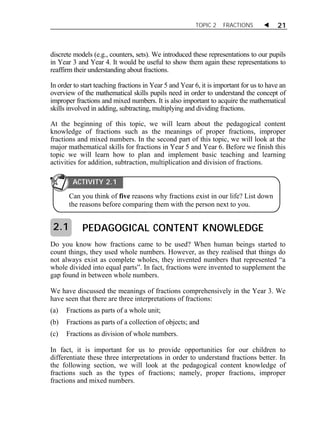
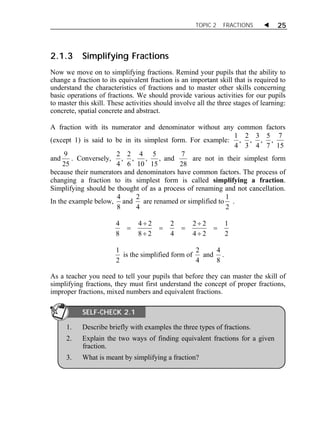
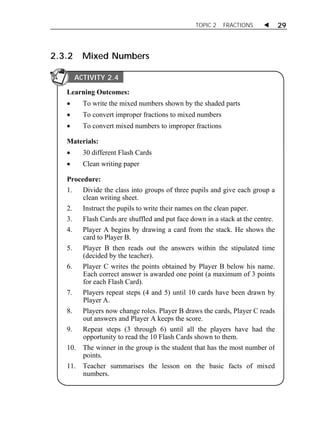
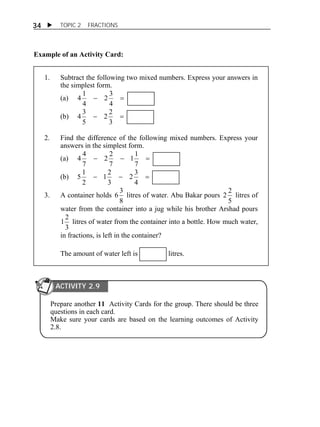
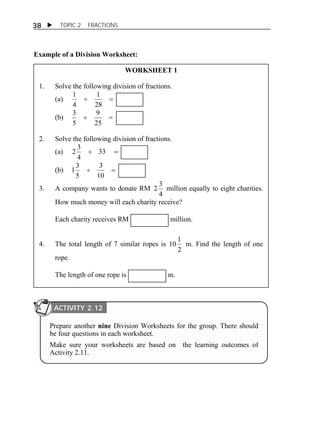
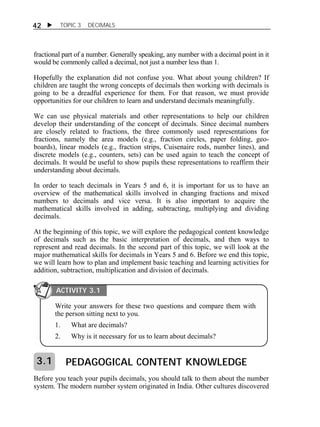
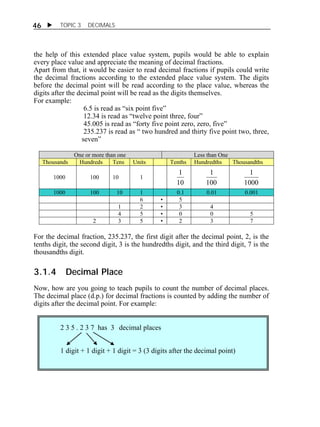
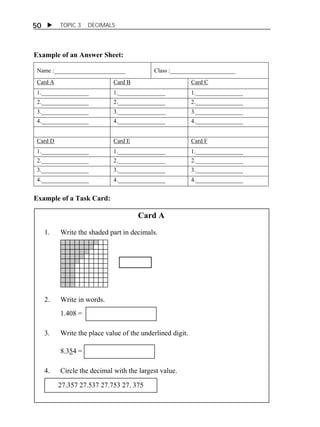
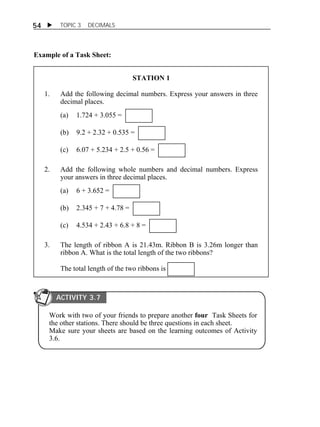
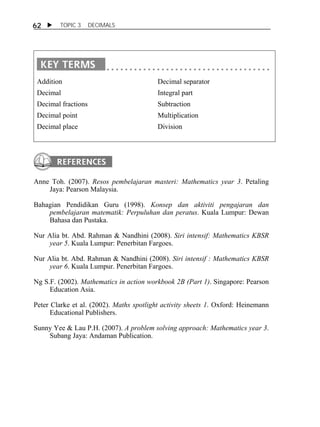
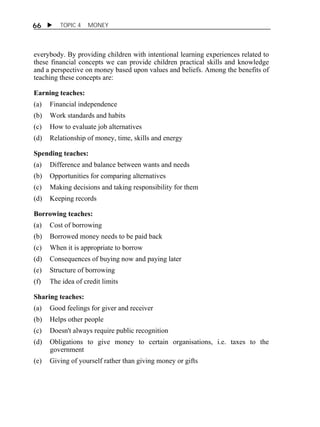
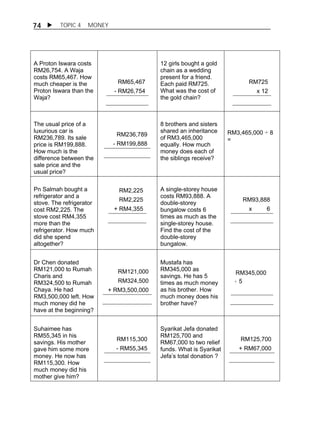
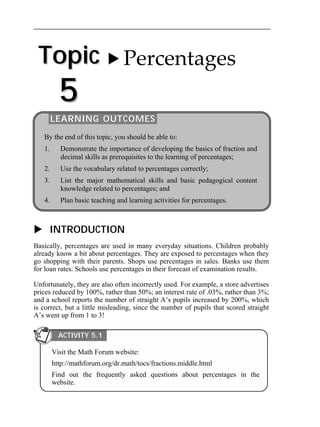
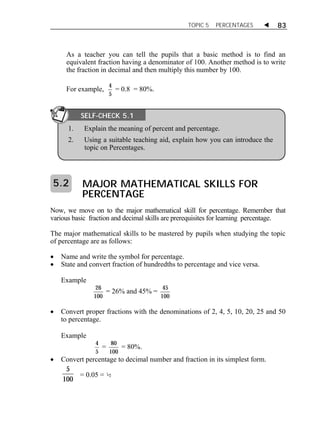
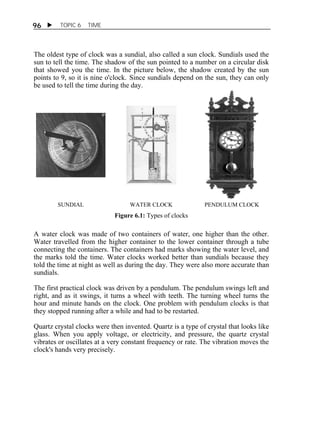
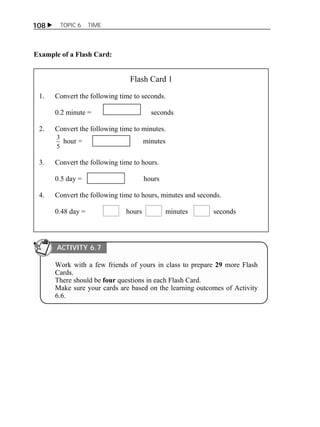
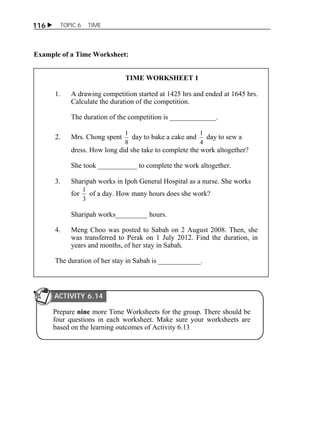
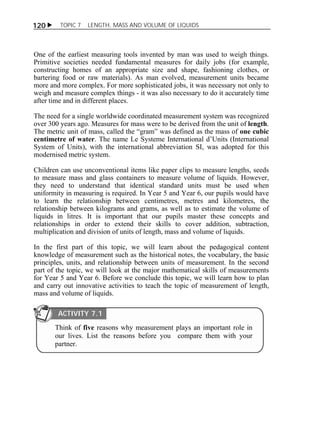
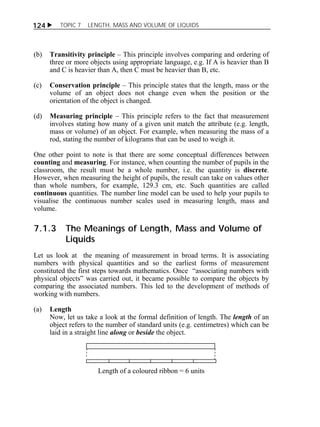
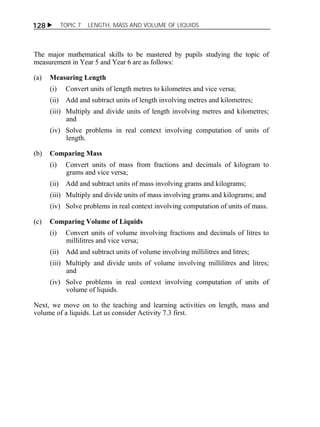
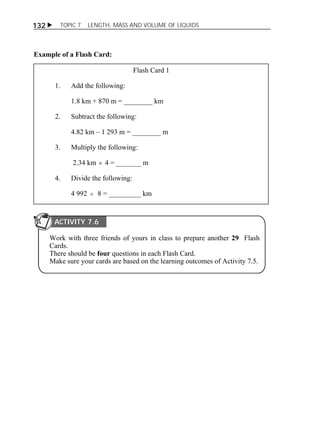
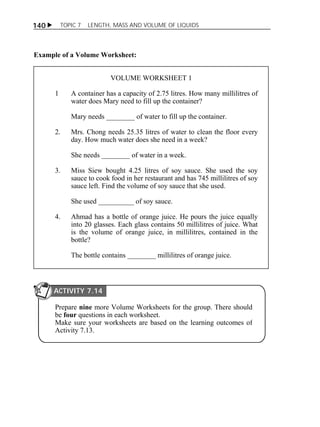
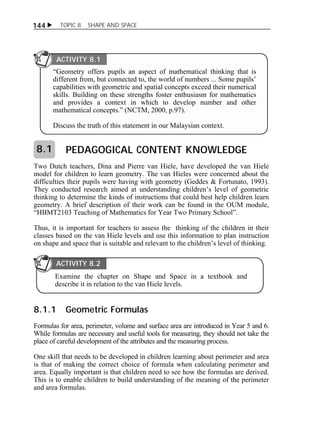
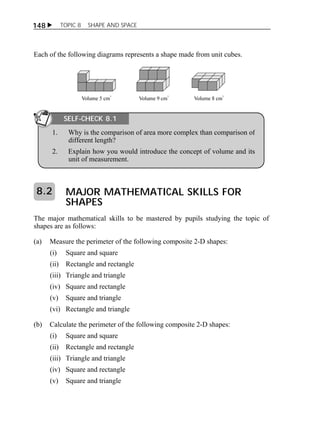
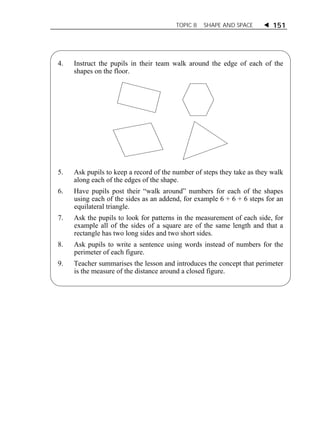
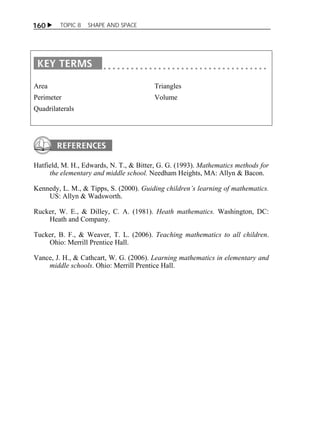
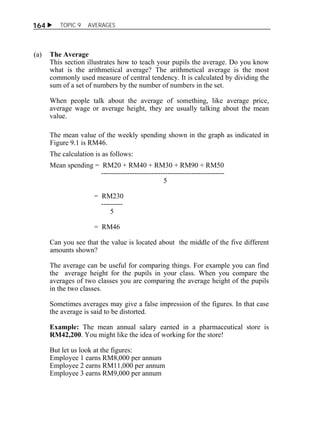
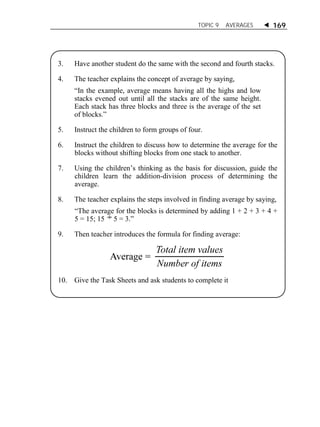
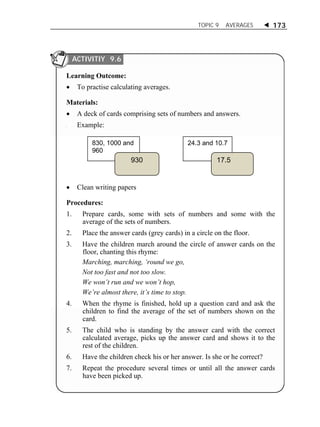
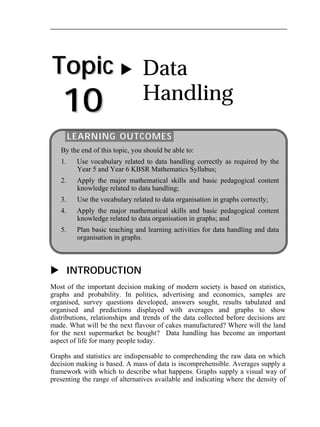
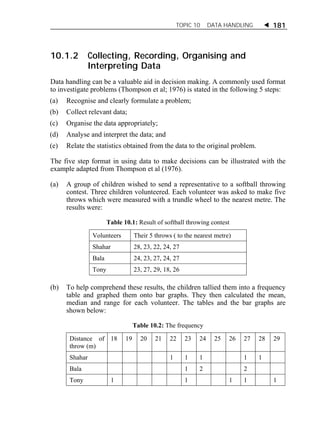
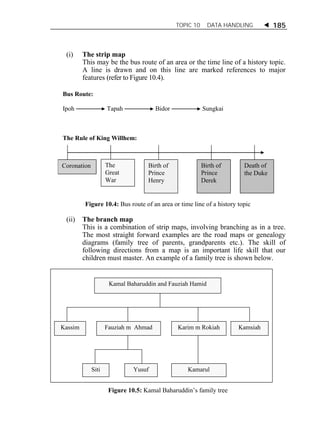
Procedures:
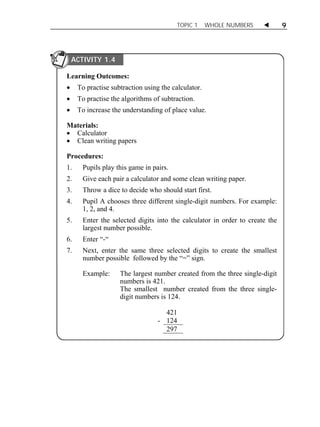
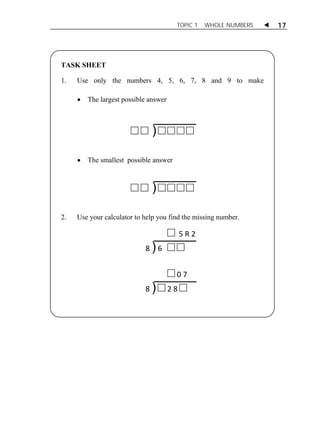
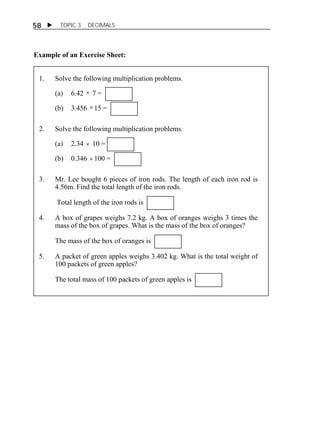
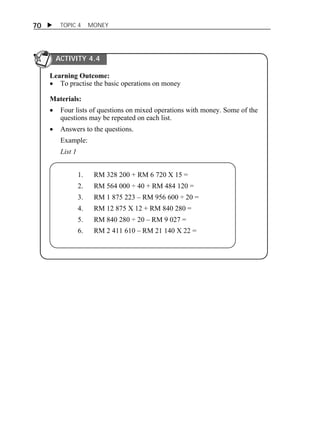
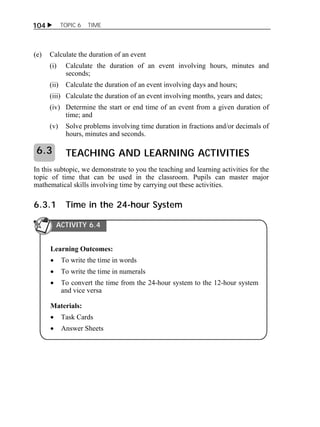
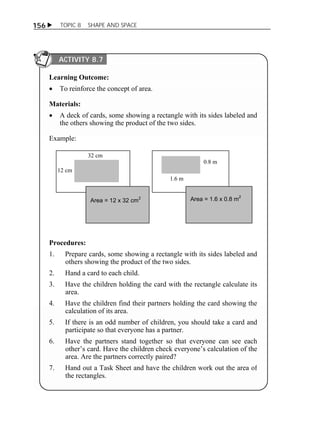
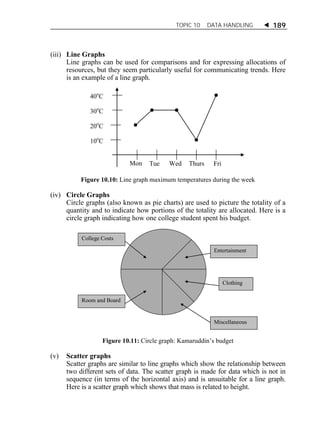
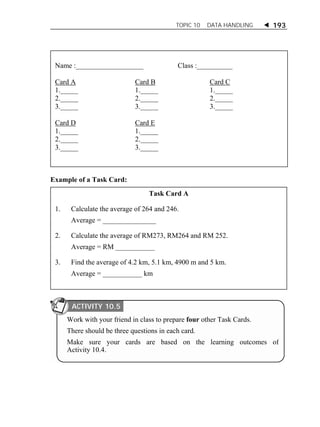
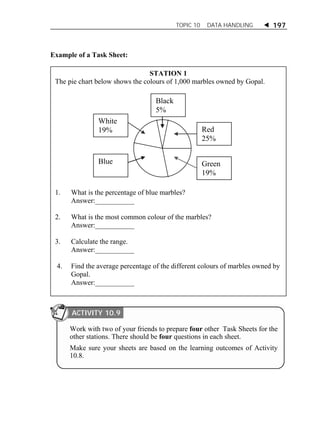
1. Display a 10 x 10 grid. Ask the children to verify that there are 100
equal squares on the grid.
2. Shade one square and ask a pupil to name the shaded square. .
[one hundredth].
3. Ask for a volunteer to come to the board to write a numeral to name
the shaded square. [ Accept either 1
ACTIVITY 1
100
or 0.01 ].
4. Tell the children that 1
100
can also be named 1 per cent.
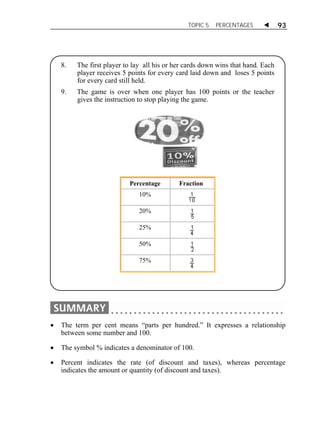
5. Explain to the children that percent means per hundred, or out of
hundred.
6. Explain to the children that the symbol % expresses a denominator
of 100. As such, the name of 1 of the small square can be written as
1% and read as one per cent.
7. Ask fo a volunteer to count the number of shaded squares in the
diagram above.
8. Ask the volunteer to come to the board to write a numeral to name
shaded squares. [ 40
100
].
9. Ask the volunteer to express the shaded squares in per cent. [ 40%].
10. Give out the Task Sheet and instruct the children to complete it.](https://image.slidesharecdn.com/hbmt3203math-141006185850-conversion-gate02/85/HBMT-3203-89-320.jpg)
![TOPIC 5 PERCENTAGES 87
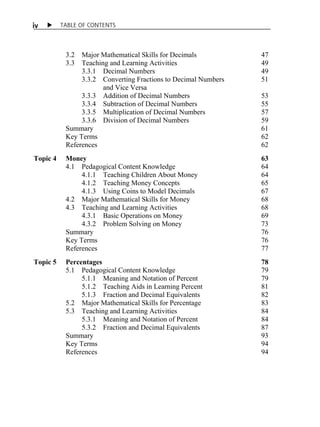
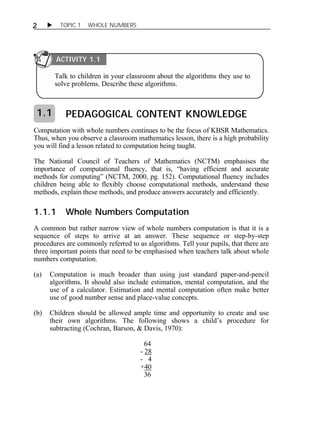
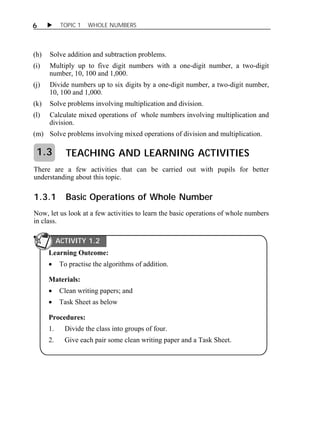
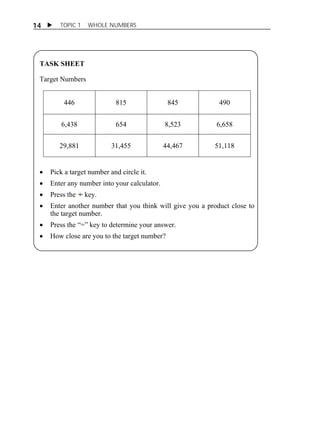
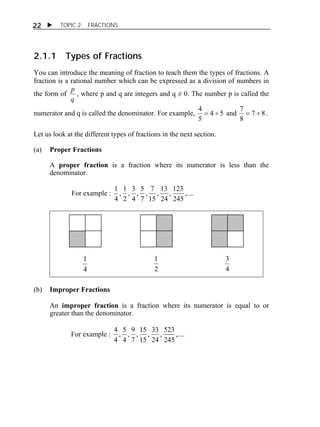
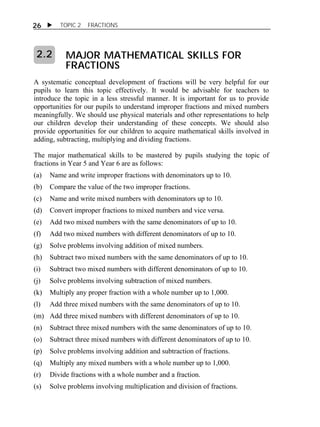
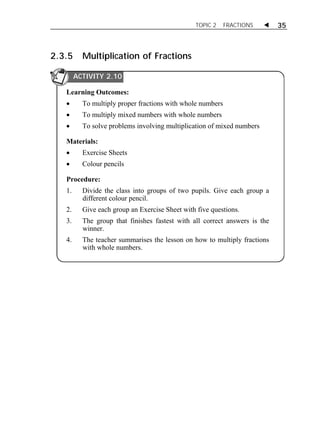
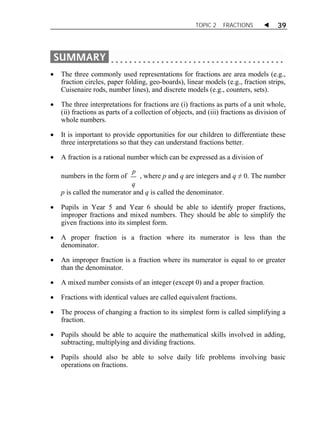
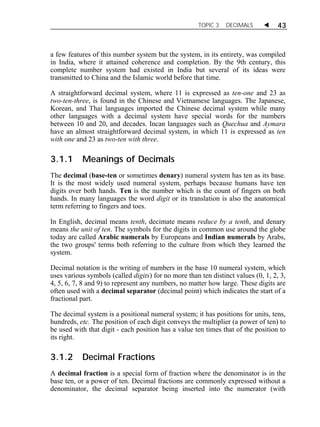
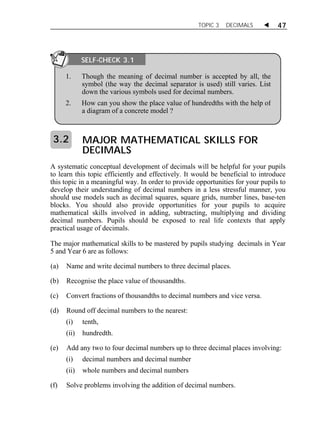
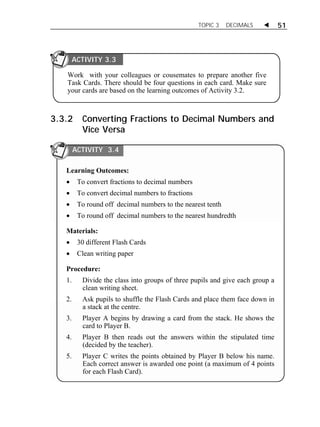
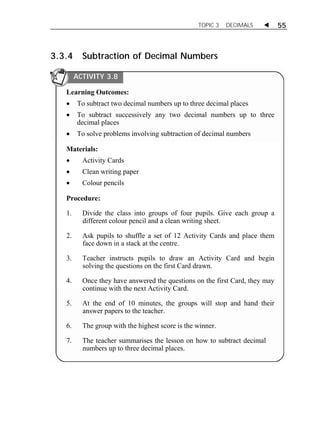
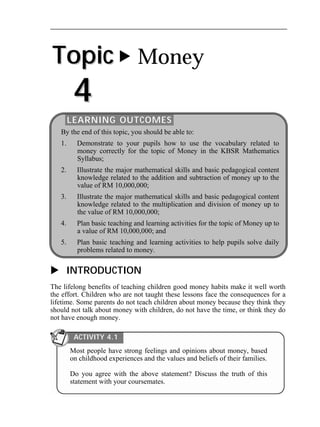
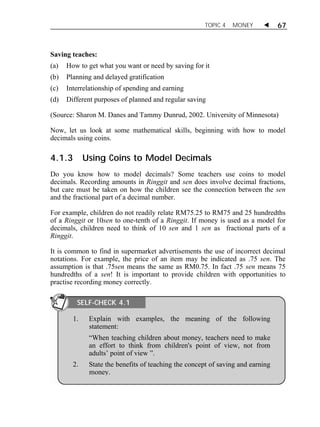
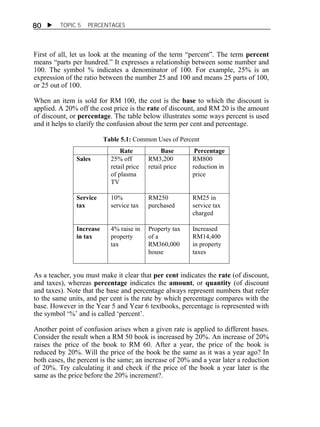
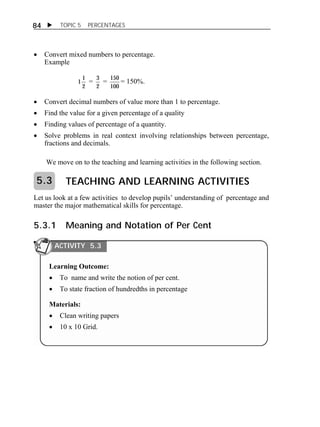
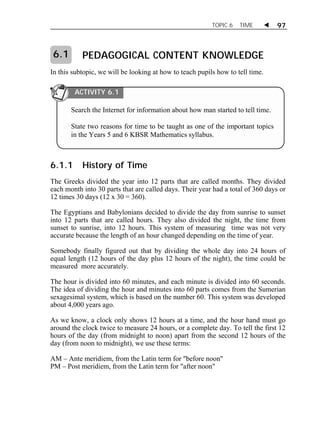
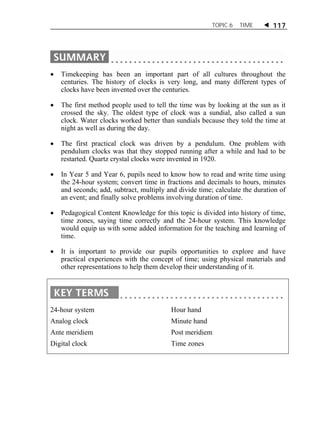
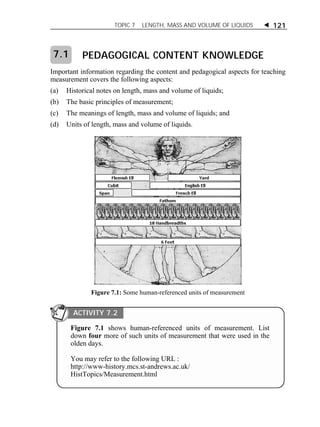
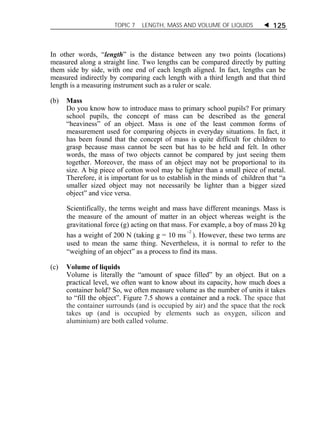
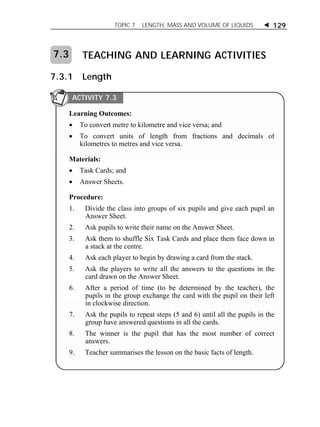
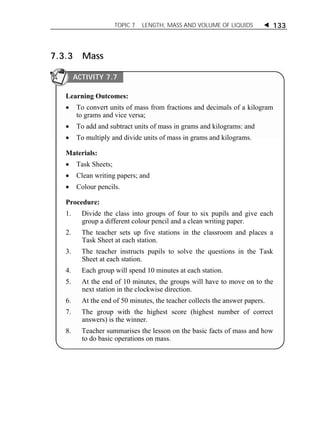
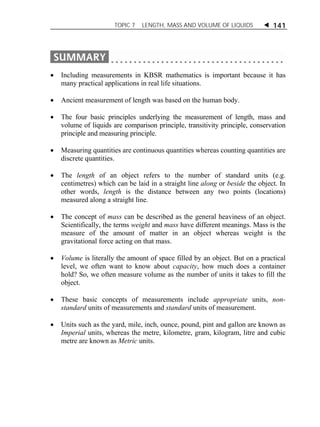
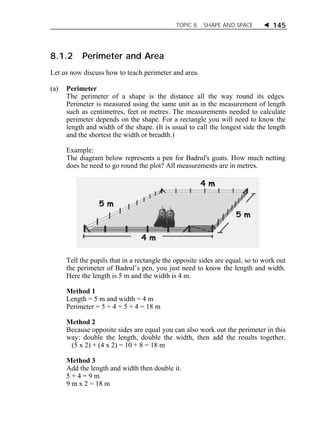
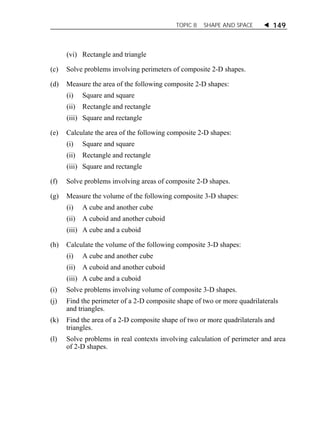
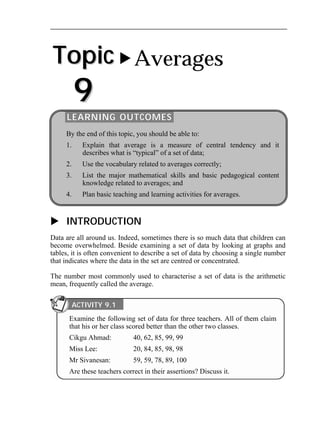
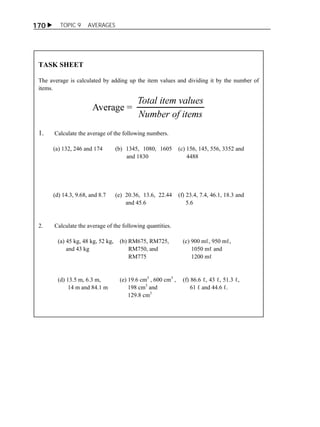
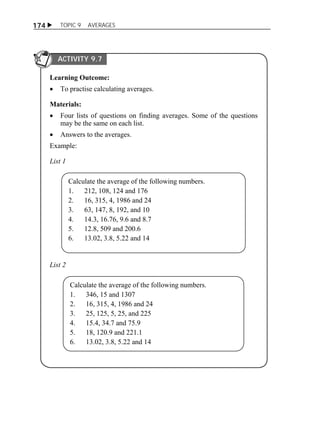
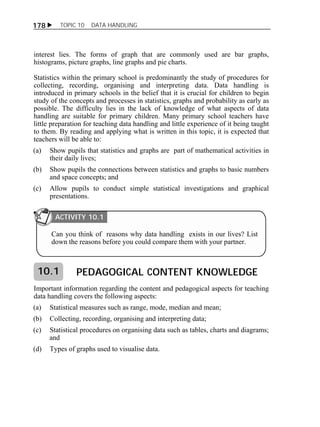
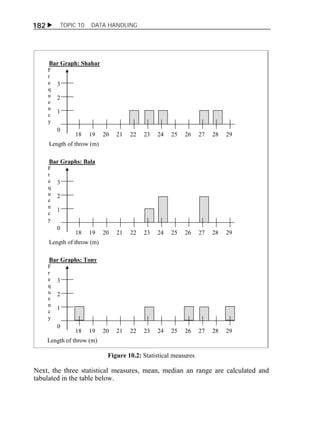
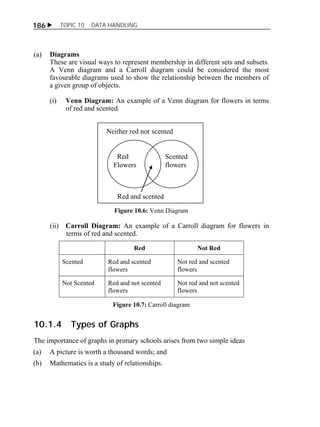
5.3.2 Fraction and Decimal Equivalents
Learning Outcomes:
To convert proper fractions with denominators of 2, 4, 5, 10, 20, 25
and 50 to percent.
To convert mixed numbers to percentage
Materials:
Clean writing papers
Task Sheet as below
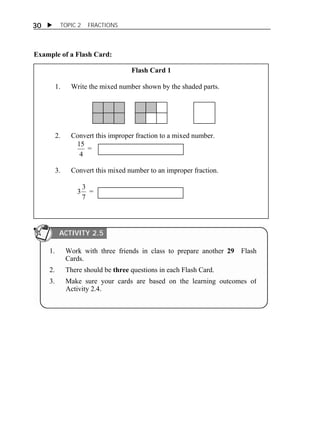
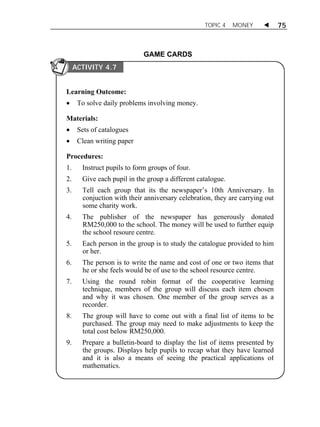
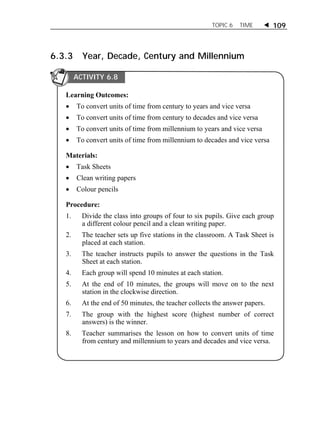
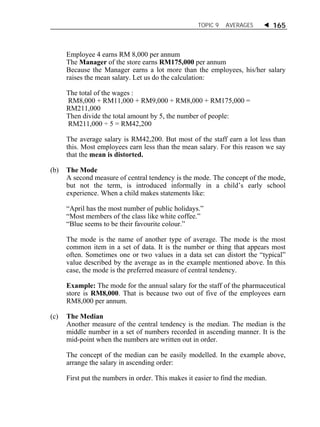
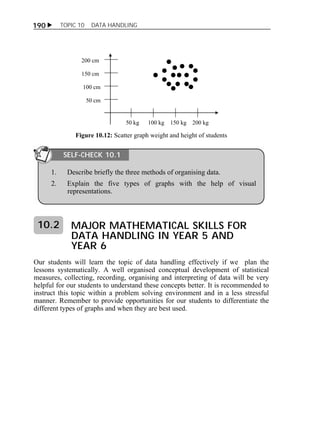
Procedures:
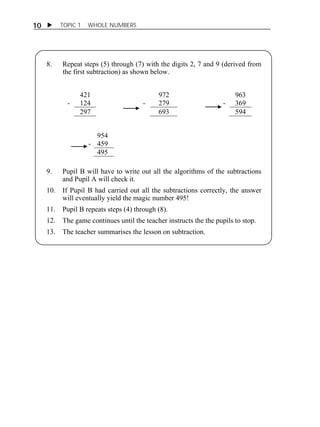
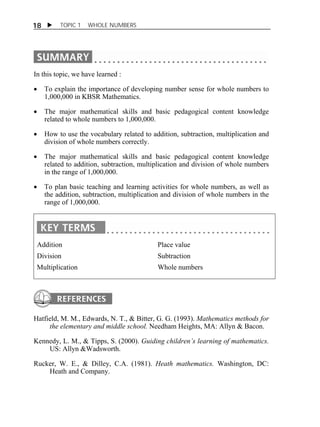
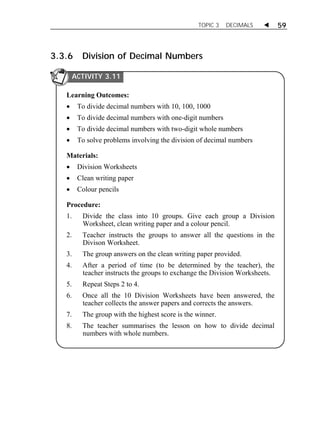
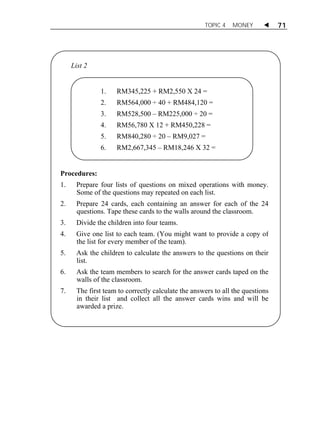
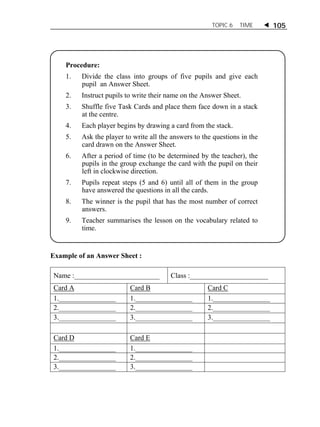
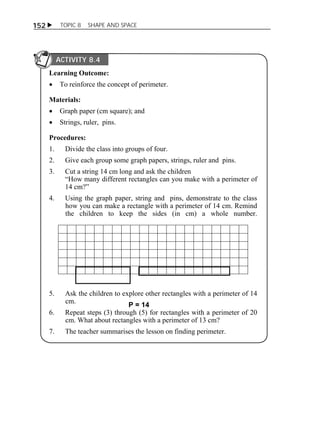
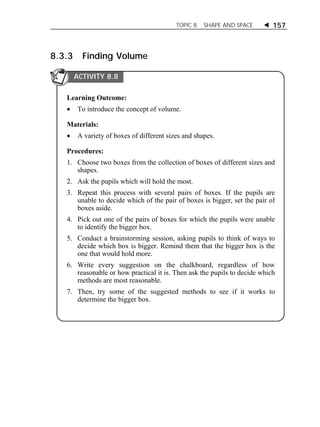
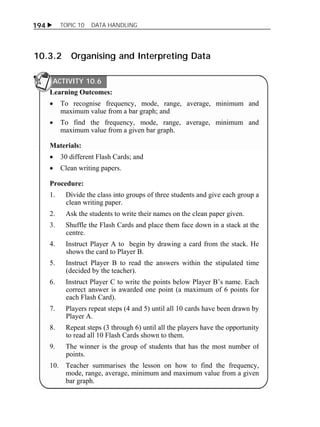
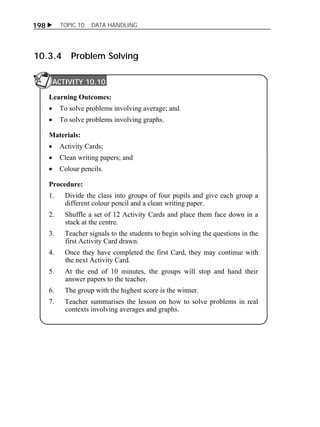
1. Display 10 magnetic chips, 4 green and 6 blue on a magnetic
board.
2. Ask for a volunteer to come forward to count the number of
coloured magnetic chips. [10]
3. Ask the children,
“What part of the set of magnetic chips is green?” [ 4/10]
“Can anyone tell what percent of the chips is green?” [ 40% ]
If a child gives the answer as 40%, ask for an explaination of how
it was determined.
If no answer is given, ask, “What must we do to change 4
10
to a
fraction with a denominator of 100?” [Multiply both numerator
and denominator by 10].
Ask, “Why do we do this ?” [ 40
100
is equivalent to 40% ]
ACTIVITY 5.4](https://image.slidesharecdn.com/hbmt3203math-141006185850-conversion-gate02/85/HBMT-3203-91-320.jpg)
![ TOPIC 5 PERCENTAGES
88
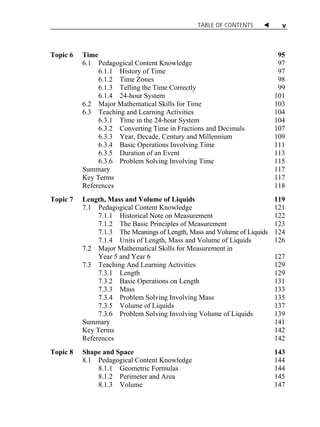
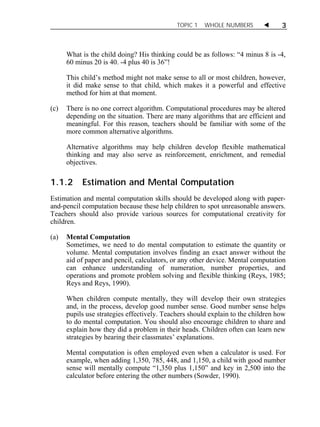
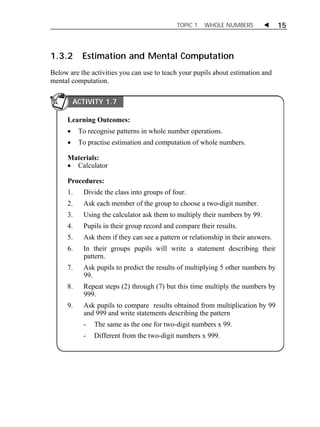
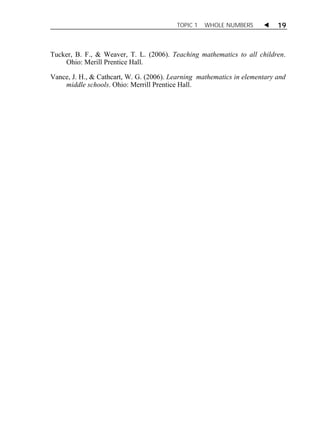
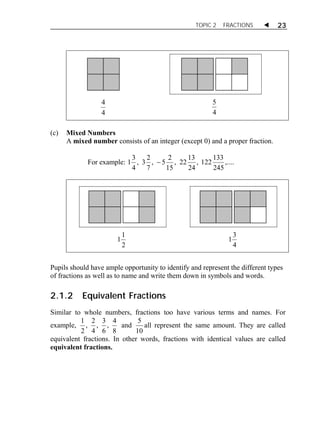
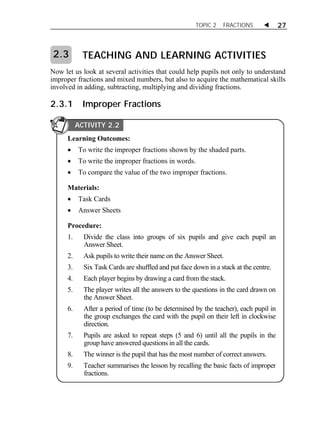
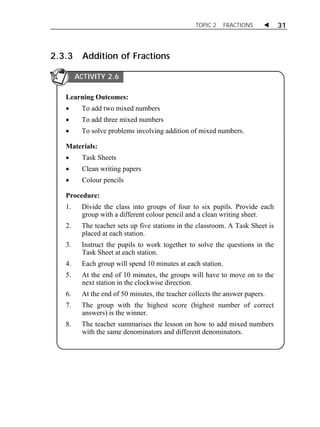
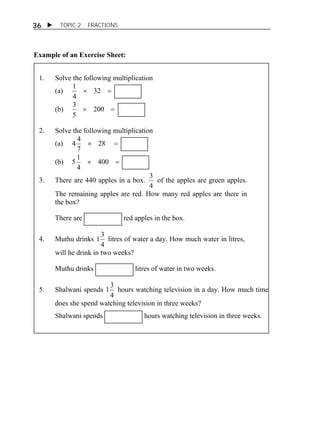
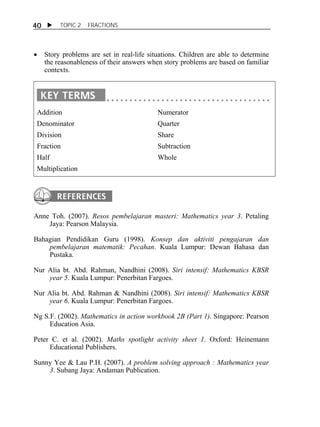
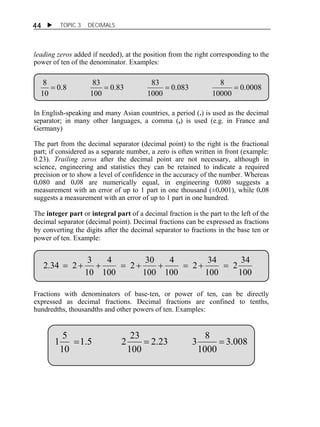
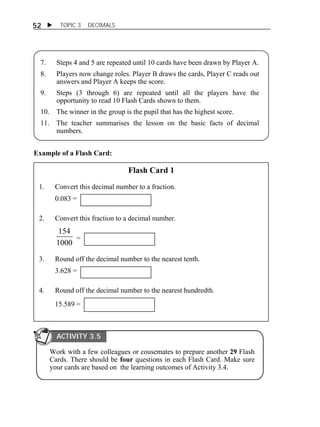
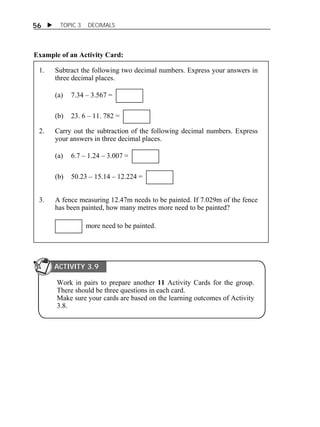
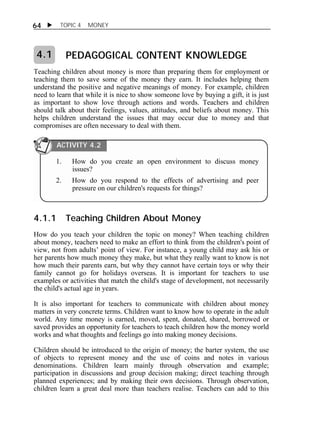
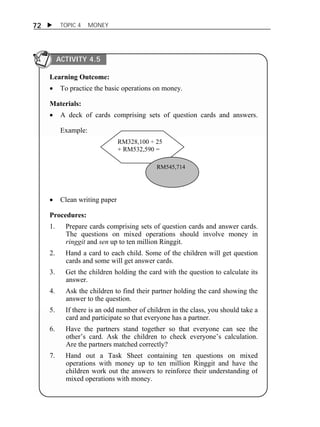
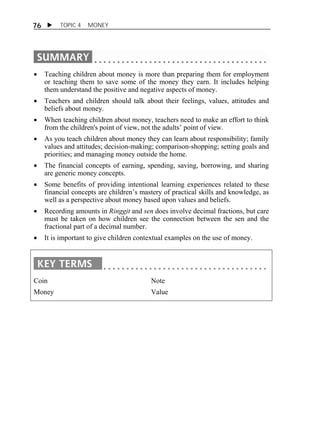
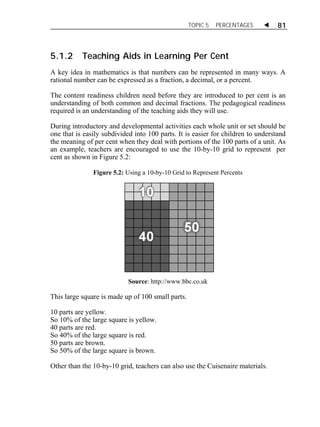
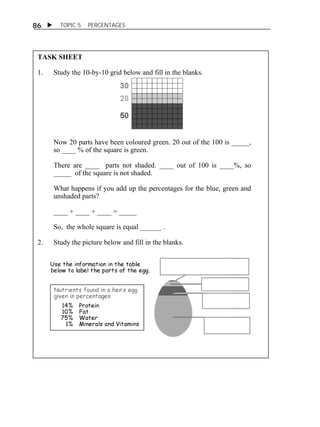
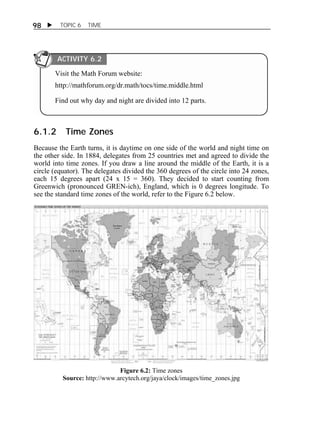
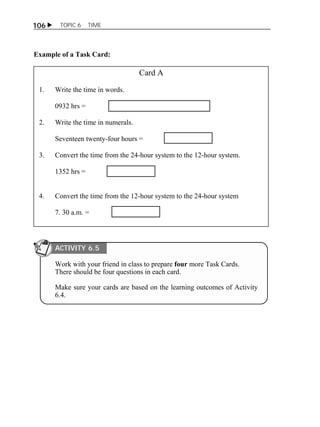
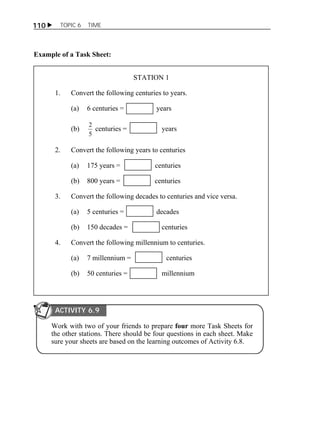
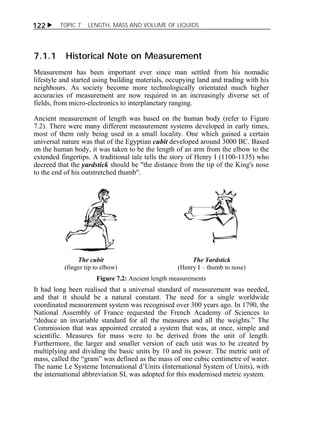
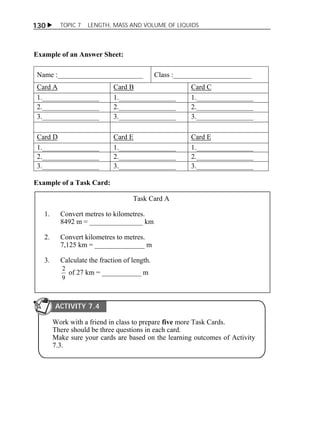
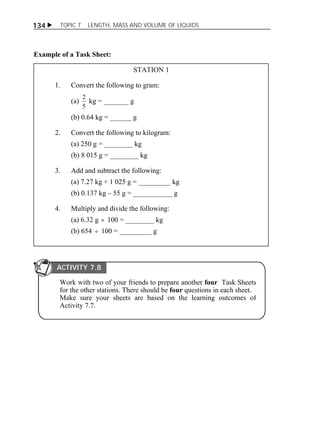
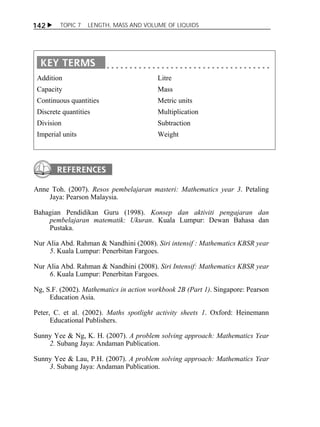
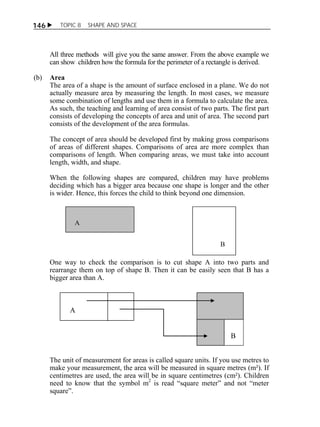
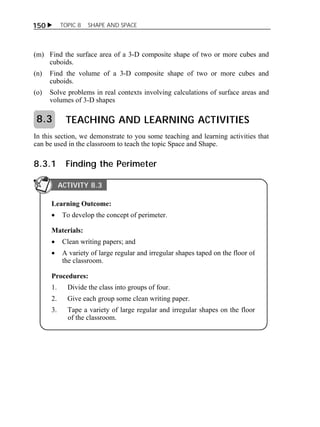
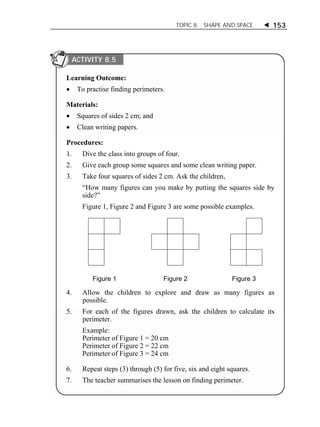
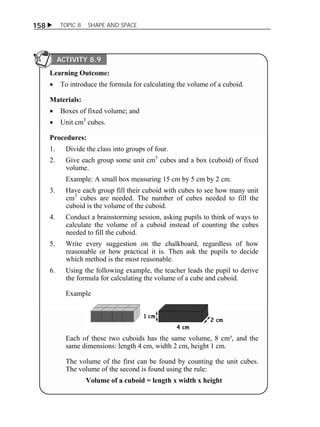
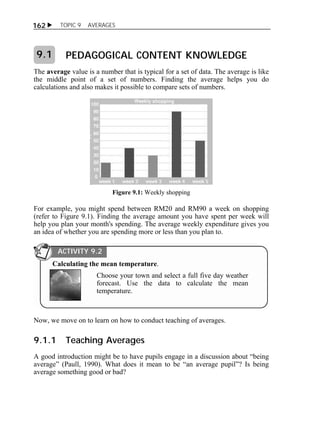
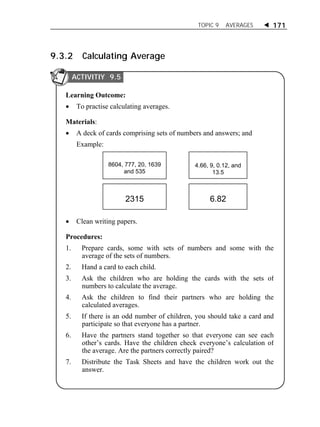
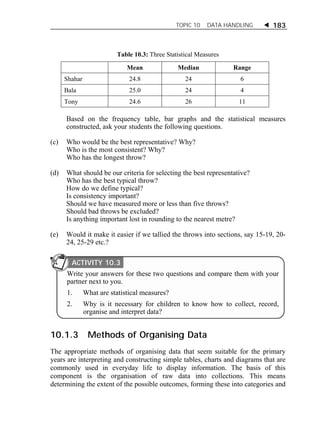
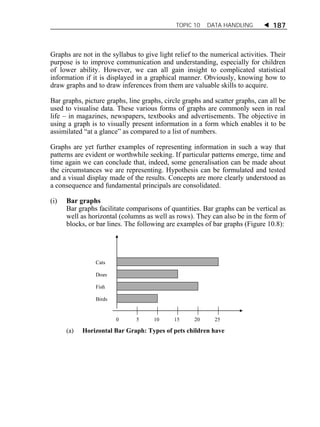
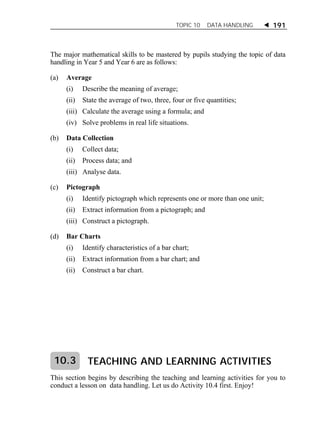
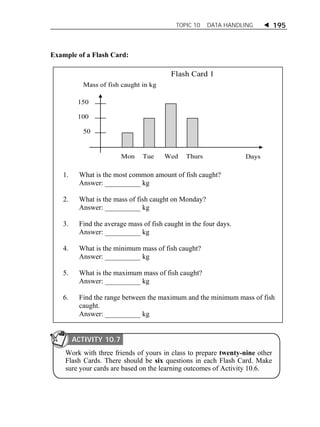
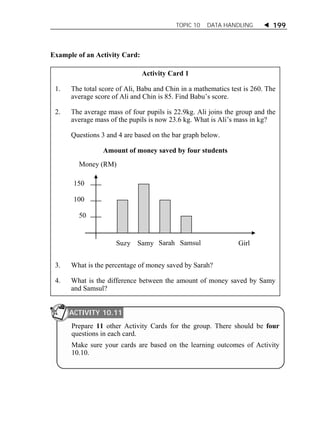
4. Next, add another 10 green magnetic chips to the magnetic board.
ACTIVITY 1
5. Ask for a volunteer to come forward to count the number of
coloured magnetic chips. [20]
6. Ask the children, “Are the green chips in this set still 40% of the
set?”
7. Ask the children,
“What part of the set of magnetic chips is green?” [ 14
20
]
“Can anyone tell what percent of the chips is green?” [ 70% ]
If a child gives the answer as 70%, ask for an explaination of how it
was determined.
If no answer is given, ask, “What must we do to change 14
20
to a
fraction with a denominator of 100?” [Multiply both numerator and
denominator by 5].
Ask, “Why do we do this ?” [ 14 5
x
20 5
= 70
100
is equivalent to 70% ]
8. Repeat steps (4) through (7) with more examples.
9. Handout Task Sheet and ask pupils to complete it.](https://image.slidesharecdn.com/hbmt3203math-141006185850-conversion-gate02/85/HBMT-3203-92-320.jpg)
![ TOPIC 5 PERCENTAGES
90
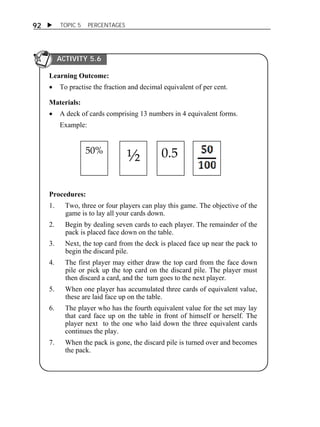
ACTIVITY 5.5
Learning Outcomes:
To convert percentage to decimal number and vice versa
To convert decimal numbers of values more than 1 to percentages
Materials:
Clean writing paper
Task Sheet as below
Procedures:
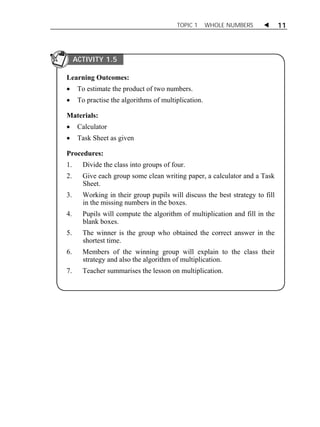
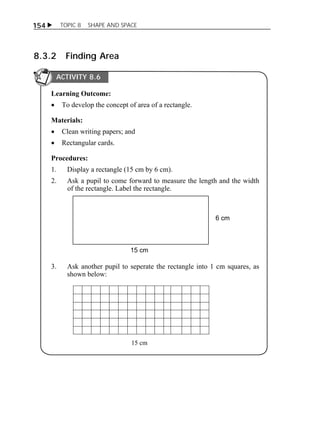
1. Display a 10 x 1 grid on the board.
2. Have a volunteer come forward to count the number of boxes on
the grid. [10]
3. Ask the children,
“What decimal represents the shaded part of the grid ?” [ 0.3 ]
“Can anyone tell what per cent of the grid is shaded?” [ 30% ]
If a child gives the answer as 30%, ask for an explanation on how
it was determined.
If no answer is given, ask, “What decimal fraction represents the
shaded part of the grid?” [ ]
“Can anyone change the fraction to a decimal?” [ 0.3 ]
“What must we do to change a decimal to per cent?” [Multiply by
100].
Ask, “What per cent is 0.3 ?” [ 0.3 x 100 is equivalent to 30% ]
4. Next, show another strip of 10 x 2 grid on the board.
5. Ask for a volunteer to come forward to count the number of boxes
on the grid. [20]
6. Ask the children, “What decimal represents the shaded part of the
grid ?” [ 0.4]
7. Ask the children,
“Can anyone tell what percent of the grid is shaded?” [ 40% ]](https://image.slidesharecdn.com/hbmt3203math-141006185850-conversion-gate02/85/HBMT-3203-94-320.jpg)
![TOPIC 5 PERCENTAGES 91
8. Ask for an explanation on how it was determined. [Multiply 0.4 by
100 ]
9. Repeat steps (4) through (7) with other examples.
10. Hand out the Task Sheet and ask pupils to complete it.
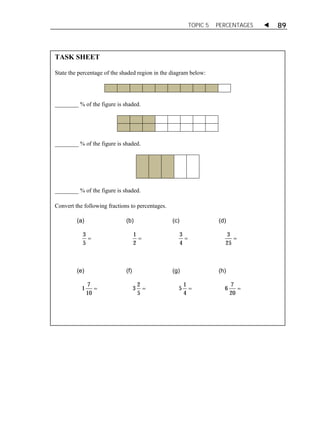
TASK SHEET
ACTIVITY 1
1. Convert the following decimal to percentage.
(a) 0.4 =
(b) 0.7 = (c) 0.6 = (d) 0.9 =
(e) 0.53 =
(f) 0.78 = (g) 0.13 = (h) 0.66 =
2. Convert the following decimal to percentage.
(a) 1.5 =
(b) 3.1 = (c) 2.7 = (d) 9.1 =
(e) 5.01 =
(f) 1.99 = (g) 3.14 = (h) 8.08 =](https://image.slidesharecdn.com/hbmt3203math-141006185850-conversion-gate02/85/HBMT-3203-95-320.jpg)
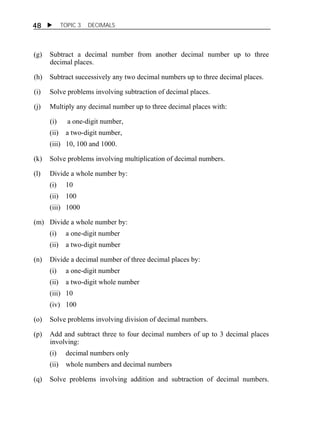
![ TOPIC 9 AVERAGES
168
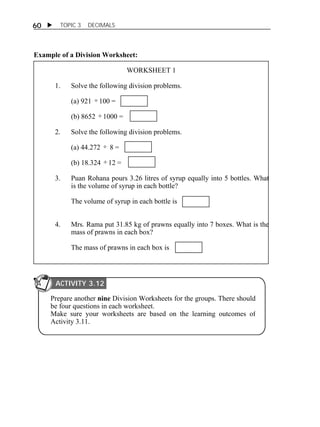
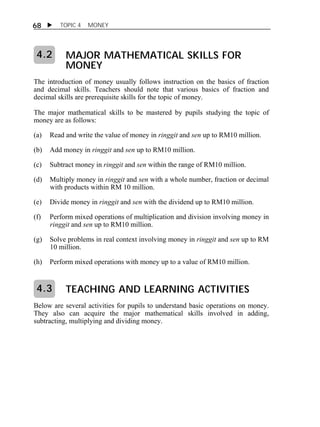
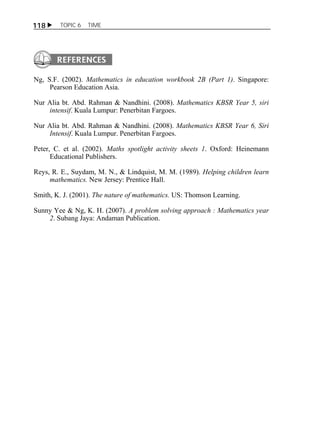
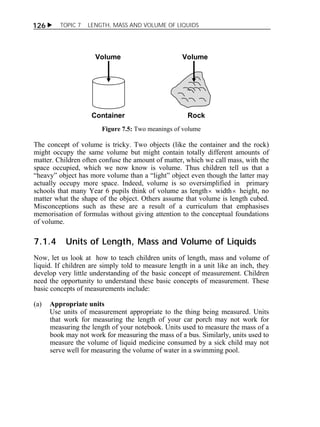
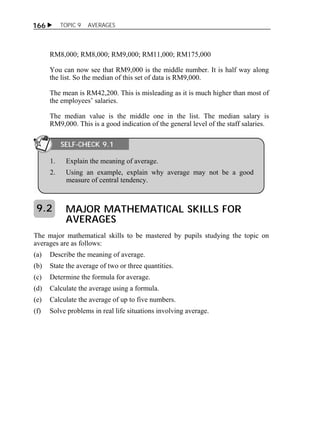
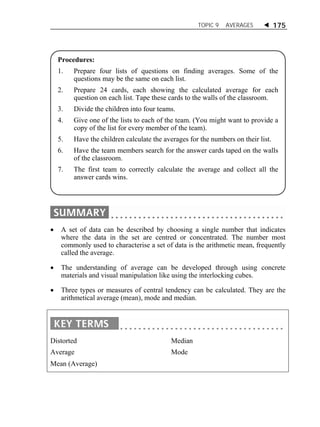
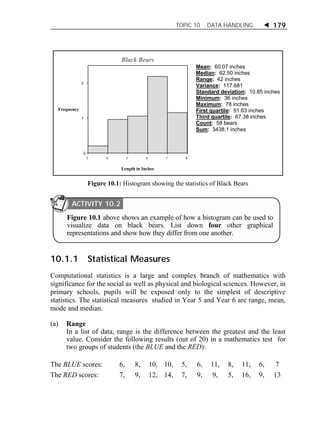
5. Ask the children,
“Are all the five stacks of the same height?” [Yes]
“How many blocks are there in each stack?”[3]
“Does each stack have the same number of blocks?”[Yes]
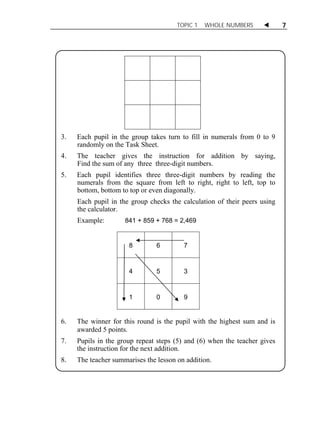
6. The teacher explains by saying,
Each stack has three blocks; three is the average of the set of blocks.
7. Repeat step (1) through (6) using different number of stacks and
different number of blocks in each stack.
ACTIVITY 9.4
Learning Outcome:
To investigate the addition-division process for determining average.
Materials:
Task Sheet; and
Interlocking blocks.
Procedures:
1. Using 15 interlocking blocks arrange five stacks of blocks as
illustrated below (as in Activity 1).
2. Have the children demonstrate the meaning of average by having a
pupil remove enough blocks from the tallest stack to put atop the
shortest stack so that both stacks match the middle stack.](https://image.slidesharecdn.com/hbmt3203math-141006185850-conversion-gate02/85/HBMT-3203-172-320.jpg)

Here are some suggested activities to teach addition of whole numbers: 1. Use base-10 blocks or bundles of sticks to model addition problems concretely. For example, show 34 + 25 by using 3 tens rods and 4 unit blocks for 34, and 2 tens rods and 5 unit blocks for 25, and combining them to show the total of 59. 2. Use place value mats or place value charts to show the addition algorithm. For example, write 34 in the tens place and 25 in the ones place of the mat, then count up to show 59. 3. Play addition war games where students flip over addition fact cards and use mental math to solve. The first to solve correctly keeps the cards.