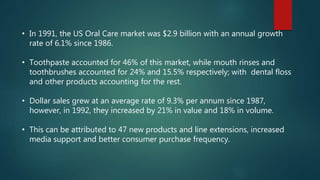
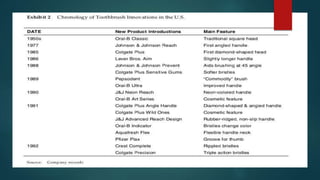
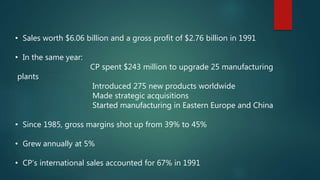
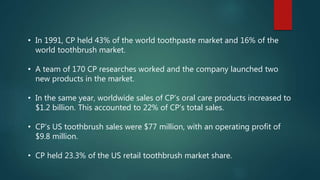
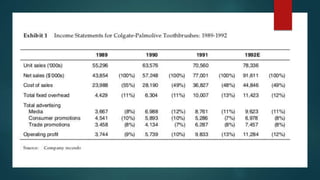
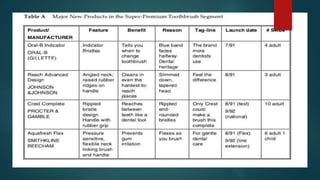
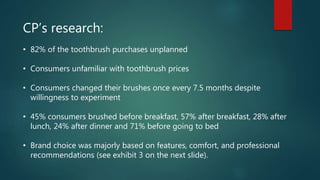
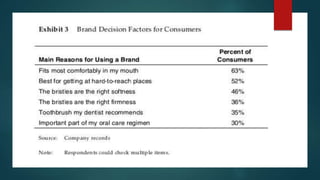
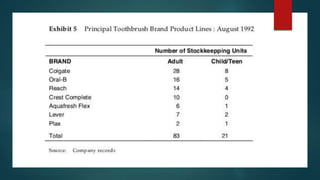
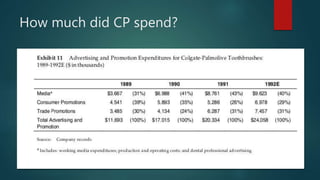
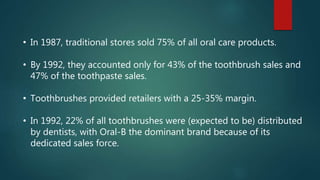
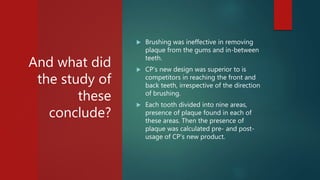
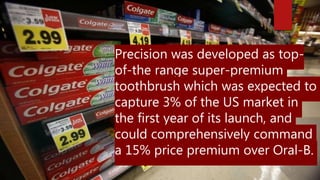
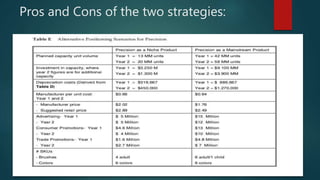
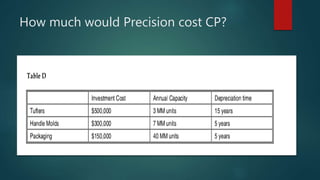
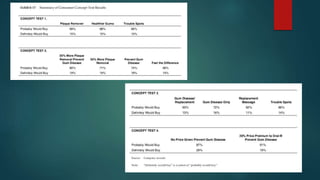
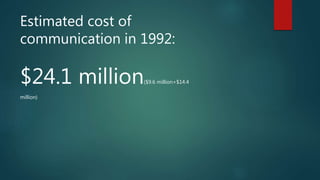
Harvard Business Review
Colgate Palmolive
A Case Study
Important takeaways:
• The US oral care market: Size, relative market shares
• Consumer Habits: Preferences, influences, spending allowances
• Competition: Both internal and external factors
• The Precision marketing strategy
• Conclusion
Major
Decision-
Makers:
 Susan Steinberg – Precision Product
Manager
 Nigel Burton – Divisional General
Manager
 Mark Ruben - Colgate Palmolive’s
C.E.O
 John Phillips – Colgate Plus Product
Manager
The US Oral Care
Market
HISTORY AND SOME
IMPORTANT NUMBERS
• In 1991, the US Oral Care market was $2.9 billion with an annual growth
rate of 6.1% since 1986.
• Toothpaste accounted for 46% of this market, while mouth rinses and
toothbrushes accounted for 24% and 15.5% respectively; with dental floss
and other products accounting for the rest.
• Dollar sales grew at an average rate of 9.3% per annum since 1987,
however, in 1992, they increased by 21% in value and 18% in volume.
• This can be attributed to 47 new products and line extensions, increased
media support and better consumer purchase frequency.
Knowing Colgate
Palmolive
• Sales worth $6.06 billion and a gross profit of $2.76 billion in 1991
• In the same year:
CP spent $243 million to upgrade 25 manufacturing
plants
Introduced 275 new products worldwide
Made strategic acquisitions
Started manufacturing in Eastern Europe and China
• Since 1985, gross margins shot up from 39% to 45%
• Grew annually at 5%
• CP’s international sales accounted for 67% in 1991
• In 1991, CP held 43% of the world toothpaste market and 16% of the
world toothbrush market.
• A team of 170 CP researches worked and the company launched two
new products in the market.
• In the same year, worldwide sales of CP’s oral care products increased to
$1.2 billion. This accounted to 22% of CP’s total sales.
• CP’s US toothbrush sales were $77 million, with an operating profit of
$9.8 million.
• CP held 23.3% of the US retail toothbrush market share.
Product
Segments
HOW DID THE US
MARKET LOOK?
In 1980s, the toothbrush category was divided into two segments:
• Value
• Professional
In the late 1980s, a new segment by the name of “super-premium”
emerged. These brushes were priced at $2.29 to $2.89 and by 1992,
they accounted for 46% of the dollar sales.
CP’s research:
• 82% of the toothbrush purchases unplanned
• Consumers unfamiliar with toothbrush prices
• Consumers changed their brushes once every 7.5 months despite
willingness to experiment
• 45% consumers brushed before breakfast, 57% after breakfast, 28% after
lunch, 24% after dinner and 71% before going to bed
• Brand choice was majorly based on features, comfort, and professional
recommendations (see exhibit 3 on the next slide).
Competition
In order to have an understanding of
how the US oral care market looked like
and who were the major competitors,
one must look beyond plain text. The
exhibits in the next slides will give a
clear (better) picture.
Advertising
• Hard to create demand, hence, focus on stealing the market share.
• Johnson & Johnson spent $8 million to introduce its new product Reach, Oral-B spent $10
million to launch Indicator brush, while Proctor & Gamble was expected to support Crest
Complete with $15 million in media expenditures.
• The exhibit on slide 23 provides a complete picture on the major players’ advertising strategies.
Total Expenditure in media and advertising:
$55 million in 1992
$70 million in 1993
How much did CP spend?
Distribution
• In 1987, traditional stores sold 75% of all oral care products.
• By 1992, they accounted only for 43% of the toothbrush sales and
47% of the toothpaste sales.
• Toothbrushes provided retailers with a 25-35% margin.
• In 1992, 22% of all toothbrushes were (expected to be) distributed
by dentists, with Oral-B the dominant brand because of its
dedicated sales force.
The Colgate
Precision
Marketing Mix
Product Design
and Testing
In 1989, CP created a task force
comprising of:
• R&D and Marketing executives
• Outside consultants
• Dental Professionals
Their mission was “to develop a superior,
technical, plaque removing device”
The task force had 5 goals:
Understanding
Understanding the varying
techniques consumers used
while brushing teeth.
Testing
Testing the between-teeth
access of various toothbrush
designs.
Establishing
Establishing an index to score
clinical plaque-removal efficacy
at the gum line between teeth.
The task force had 5 goals:
(cont.)
Creating
Creating a bristle configuration
and handle design offering
maximum plaque removal efficacy.
Determining
Determining through research the
efficacy and acceptance of the new
design
And what did
the study of
these
conclude?
 Brushing was ineffective in removing
plaque from the gums and in-between
teeth.
 CP’s new design was superior to is
competitors in reaching the front and
back teeth, irrespective of the direction
of brushing.
 Each tooth divided into nine areas,
presence of plaque found in each of
these areas. Then the presence of
plaque was calculated pre- and post-
usage of CP’s new product.
And what did
the study of
these
conclude?
(cont.)
 The studies established that the new
product removed on an average 35%
more plaque than its competitors.
 The overall acceptance of the product
was determined through 18-month
tests amongst different groups.
Market
Positioning
Precision was developed as top-
of-the range super-premium
toothbrush which was expected to
capture 3% of the US market in
the first year of its launch, and
could comprehensively command
a 15% price premium over Oral-B.
Colgate Palmolive had two options:
1.To position Precision as a niche product
2.Or, to position it as a mainstream product
Both the strategies had their own pros and cons.
Pros and Cons of the two strategies:
With a niche product strategy, Precision would have a 3% share
in retail sales by the end of year 1 and 5% by the end of year 2.
With a mainstream marketing strategy, the same would change
to 10% in year 1 and 14.7% in year 2.
Total category unit volumes were expected to be 268 million in
1993 and 300 million in 1994.
Capacity and
Investment
Costs
How much would Precision cost CP?
Communication
and Promotion
After establishing the product design, CP conducted four
concept tests. These tests were conducted amongst 400
individuals in the age group 18 to 54, and the sample size
consisted of the ones who were regular users of Colgate Plus,
Reach and Oral-B.
Simple
arithmetic
mean of the
exhibit given
suggests that:
 Test 1: 67.67% would probably buy the
product
11.67% would definitely buy the
product
 Test 2: 73.50% would probably buy the
product
17.50% would definitely buy the
product
 Test 3: 65.75% would probably buy the
product
13.50% would definitely buy the
product
 Test 4: 74.00% would probably buy the
product
24.00% would definitely buy the
product
Estimated cost of
communication in 1992:
$24.1 million($9.6 million+$14.4
million)
What do we
conclude?
Steinberg viewed Precision was more than a simple line extension.
The case talked about how Precision should be positioned,
followed the path of its development, testing, and pricing.
The case gave a background to the US oral care market and
backed it with concrete numbers taken directly from the company
records.
THANK YOU

Harvard business review colgate palmolive case study

  • 1.
    Harvard Business Review ColgatePalmolive A Case Study
  • 2.
    Important takeaways: • TheUS oral care market: Size, relative market shares • Consumer Habits: Preferences, influences, spending allowances • Competition: Both internal and external factors • The Precision marketing strategy • Conclusion
  • 3.
    Major Decision- Makers:  Susan Steinberg– Precision Product Manager  Nigel Burton – Divisional General Manager  Mark Ruben - Colgate Palmolive’s C.E.O  John Phillips – Colgate Plus Product Manager
  • 4.
    The US OralCare Market HISTORY AND SOME IMPORTANT NUMBERS
  • 5.
    • In 1991,the US Oral Care market was $2.9 billion with an annual growth rate of 6.1% since 1986. • Toothpaste accounted for 46% of this market, while mouth rinses and toothbrushes accounted for 24% and 15.5% respectively; with dental floss and other products accounting for the rest. • Dollar sales grew at an average rate of 9.3% per annum since 1987, however, in 1992, they increased by 21% in value and 18% in volume. • This can be attributed to 47 new products and line extensions, increased media support and better consumer purchase frequency.
  • 7.
  • 8.
    • Sales worth$6.06 billion and a gross profit of $2.76 billion in 1991 • In the same year: CP spent $243 million to upgrade 25 manufacturing plants Introduced 275 new products worldwide Made strategic acquisitions Started manufacturing in Eastern Europe and China • Since 1985, gross margins shot up from 39% to 45% • Grew annually at 5% • CP’s international sales accounted for 67% in 1991
  • 9.
    • In 1991,CP held 43% of the world toothpaste market and 16% of the world toothbrush market. • A team of 170 CP researches worked and the company launched two new products in the market. • In the same year, worldwide sales of CP’s oral care products increased to $1.2 billion. This accounted to 22% of CP’s total sales. • CP’s US toothbrush sales were $77 million, with an operating profit of $9.8 million. • CP held 23.3% of the US retail toothbrush market share.
  • 11.
  • 12.
    In 1980s, thetoothbrush category was divided into two segments: • Value • Professional In the late 1980s, a new segment by the name of “super-premium” emerged. These brushes were priced at $2.29 to $2.89 and by 1992, they accounted for 46% of the dollar sales.
  • 14.
    CP’s research: • 82%of the toothbrush purchases unplanned • Consumers unfamiliar with toothbrush prices • Consumers changed their brushes once every 7.5 months despite willingness to experiment • 45% consumers brushed before breakfast, 57% after breakfast, 28% after lunch, 24% after dinner and 71% before going to bed • Brand choice was majorly based on features, comfort, and professional recommendations (see exhibit 3 on the next slide).
  • 16.
  • 17.
    In order tohave an understanding of how the US oral care market looked like and who were the major competitors, one must look beyond plain text. The exhibits in the next slides will give a clear (better) picture.
  • 21.
  • 22.
    • Hard tocreate demand, hence, focus on stealing the market share. • Johnson & Johnson spent $8 million to introduce its new product Reach, Oral-B spent $10 million to launch Indicator brush, while Proctor & Gamble was expected to support Crest Complete with $15 million in media expenditures. • The exhibit on slide 23 provides a complete picture on the major players’ advertising strategies. Total Expenditure in media and advertising: $55 million in 1992 $70 million in 1993
  • 25.
    How much didCP spend?
  • 26.
  • 27.
    • In 1987,traditional stores sold 75% of all oral care products. • By 1992, they accounted only for 43% of the toothbrush sales and 47% of the toothpaste sales. • Toothbrushes provided retailers with a 25-35% margin. • In 1992, 22% of all toothbrushes were (expected to be) distributed by dentists, with Oral-B the dominant brand because of its dedicated sales force.
  • 28.
  • 29.
  • 30.
    In 1989, CPcreated a task force comprising of: • R&D and Marketing executives • Outside consultants • Dental Professionals Their mission was “to develop a superior, technical, plaque removing device”
  • 31.
    The task forcehad 5 goals: Understanding Understanding the varying techniques consumers used while brushing teeth. Testing Testing the between-teeth access of various toothbrush designs. Establishing Establishing an index to score clinical plaque-removal efficacy at the gum line between teeth.
  • 32.
    The task forcehad 5 goals: (cont.) Creating Creating a bristle configuration and handle design offering maximum plaque removal efficacy. Determining Determining through research the efficacy and acceptance of the new design
  • 34.
    And what did thestudy of these conclude?  Brushing was ineffective in removing plaque from the gums and in-between teeth.  CP’s new design was superior to is competitors in reaching the front and back teeth, irrespective of the direction of brushing.  Each tooth divided into nine areas, presence of plaque found in each of these areas. Then the presence of plaque was calculated pre- and post- usage of CP’s new product.
  • 35.
    And what did thestudy of these conclude? (cont.)  The studies established that the new product removed on an average 35% more plaque than its competitors.  The overall acceptance of the product was determined through 18-month tests amongst different groups.
  • 36.
  • 37.
    Precision was developedas top- of-the range super-premium toothbrush which was expected to capture 3% of the US market in the first year of its launch, and could comprehensively command a 15% price premium over Oral-B.
  • 38.
    Colgate Palmolive hadtwo options: 1.To position Precision as a niche product 2.Or, to position it as a mainstream product Both the strategies had their own pros and cons.
  • 39.
    Pros and Consof the two strategies:
  • 40.
    With a nicheproduct strategy, Precision would have a 3% share in retail sales by the end of year 1 and 5% by the end of year 2. With a mainstream marketing strategy, the same would change to 10% in year 1 and 14.7% in year 2. Total category unit volumes were expected to be 268 million in 1993 and 300 million in 1994.
  • 41.
  • 42.
    How much wouldPrecision cost CP?
  • 43.
  • 44.
    After establishing theproduct design, CP conducted four concept tests. These tests were conducted amongst 400 individuals in the age group 18 to 54, and the sample size consisted of the ones who were regular users of Colgate Plus, Reach and Oral-B.
  • 46.
    Simple arithmetic mean of the exhibitgiven suggests that:  Test 1: 67.67% would probably buy the product 11.67% would definitely buy the product  Test 2: 73.50% would probably buy the product 17.50% would definitely buy the product  Test 3: 65.75% would probably buy the product 13.50% would definitely buy the product  Test 4: 74.00% would probably buy the product 24.00% would definitely buy the product
  • 47.
    Estimated cost of communicationin 1992: $24.1 million($9.6 million+$14.4 million)
  • 48.
  • 49.
    Steinberg viewed Precisionwas more than a simple line extension. The case talked about how Precision should be positioned, followed the path of its development, testing, and pricing. The case gave a background to the US oral care market and backed it with concrete numbers taken directly from the company records.
  • 50.