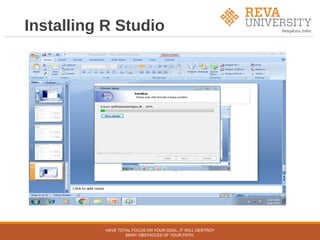
The document outlines an agenda for a workshop on hands-on data science with R. The pre-lunch session covers R fundamentals including installing R and RStudio, data types and structures, control flow, and data import/export. The post-lunch session covers data analysis techniques in R like working with datasets, visualization, classification, regression, clustering, and association rule mining. Examples use the built-in iris dataset and other datasets.


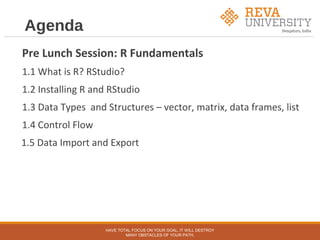


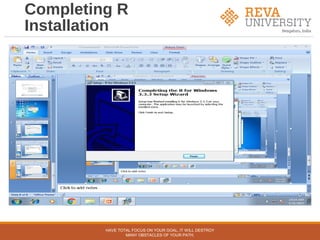

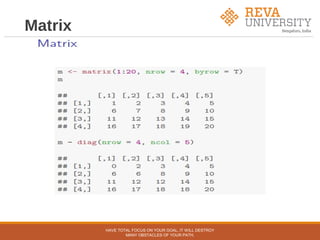
![Working with iris dataset
>iris[1:5] ----to print all 5 columns of iris data set
>iris[1:2] --- to print first two columns of iris data set
>iris[5] – to print only 5th
column of iris data set
>head(iris) --- first five records of iris data set
>tail(iris) --- last five records of iris data set
>iris[1:10, "Sepal.Length"]---- first 10 values in column Sepal.Length
> iris$Sepal.Length[1:10]-----same as above
Individual variables with summary(iris)
>summary(iris)
>quantile(iris$Sepal.Length)
HAVE TOTAL FOCUS ON YOUR GOAL, IT WILL DESTROY
MANY OBSTACLES OF YOUR PATH.](https://image.slidesharecdn.com/hands-ondatasciencewithr-180201044503/85/Hands-on-data-science-with-r-pptx-33-320.jpg)
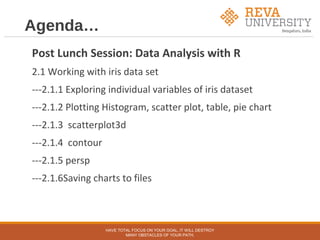
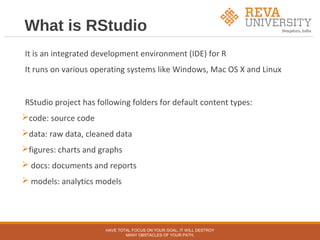
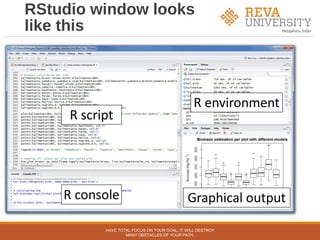
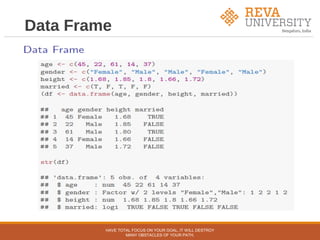
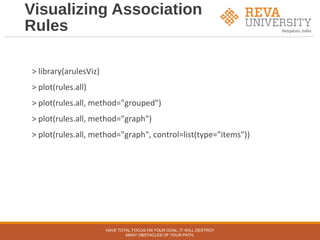
![Heatmap and Contour
plot
A heat map presents a 2D display of a data matrix, which can be
generated with heatmap() in R. We calculate the similarity between
different lowers in the iris data with dist() and then plot it with a heat
map.
> distMatrix <- as.matrix(dist(iris[,1:4]))
> heatmap(distMatrix)
Contour plot needs lattice library
>library(lattice)
>filled.contour(volcano, color=terrain.colors, asp=1,
+ plot.axes=contour(volcano, add=T))
HAVE TOTAL FOCUS ON YOUR GOAL, IT WILL DESTROY
MANY OBSTACLES OF YOUR PATH.](https://image.slidesharecdn.com/hands-ondatasciencewithr-180201044503/85/Hands-on-data-science-with-r-pptx-37-320.jpg)
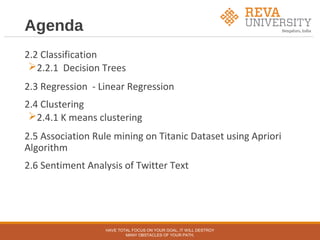
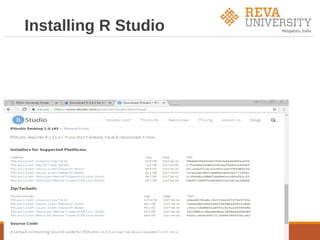
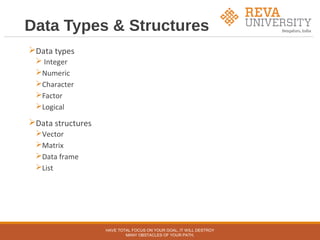
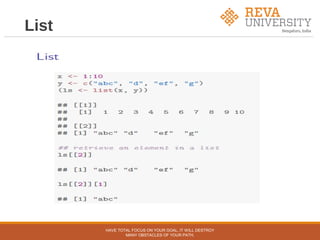
![Covariance and
Correlation
> cov(iris$Sepal.Length, iris$Petal.Length)
>cov(iris[,1:4])
> cor(iris$Sepal.Length, iris$Petal.Length)
> cor(iris[,1:4])
HAVE TOTAL FOCUS ON YOUR GOAL, IT WILL DESTROY
MANY OBSTACLES OF YOUR PATH.](https://image.slidesharecdn.com/hands-ondatasciencewithr-180201044503/85/Hands-on-data-science-with-r-pptx-40-320.jpg)
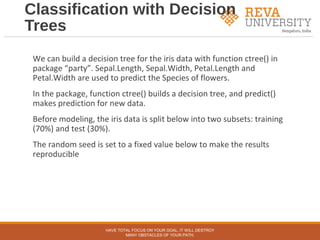
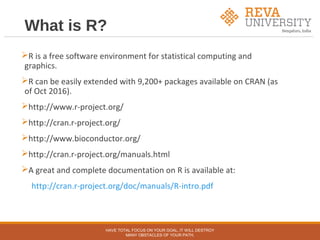
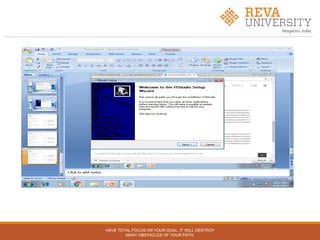
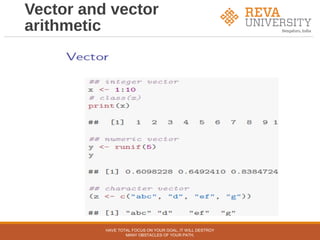
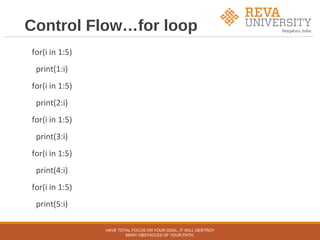
![Decision Trees
> set.seed(1234)
> ind <- sample(2, nrow(iris), replace=TRUE, prob=c(0.7, 0.3))
> trainData <- iris[ind==1,]
> testData <- iris[ind==2,]
> library(party) #party package is required to create decision trees
> myFormula <- Species ~ Sepal.Length + Sepal.Width + Petal.Length +
Petal.Width
> iris_ctree <- ctree(myFormula, data=trainData)
> # check the prediction
> table(predict(iris_ctree), trainData$Species)
> print(iris_ctree)
HAVE TOTAL FOCUS ON YOUR GOAL, IT WILL DESTROY
MANY OBSTACLES OF YOUR PATH.](https://image.slidesharecdn.com/hands-ondatasciencewithr-180201044503/85/Hands-on-data-science-with-r-pptx-42-320.jpg)
![Plotting clusters
> plot(iris2[c("Sepal.Length", "Sepal.Width")], col =
kmeans.result$cluster)
# plot cluster centers
> points(kmeans.result$centers[,c("Sepal.Length", "Sepal.Width")], col
= 1:3, pch = 8, cex=2)
HAVE TOTAL FOCUS ON YOUR GOAL, IT WILL DESTROY
MANY OBSTACLES OF YOUR PATH.](https://image.slidesharecdn.com/hands-ondatasciencewithr-180201044503/85/Hands-on-data-science-with-r-pptx-48-320.jpg)
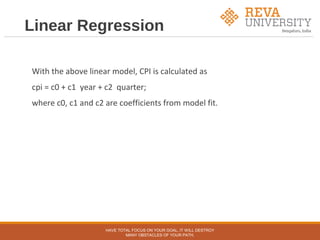
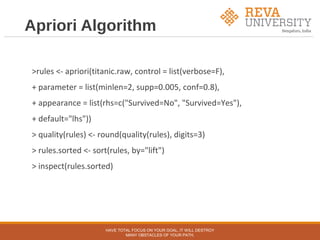
![Association Rule Mining
on Titanic dataset
Attributes - Passenger class, Gender, Child, Survived
> str(Titanic)
table [1:4, 1:2, 1:2, 1:2] 0 0 35 0 0 0 17 0 118 154 ...
- attr(*, "dimnames")=List of 4
..$ Class : chr [1:4] "1st" "2nd" "3rd" "Crew"
..$ Sex : chr [1:2] "Male" "Female"
..$ Age : chr [1:2] "Child" "Adult"
..$ Survived: chr [1:2] "No" "Yes"
> df <- as.data.frame(Titanic)
> head(df)
HAVE TOTAL FOCUS ON YOUR GOAL, IT WILL DESTROY
MANY OBSTACLES OF YOUR PATH.](https://image.slidesharecdn.com/hands-ondatasciencewithr-180201044503/85/Hands-on-data-science-with-r-pptx-49-320.jpg)
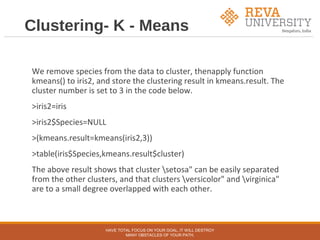
![Titanic Raw
> titanic.raw <- NULL
> for(i in 1:4) {
+ titanic.raw <- cbind(titanic.raw, rep(as.character(df[,i]), df$Freq))
+ }
> titanic.raw <- as.data.frame(titanic.raw)
> names(titanic.raw) <- names(df)[1:4]
> str(titanic.raw)
> dim(titanic.raw)
> str(titanic.raw)
HAVE TOTAL FOCUS ON YOUR GOAL, IT WILL DESTROY
MANY OBSTACLES OF YOUR PATH.](https://image.slidesharecdn.com/hands-ondatasciencewithr-180201044503/85/Hands-on-data-science-with-r-pptx-51-320.jpg)
![Removing redundant
rules
> subset.matrix <- is.subset(rules.sorted, rules.sorted)
> subset.matrix[lower.tri(subset.matrix, diag=T)] <- NA
> redundant <- colSums(subset.matrix, na.rm=T) >= 1
> which(redundant)
> # remove redundant rules
> rules.pruned <- rules.sorted[!redundant]
> inspect(rules.pruned)
HAVE TOTAL FOCUS ON YOUR GOAL, IT WILL DESTROY
MANY OBSTACLES OF YOUR PATH.](https://image.slidesharecdn.com/hands-ondatasciencewithr-180201044503/85/Hands-on-data-science-with-r-pptx-54-320.jpg)


![Introduction to Pandas and Time Series Analysis [Budapest BI Forum]](https://cdn.slidesharecdn.com/ss_thumbnails/introductiontopandasandtimeseriesanalysis-170617163829-thumbnail.jpg?width=640&height=640&fit=bounds)


![[Deck] What's New in Spark-Iceberg Integration via DSV2.pptx](https://cdn.slidesharecdn.com/ss_thumbnails/deckwhatsnewinspark-icebergintegrationviadsv2-260210005337-25955b12-thumbnail.jpg?width=640&height=640&fit=bounds)


