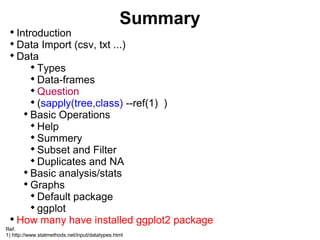
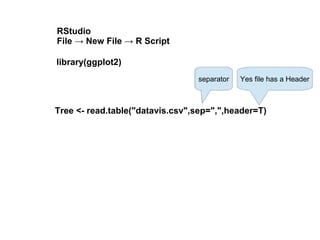
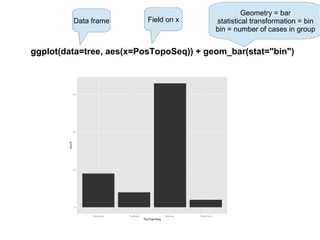
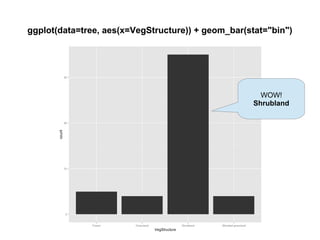
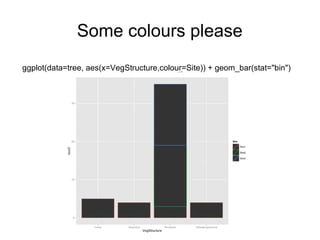
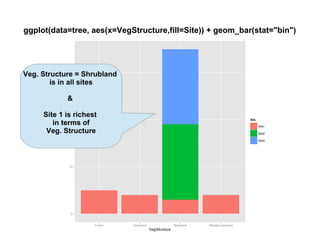
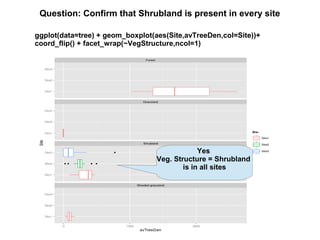
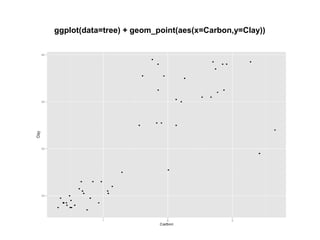
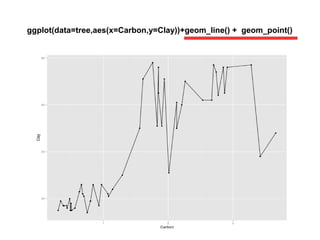
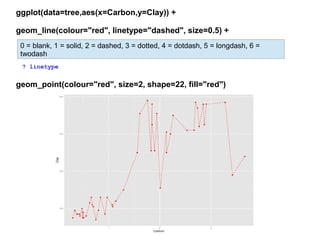
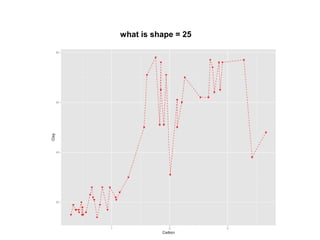
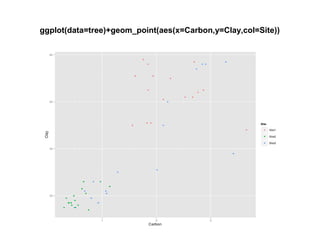
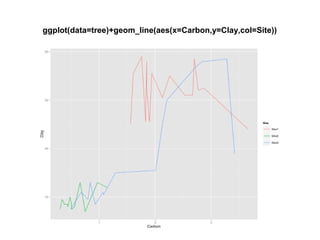
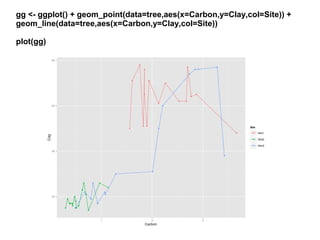
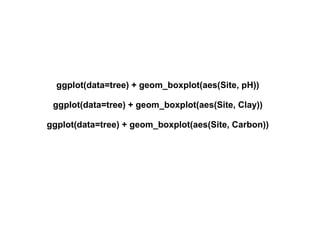
This document summarizes a brown-bag seminar on introducing R and data visualization. It covers loading and exploring data; basic data types and data frames; performing operations and asking questions of the data; subsetting, filtering, and handling duplicates and missing values; basic statistical analysis and graphs; and using the ggplot2 package to create bar plots, scatter plots, line graphs, box plots and more to visualize relationships in the data. Key points covered include using geom_bar with stat="bin", adding colors and facets, setting linetype and point shapes, and layering geoms to overlay points and lines on the same plot.


![Introduction to Pandas and Time Series Analysis [PyCon DE]](https://cdn.slidesharecdn.com/ss_thumbnails/introductiontopandasandtimeseriesanalysispyconde-170617163724-thumbnail.jpg?width=640&height=640&fit=bounds)


![[DSC Europe 25] Tamas Srancsik - How To Teach Your AI Football? An Argument f...](https://cdn.slidesharecdn.com/ss_thumbnails/bcjh1m9xtbosv20ucftb-tamas-srancsik-how-to-teach-your-ai-football-260121115910-08b53e9e-thumbnail.jpg?width=640&height=640&fit=bounds)


![[DSC Europe 25] Ratko Nikolic - BI with AI: Automating Business Intelligence ...](https://cdn.slidesharecdn.com/ss_thumbnails/ecd7hahhq6qiwefuoiyw-dsc2025-ratko-nikolic-ai-data-analyst-260119101519-54d52956-thumbnail.jpg?width=640&height=640&fit=bounds)
![[DSC Europe 25] Marcos Heidemann - Beyond the Hype: Making AI Coding Assistan...](https://cdn.slidesharecdn.com/ss_thumbnails/eexkhvldrjsopspdjbur-marcos-heidemann-beyond-the-hype-getting-real-value-out-of-ai-assisted-coding-260121115910-7e9d41ec-thumbnail.jpg?width=640&height=640&fit=bounds)