Download to read offline

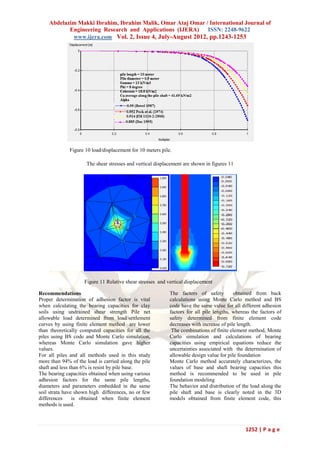
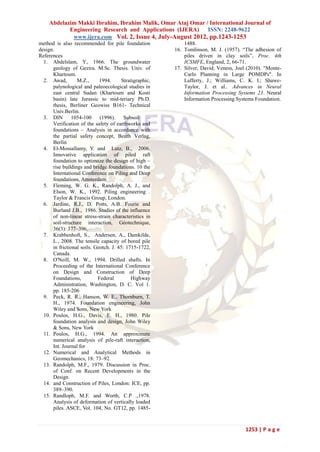

The study assesses the load-carrying capacity of bored piles in clay soil using various methods, emphasizing the complexities of predicting capacity due to factors like soil conditions and construction practices. It employs simulations with MATLAB and finite element methods to analyze different pile lengths and loading conditions in the Khartoum area, providing comparative results on safety and load capacity based on different codes and adhesion factors. Ultimately, the research highlights the importance of accounting for geotechnical characteristics in pile design to ensure structural integrity.


![5G Explained! A High Level Overview [Introduction]](https://cdn.slidesharecdn.com/ss_thumbnails/5gexplainedahighleveloverview-260119165306-cc137a3e-thumbnail.jpg?width=640&height=640&fit=bounds)


