Downloaded 21 times


![P/E Ratio Behaviors
• Price = No growth value/share
P0 = E1/k + PVGO
or
• P0/E1= [1+ PVGO]/k
E1/k
Time
P/E
average](https://image.slidesharecdn.com/ddm-150127042707-conversion-gate01/85/Ddm-12-320.jpg)

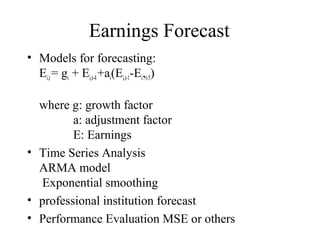


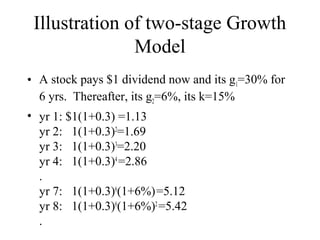
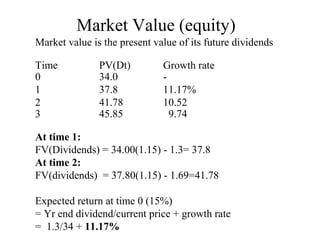
The document provides an overview of fundamental analysis techniques for equity valuation including macroeconomics analysis, industry analysis, the dividend discount model, and financial statement analysis. It discusses analyzing key macroeconomic variables, industry life cycles, using the dividend discount model and multi-stage growth models to value stocks, analyzing P/E ratios, forecasting earnings, and performing ratio analysis and Du Pont analysis on financial statements.