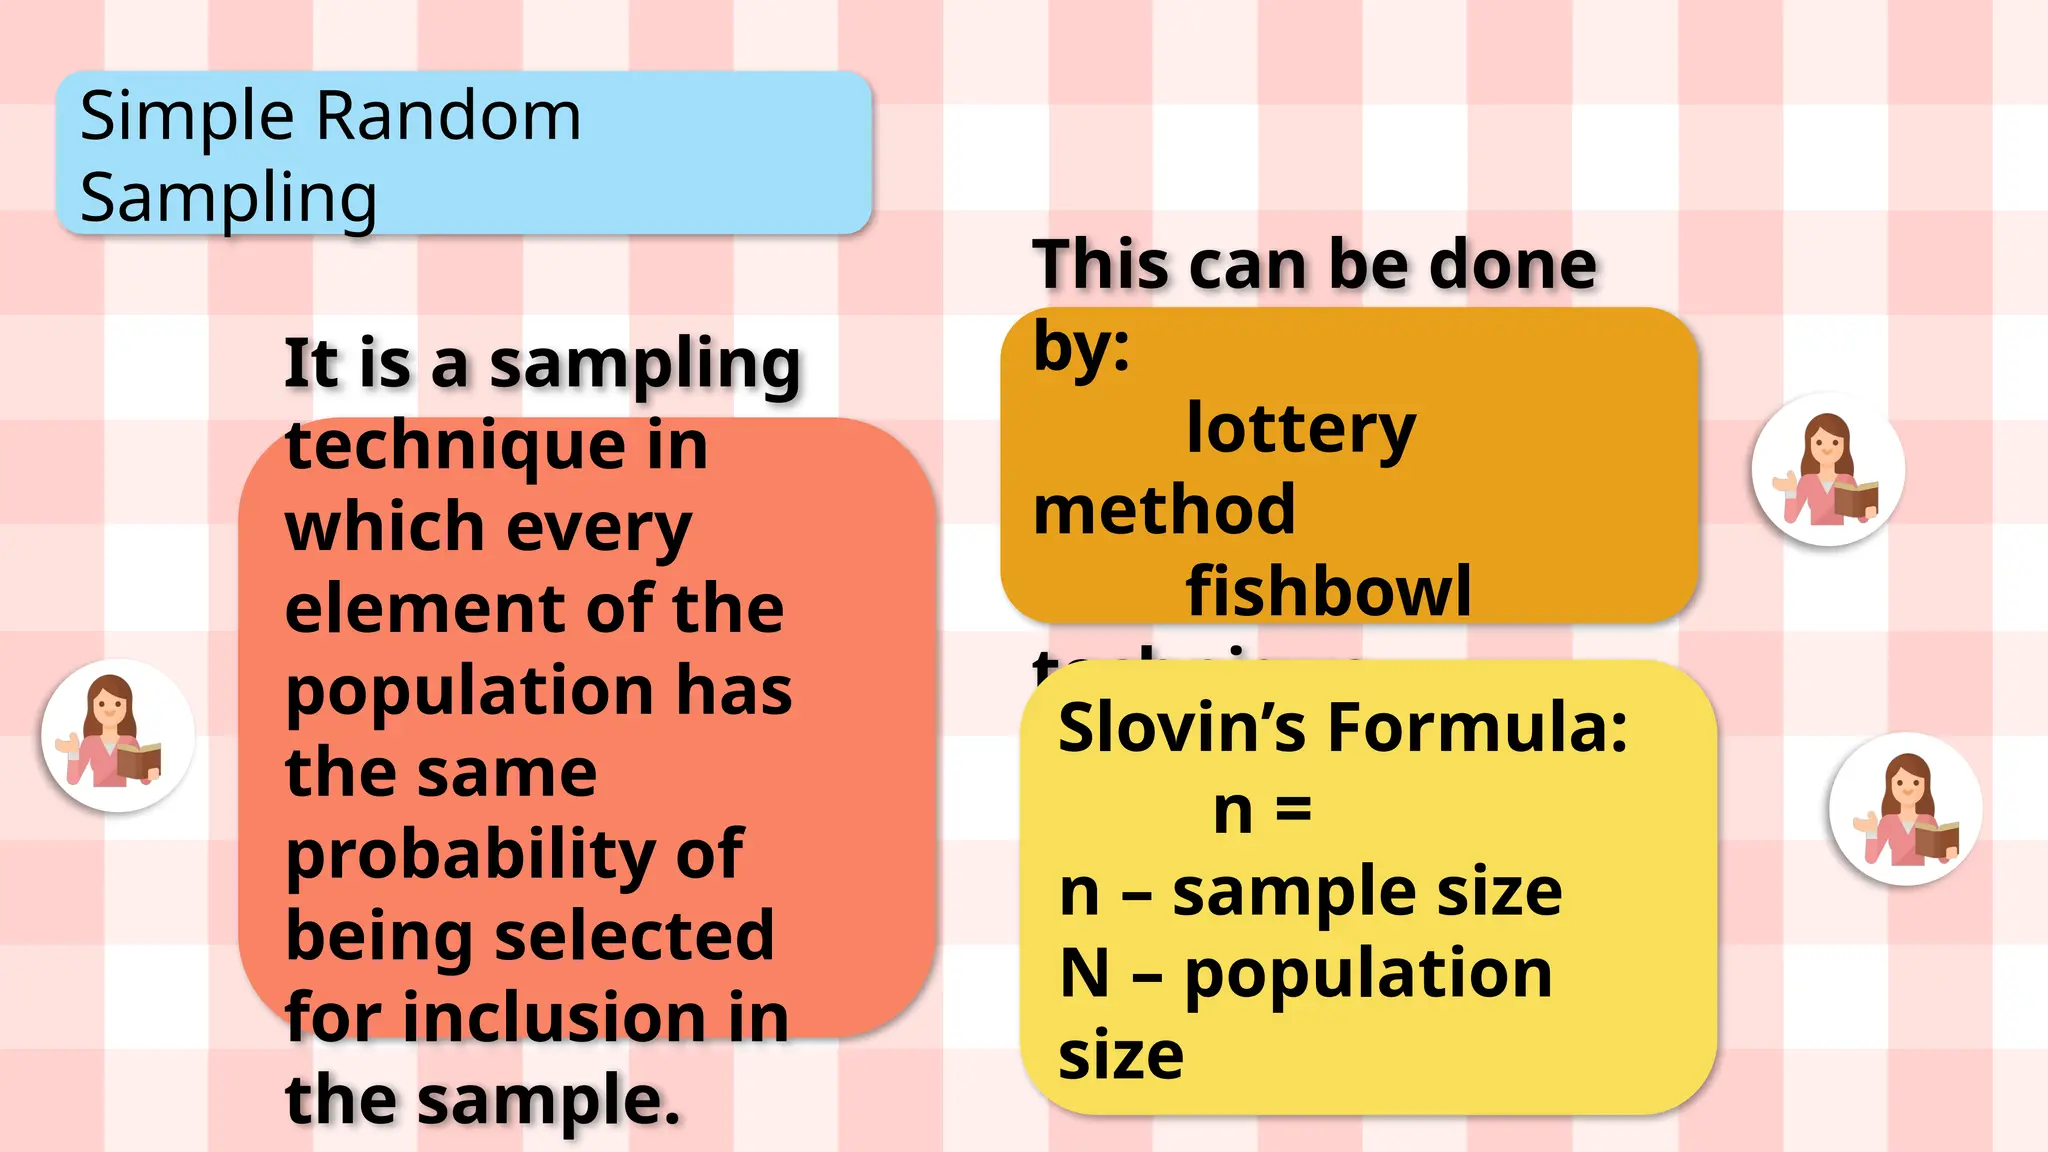
StatisticsandProbability _ X
Module1 Module2 Module3
Module4 Module5 Module6
Math
111
Math
112
Others
Statistics
and
Probability
Module 3
Module 2
Module 5
Module 1
Module 4
Third Quarter
Fourth Quarter
Tell me the color not the word.
YELLOW
BROWN
GREEN
PURPLE
WHITE
BLACK
GREEN
BLUE
YELLOW
WHITE
Tell me the word not the color.
1
2
Lesson and
Coverage
Learning
Competencies
Random Sampling
Lesson and
Coverage
Learning
Competencies
- illustrates a random sampling
- distinguishes between parameter and statistic
- identifies sampling distributions of
statistics :sample mean
- find the mean and variance of the sampling
distribution of the sample mean
- defines the sampling distribution of the sample
mean for normal population when the variance
is: a: known; b: unknown
Lesson:
Random
Sampling
Gathering useful information for a research
study from large group of individuals or objects
does not only involve a great deal of time, but is
costly as well.
It is also impractical. Sometimes, it is even
impossible to collect data from the research
population that is too large.
To avoid this, researchers resort to sampling
techniques.
What is
Sampling?
It is the process or technique of selecting a
representative sample from the entire
population.
It is a help to the researcher to achieved unbiased
results in his or her study.
Types of Random
Sampling
Simple
Random
Sampling
Systematic
Sampling
Stratified
Sampling
Cluster
Sampling
Simple Random
Sampling
It is a sampling
technique in
which every
element of the
population has
the same
probability of
being selected
for inclusion in
the sample.
This can be done
by:
lottery
method
fishbowl
technique
Slovin’s Formula:
n =
n – sample size
N – population
size
Simple Random
Sampling
You want to study the
effect of social media on
Grade 11 students in
TLMII. You wish to use
the simple random
sampling technique in
choosing the members of
your sample. If there are
1,000 Grade 11 students
in the TLMII, how many
students should there be
in your sample?
Exampl
e Given: N = 1,000
e = 5% - (0.05)
Solution:
n =
n =
n =
n =
n = 285.71
n = 286
Give it a try no. 1
Solve give it a try no. 1.
You want to make a study on the opinions of
Grade 8 students concerning the use of the
Filipino language in the teaching of
mathematics. There are 510 grade 8 students,
how many students should there be in your
sample using Table of Random Numbers?
Systematic Sampling
It is random sampling
technique in which
every kth element of
the population is
selected until the
desired number of
elements in the
sample is obtained.
k - sample
interval
N - population
size
n - sample size
Systematic Sampling
In a group of 250
students, how will you
select a sample
containing 71 students by
using the systematic
sampling technique?
Exampl
e
Given: N = 250
n = 71
Solution:
k =
k =
k = 3.52
k = 4
Give it a try no. 2
Solve give it a try no. 2
Direction: Solve the problem.
1. In a group of 180 workers, how will you select a sample of 36 workers by
using the systematic sampling technique?
Stratified Sampling
It is a random
sampling technique in
which the population
is first divided into
strata and then
samples are randomly
selected separately
from each stratum.
In Stratified
Sampling, the
population is
partitioned into
several groups
called strata, based
on some
characteristics like
year level, gender,
age, etc.
Stratified Sampling
Stratified Sampling
S x n
N – population size
n – sample size
s – elements per
stratum
S – sample per
stratum
You want to interview
200 students in your
school to determine their
opinion on the new
school uniform. How are
you going to choose your
sample by using
stratified sampling if
there are 1, 200
students in grade 7; 1,100
in Grade 8; 1, 050 in Grade
9; 940 in Grade 10; 900 in
Grade 11, and 810 in
Exampl
e Given:
n = 200 students
Grade 7= 1,200 students
Grade 8 = 1,100
students
Grade 9 = 1,050
students
Grade 10 = 940 students
Grade 11 = 900 students
Grade 12 = 810 students
Given:
n = 200 students
Grade 7= 1,200
students
Grade 8 = 1,100
students
Grade 9 = 1,050
students
Grade 10 = 940
students
Solution:
Populatio
n
No.of
students
per
Stratum
Sample
per
stratum
Grade 7 1,200
Grade 8 1,100
Grade 9 1,050
Grade 10 940
Grade 11 900
Grade 12 810
Solution:
Populatio
n
No.of
students
per
Stratum
Sample
per
stratum
Grade 7 1,200
Grade 8 1,100
Grade 9 1,050
Grade 10 940
Grade 11 900
Grade 12 810
Solution:
Formula: S x n
Grade 7 x 200
40
Grade 8 x 200
36.67 37
Grade 9 x 200
35
Solution:
Formula: S x n
Grade 10 x 200
31.33 31
Grade 11 x 200
30
Grade 12 x 200
27
Solution:
Populatio
n
No.of
students
per
Stratum
Sample
per
stratum
Grade 7 1,200
Grade 8 1,100
Grade 9 1,050
Grade 10 940
Grade 11 900
Grade 12 810
Solution:
Populatio
n
No.of
students
per
Stratum
Sample
per
stratum
Grade 7 1,200 40
Grade 8 1,100 37
Grade 9 1,050 35
Grade 10 940 31
Grade 11 900 30
Grade 12 810 27
Give it a try no. 3
Solve give it a try no. 3
Direction: Solve the problem.
1. Marcela, a Statistics student, wants to determine who care more about their
physical appearances, the male or the female students. She wants to limit her
study to the Grade 10 students. There are unequal numbers of Grade 10 students:
340 are male and 500 are female. She wants her sample to consist only of 50
students. She chooses the members of her sample using stratified sampling
technique.
Cluster or Area Sampling
In cluster sampling, the population
is divided into clusters. From these
clusters, a random sample of
clusters will be drawn. All the
elements from the sampled
clusters will make up the sample.
Sometimes, clusters are too large
and there is a need for a second set
of smaller clusters to be taken from
the original clusters.
Cluster or Area Sampling
A researcher could divide the
province into towns. A sample of
towns will be selected using Simple
Random Sampling. She or he could
then divide the towns into barrios.
From these towns, a sample of
barrios will be selected at random.
From these barrios, a sample of
houses will be identified.
Exampl
e
Types of Random
Sampling
Simple
Random
Sampling
Systematic
Sampling
Stratified
Sampling
Cluster
Sampling
Week 4 Activity
Direction: Identify the type of sampling technique used by the researcher in each of the
following situations: simple random sampling, systematic random sampling,
stratified random sampling, or cluster random sampling.
1. The office clerk gave the researcher a list of 500 Grade 10 students. Researcher selected every 20th
name on the list.
2. In a recent research that was conducted in a private school, the subjects of the study were selected
by using the Table of Random Numbers.
3. A researcher interviewed people from each town in the province of Albay for his research on
population.
4. A researcher is doing a research work on the students' reaction to the newly implemented
curriculum in mathematics and interviewed every 10th student entering the gate of the school.
5. A researcher who is studying the effects of educational attainment on promotion conducted a
survey of 50 randomly selected workers from each of these categories: high school graduate, with
undergraduate degrees, with master's degree, and with doctoral degree.
6. A researcher selected a sample of n=120 from a population of 850 by using the
Table of Random Numbers.
7. A researcher interviewed all top 10 Grade 11 students in each of15 randomly
selected private schools in Metro Manila.
8. A researcher randomly selected 10 barangays in a town for her study. She did this
by writing the names of each barangays on a piece of paper which she folded and
put in a bowl then she draw 10 pieces of paper from the bowl.
9. A teacher asked her students to fall in line. He instructed one of them to select
every 5 student on the line.
10. A researcher chose the subjects of her study by selecting every k member of the
population.

grade 11 Statistics and probability Week 4.pptx

  • 1.
    StatisticsandProbability _ X Module1Module2 Module3 Module4 Module5 Module6 Math 111 Math 112 Others
  • 2.
  • 3.
    Module 3 Module 2 Module5 Module 1 Module 4 Third Quarter Fourth Quarter
  • 4.
    Tell me thecolor not the word. YELLOW BROWN GREEN PURPLE WHITE BLACK GREEN BLUE YELLOW WHITE Tell me the word not the color. 1 2
  • 5.
  • 6.
    Lesson and Coverage Learning Competencies - illustratesa random sampling - distinguishes between parameter and statistic - identifies sampling distributions of statistics :sample mean - find the mean and variance of the sampling distribution of the sample mean - defines the sampling distribution of the sample mean for normal population when the variance is: a: known; b: unknown
  • 7.
  • 8.
    Gathering useful informationfor a research study from large group of individuals or objects does not only involve a great deal of time, but is costly as well. It is also impractical. Sometimes, it is even impossible to collect data from the research population that is too large. To avoid this, researchers resort to sampling techniques.
  • 9.
    What is Sampling? It isthe process or technique of selecting a representative sample from the entire population. It is a help to the researcher to achieved unbiased results in his or her study.
  • 10.
  • 11.
    Simple Random Sampling It isa sampling technique in which every element of the population has the same probability of being selected for inclusion in the sample. This can be done by: lottery method fishbowl technique Slovin’s Formula: n = n – sample size N – population size
  • 12.
  • 13.
    You want tostudy the effect of social media on Grade 11 students in TLMII. You wish to use the simple random sampling technique in choosing the members of your sample. If there are 1,000 Grade 11 students in the TLMII, how many students should there be in your sample? Exampl e Given: N = 1,000 e = 5% - (0.05) Solution: n = n = n = n = n = 285.71 n = 286
  • 14.
    Give it atry no. 1 Solve give it a try no. 1. You want to make a study on the opinions of Grade 8 students concerning the use of the Filipino language in the teaching of mathematics. There are 510 grade 8 students, how many students should there be in your sample using Table of Random Numbers?
  • 15.
    Systematic Sampling It israndom sampling technique in which every kth element of the population is selected until the desired number of elements in the sample is obtained. k - sample interval N - population size n - sample size
  • 16.
  • 17.
    In a groupof 250 students, how will you select a sample containing 71 students by using the systematic sampling technique? Exampl e Given: N = 250 n = 71 Solution: k = k = k = 3.52 k = 4
  • 18.
    Give it atry no. 2 Solve give it a try no. 2 Direction: Solve the problem. 1. In a group of 180 workers, how will you select a sample of 36 workers by using the systematic sampling technique?
  • 19.
    Stratified Sampling It isa random sampling technique in which the population is first divided into strata and then samples are randomly selected separately from each stratum. In Stratified Sampling, the population is partitioned into several groups called strata, based on some characteristics like year level, gender, age, etc.
  • 20.
  • 21.
    Stratified Sampling S xn N – population size n – sample size s – elements per stratum S – sample per stratum
  • 22.
    You want tointerview 200 students in your school to determine their opinion on the new school uniform. How are you going to choose your sample by using stratified sampling if there are 1, 200 students in grade 7; 1,100 in Grade 8; 1, 050 in Grade 9; 940 in Grade 10; 900 in Grade 11, and 810 in Exampl e Given: n = 200 students Grade 7= 1,200 students Grade 8 = 1,100 students Grade 9 = 1,050 students Grade 10 = 940 students Grade 11 = 900 students Grade 12 = 810 students
  • 23.
    Given: n = 200students Grade 7= 1,200 students Grade 8 = 1,100 students Grade 9 = 1,050 students Grade 10 = 940 students Solution: Populatio n No.of students per Stratum Sample per stratum Grade 7 1,200 Grade 8 1,100 Grade 9 1,050 Grade 10 940 Grade 11 900 Grade 12 810
  • 24.
    Solution: Populatio n No.of students per Stratum Sample per stratum Grade 7 1,200 Grade8 1,100 Grade 9 1,050 Grade 10 940 Grade 11 900 Grade 12 810 Solution: Formula: S x n Grade 7 x 200 40 Grade 8 x 200 36.67 37 Grade 9 x 200 35
  • 25.
    Solution: Formula: S xn Grade 10 x 200 31.33 31 Grade 11 x 200 30 Grade 12 x 200 27 Solution: Populatio n No.of students per Stratum Sample per stratum Grade 7 1,200 Grade 8 1,100 Grade 9 1,050 Grade 10 940 Grade 11 900 Grade 12 810
  • 26.
    Solution: Populatio n No.of students per Stratum Sample per stratum Grade 7 1,20040 Grade 8 1,100 37 Grade 9 1,050 35 Grade 10 940 31 Grade 11 900 30 Grade 12 810 27
  • 27.
    Give it atry no. 3 Solve give it a try no. 3 Direction: Solve the problem. 1. Marcela, a Statistics student, wants to determine who care more about their physical appearances, the male or the female students. She wants to limit her study to the Grade 10 students. There are unequal numbers of Grade 10 students: 340 are male and 500 are female. She wants her sample to consist only of 50 students. She chooses the members of her sample using stratified sampling technique.
  • 28.
    Cluster or AreaSampling In cluster sampling, the population is divided into clusters. From these clusters, a random sample of clusters will be drawn. All the elements from the sampled clusters will make up the sample. Sometimes, clusters are too large and there is a need for a second set of smaller clusters to be taken from the original clusters.
  • 29.
  • 30.
    A researcher coulddivide the province into towns. A sample of towns will be selected using Simple Random Sampling. She or he could then divide the towns into barrios. From these towns, a sample of barrios will be selected at random. From these barrios, a sample of houses will be identified. Exampl e
  • 31.
  • 32.
    Week 4 Activity Direction:Identify the type of sampling technique used by the researcher in each of the following situations: simple random sampling, systematic random sampling, stratified random sampling, or cluster random sampling. 1. The office clerk gave the researcher a list of 500 Grade 10 students. Researcher selected every 20th name on the list. 2. In a recent research that was conducted in a private school, the subjects of the study were selected by using the Table of Random Numbers. 3. A researcher interviewed people from each town in the province of Albay for his research on population. 4. A researcher is doing a research work on the students' reaction to the newly implemented curriculum in mathematics and interviewed every 10th student entering the gate of the school. 5. A researcher who is studying the effects of educational attainment on promotion conducted a survey of 50 randomly selected workers from each of these categories: high school graduate, with undergraduate degrees, with master's degree, and with doctoral degree.
  • 33.
    6. A researcherselected a sample of n=120 from a population of 850 by using the Table of Random Numbers. 7. A researcher interviewed all top 10 Grade 11 students in each of15 randomly selected private schools in Metro Manila. 8. A researcher randomly selected 10 barangays in a town for her study. She did this by writing the names of each barangays on a piece of paper which she folded and put in a bowl then she draw 10 pieces of paper from the bowl. 9. A teacher asked her students to fall in line. He instructed one of them to select every 5 student on the line. 10. A researcher chose the subjects of her study by selecting every k member of the population.